County result maps
 2005 results map
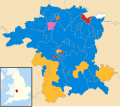 2009 results map
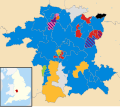 2013 results map
 2017 results map
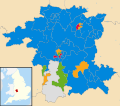 2021 results map
 2025 results map
Worcestershire County Council elections are held every four years. Worcestershire County Council is the upper-tier local authority for the non-metropolitan county of Worcestershire in England. Since the last boundary changes in 2025, 57 councillors have been elected from 53 electoral divisions. [1]
| Year | Conservative | Labour | Liberal Democrats [a] | Reform | Green | Health Concern | UKIP | Independents & Others | Council control after election | |
|---|---|---|---|---|---|---|---|---|---|---|
| Council re-established (57 seats) | ||||||||||
| 1997 [2] | 25 | 22 | 8 | – | 0 | – | 0 | 2 [b] | No overall control | |
| 2001 [2] | 26 | 14 | 9 | – | 0 | 6 | 0 | 2 [c] | No overall control | |
| New division boundaries | ||||||||||
| 2005 [2] | 29 | 17 | 8 | – | 0 | 1 | 0 | 2 [d] | Conservative | |
| 2009 [2] | 42 | 3 | 8 | – | 0 | 2 | 0 | 2 [e] | Conservative | |
| 2013 [2] | 30 | 12 | 3 | – | 2 | 2 | 4 | 4 [f] | Conservative | |
| 2017 [2] | 40 | 10 | 3 | – | 2 | 1 | 0 | 1 | Conservative | |
| 2021 [3] | 45 | 3 | 4 | 0 | 3 | 0 | 0 | 2 | Conservative | |
| New division boundaries [1] | ||||||||||
| 2025 | 12 | 2 | 6 | 27 | 8 | – | 0 | 2 | No overall control | |


| Party | Candidate | Votes | % | ±% | |
|---|---|---|---|---|---|
| Liberal | Graham Ballinger | 1,059 | 50.0 | +8.7 | |
| Conservative | Tracey Onslow | 672 | 31.8 | +9.6 | |
| Health Concern | Howard Martin | 252 | 11.9 | +2.4 | |
| Labour | Dan Watson | 133 | 6.3 | −13.9 | |
| Majority | 387 | 18.3 | |||
| Turnout | 2,116 | ||||
| Liberal hold | Swing | ||||
| Party | Candidate | Votes | % | ±% | |
|---|---|---|---|---|---|
| Conservative | Juliet Brunner | 1,437 | 42.2 | +9.9 | |
| Labour | Debbie Taylor | 1,041 | 30.6 | −15.8 | |
| Liberal Democrats | Diane Thomas | 455 | 13.4 | −7.9 | |
| BNP | Maurice Field | 367 | 10.8 | +10.8 | |
| Independent | Richard Armstrong | 103 | 3.0 | +3.0 | |
| Majority | 396 | 11.6 | |||
| Turnout | 3,403 | ||||
| Conservative gain from Labour | Swing | ||||
| Party | Candidate | Votes | % | ±% | |
|---|---|---|---|---|---|
| Conservative | Tony Miller | 1,088 | 59.2 | −1.2 | |
| Liberal Democrats | Margaret Rowley | 536 | 29.2 | +7.2 | |
| Labour | Chris Barton | 213 | 11.6 | +4.6 | |
| Majority | 552 | 30.0 | |||
| Turnout | 1,837 | ||||
| Conservative hold | Swing | ||||
| Party | Candidate | Votes | % | ±% | |
|---|---|---|---|---|---|
| Conservative | June Griffiths | 637 | 52.6 | +11.6 | |
| Labour | Christopher Bloore | 189 | 15.6 | +6.3 | |
| Independent | Dee Morton | 157 | 13.0 | +13.0 | |
| Liberal Democrats | Howard Allen | 83 | 6.9 | −6.3 | |
| Independent | Kenneth Wheatley | 79 | 6.5 | +6.5 | |
| UKIP | Steven Morson | 65 | 5.4 | −16.6 | |
| Majority | 448 | 37.0 | |||
| Turnout | 1,210 | ||||
| Conservative hold | Swing | ||||
| Party | Candidate | Votes | % | ±% | |
|---|---|---|---|---|---|
| Health Concern | John Thomas | 1,055 | 30.6 | +4.1 | |
| UKIP | John Holden | 892 | 25.8 | −1.7 | |
| Conservative | Chris Rogers | 753 | 21.8 | +2.3 | |
| Labour | Carol Warren | 607 | 17.6 | −5.0 | |
| Green | Angela Hartwich | 77 | 2.2 | −1.7 | |
| BNP | Carl Mason | 39 | 1.1 | +1.1 | |
| Liberal Democrats | Paul Preston | 30 | 0.9 | +0.9 | |
| Majority | 163 | 4.7 | |||
| Turnout | 3,453 | ||||
| Health Concern gain from UKIP | Swing | ||||
| Party | Candidate | Votes | % | ±% | |
|---|---|---|---|---|---|
| Conservative | Nathan Desmond | 504 | 28.0 | +2.9 | |
| UKIP | Peter Willoughby | 442 | 24.6 | −2.8 | |
| Labour | Mumshad Ahmed | 338 | 18.8 | −4.6 | |
| Health Concern | Graham Ballinger | 321 | 17.8 | +2.3 | |
| Independent | Helen Dyke | 195 | 10.8 | +10.8 | |
| Majority | 62 | 3.4 | |||
| Turnout | 1,800 | ||||
| Conservative gain from UKIP | Swing | ||||
| Party | Candidate | Votes | % | ±% | |
|---|---|---|---|---|---|
| UKIP | Peter Bridle | 2,017 | 35.2 | +1.2 | |
| Labour | Phil Mould | 1,601 | 28.0 | −1.3 | |
| Conservative | Juliet Brunner | 1,448 | 25.3 | +3.0 | |
| Liberal Democrats | Simon Oliver | 286 | 5.0 | +1.2 | |
| Green | Emma Bradley | 241 | 4.2 | +0.6 | |
| Independent | Isabel Armstrong | 133 | 2.3 | +2.3 | |
| Majority | 416 | 7.3 | |||
| Turnout | 5,726 | ||||
| UKIP hold | Swing | ||||
| Party | Candidate | Votes | % | ±% | |
|---|---|---|---|---|---|
| Conservative | Tony Muir | 763 | 28.7 | +9.2 | |
| Health Concern | Nicky Martin | 725 | 27.3 | +0.8 | |
| Labour | Jill Hawes | 581 | 21.9 | −0.7 | |
| UKIP | John Holden | 547 | 20.6 | −6.1 | |
| Green | Phil Oliver | 42 | 1.6 | −2.3 | |
| Majority | 38 | 1.4 | |||
| Turnout | 2,658 | ||||
| Conservative gain from Health Concern | Swing | ||||
| Party | Candidate | Votes | % | ±% | |
|---|---|---|---|---|---|
| Conservative | Robert Tomlinson | 956 | 63.2 | +15.2 | |
| Liberal Democrats | Peter Evans | 224 | 14.8 | +8.8 | |
| UKIP | Richard Keel | 212 | 14.0 | −19.2 | |
| Independent | Douglas Ingram | 120 | 7.9 | N/A | |
| Majority | 732 | 48.4 | |||
| Turnout | 1,518 | 18.00 | |||
| Conservative hold | Swing | ||||
| Party | Candidate | Votes | % | ±% | |
|---|---|---|---|---|---|
| Conservative | Kyle Daisley | 769 | 40.2 | −0.3 | |
| Independent | Rachel Jenkins | 436 | 22.8 | +22.8 | |
| Liberal Democrats | Joshua Robinson | 357 | 18.7 | +13.8 | |
| Labour | Bren Henderson | 351 | 18.3 | −32.2 | |
| Majority | 333 | 17.4 | |||
| Turnout | 1,913 | ||||
| Conservative gain from Labour | Swing | ||||
| Party | Candidate | Votes | % | ±% | |
|---|---|---|---|---|---|
| Labour | Andrew Fry | 1,342 | 53.7 | ||
| Conservative | Gemma Monaco | 893 | 35.7 | ||
| Green | Glen Theobald | 146 | 5.8 | ||
| Liberal Democrats | Mark Tomes | 120 | 4.8 | ||
| Majority | 449 | 18.0 | |||
| Turnout | 2,501 | 15.87 | |||
| Labour gain from Conservative | Swing | ||||
| Party | Candidate | Votes | % | ±% | |
|---|---|---|---|---|---|
| Green | Malcolm Victory | 740 | 25.4 | +25.4 | |
| Conservative | David Watkins | 737 | 25.3 | −6.3 | |
| Liberal Democrats | Pete Benkwitz | 684 | 23.5 | −13.9 | |
| Labour | Martin Willis | 388 | 13.3 | +5.0 | |
| MH Independents | Sarah Rouse | 364 | 12.5 | +12.5 | |
| Majority | 3 | 0.1 | |||
| Turnout | 2,913 | ||||
| Green gain from Liberal Democrats | Swing | ||||
| Party | Candidate | Votes | % | ±% | |
|---|---|---|---|---|---|
| Green | Andrew Cross | 1,139 | 44.1 | +28.6 | |
| Conservative | Lucy Hodgson | 623 | 24.1 | −37.0 | |
| Liberal Democrats | Sarah Murray | 579 | 22.4 | +16.2 | |
| Labour | Robyn Norfolk | 239 | 9.3 | −7.4 | |
| Majority | 516 | 20.0 | |||
| Turnout | 2,580 | ||||
| Green gain from Conservative | Swing | ||||
| Party | Candidate | Votes | % | ±% | |
|---|---|---|---|---|---|
| Conservative | Mark Goodge | 655 | 33.0 | −27.5 | |
| Labour | David Tasker | 453 | 22.8 | −1.4 | |
| Liberal Democrats | Oliver Walker | 245 | 12.3 | +3.5 | |
| Independent | John Campbell-Muir | 237 | 11.9 | +11.9 | |
| Green | Stephen Squires | 205 | 10.3 | +10.3 | |
| Independent | Peter Scurfield | 191 | 9.6 | +9.6 | |
| Majority | 202 | 10.2 | |||
| Turnout | 1,986 | ||||
| Conservative hold | Swing | ||||
| Party | Candidate | Votes | % | ±% | |
|---|---|---|---|---|---|
| Liberal Democrats | Sam Ammar | 1,416 | 51.9 | +20.3 | |
| Reform | Philip Hingley | 911 | 33.4 | −1.5 | |
| Conservative | Matt Dormer | 309 | 11.3 | −5.8 | |
| Labour | Laura Rollins | 92 | 3.4 | −4.1 | |
| Majority | 505 | 18.5 | |||
| Turnout | 2,728 | ||||
| Liberal Democrats gain from Reform | Swing | ||||
| Worcestershire CC | |
|---|---|
| Bromsgrove | |
| Malvern Hills | |
| Redditch | |
| Worcester | |
| Wychavon | |
| Wyre Forest | |
| Hereford & Worcester CC | |
| |
| Current | |
|---|---|
| Former | |
aUnitary authorities referred to as county councils | |