
Bromsgrove is a local government district in north-east Worcestershire, England. It is named after its only town, Bromsgrove, where its council is based, but also includes several villages and surrounding rural areas. It borders the built-up area of Birmingham to the north. Other places in the district include Alvechurch, Aston Fields, Belbroughton, Catshill, Clent, Hagley, Rubery, Stoke Prior and Wythall. The population at the 2021 census was 99,475.
The 1999 Bromsgrove District Council election took place on 6 May 1999 to elect members of Bromsgrove district council in Worcestershire, England. The whole council was up for election and the Conservative Party gained overall control of the council from the Labour Party.
Thanet District Council elections are held every four years to elect Thanet District Council in Kent, England. Since the last boundary changes in 2003 the council has comprised 56 councillors representing 23 wards.

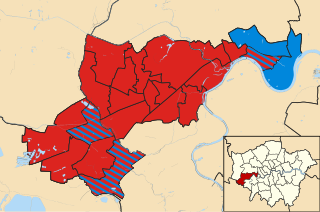
The 2010 Enfield Council election took place on 6 May 2010 to elect members of Enfield London Borough Council in London, England. The whole council was up for election and the Labour Party gained overall control of the council from the Conservative Party.

The 2014 Harlow District Council election took place on 22 May 2014 to elect members of Harlow District Council in Essex, England. One third of the council was up for election and the Labour Party stayed in overall control of the council.

The 2014 Brent London Borough Council election took place on 22 May 2014 to elect members of Brent London Borough Council in London, England. The whole council was up for election and the Labour Party stayed in overall control of the council.
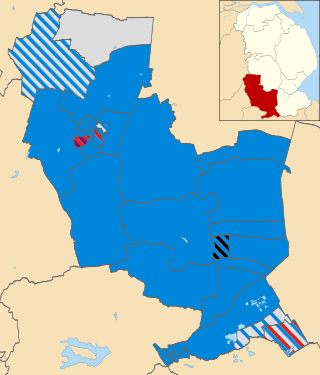
The 2015 South Kesteven District Council election took place on 7 May 2015 to elect members of South Kesteven District Council in Lincolnshire, England. The whole council was up for election after boundary changes reduced the number of seats by two. The Conservative party stayed in overall control of the council.

The 2015 Wychavon District Council election took place on 7 May 2015 to elect members of Wychavon District Council in Worcestershire, England. The whole council was up for election and the Conservative Party stayed in overall control of the council.

The 2015 Rother District Council election took place on 7 May 2015 to elect members of Rother District Council in East Sussex, England. The whole council was up for election and the Conservative Party stayed in overall control of the council.

Elections to Isle of Wight Council took place on 6 May 2021 as part of the 2021 United Kingdom local elections. These were held at the same time as the elections for the Hampshire Police and Crime Commissioner. The elections saw the Conservatives lose control of the council, losing seats against the national trend for the party.

The 2022 Barnet London Borough Council election took place on 5 May 2022, alongside local elections in the other London boroughs and elections to local authorities across the United Kingdom. All 63 members of Barnet London Borough Council were elected. The Labour Party took overall control, winning 41 of the seats to the Conservative Party's 22. This was the first time Labour had won the council outright; previously, the Conservatives had always won the most seats, usually with an overall majority.
The 2022 Hounslow London Borough Council election took place on 5 May 2022. All 62 members of Hounslow London Borough Council were elected. The elections took place alongside local elections in the other London boroughs and elections to local authorities across the United Kingdom.

The 2022 St Helens Metropolitan Borough Council election took place on 5 May 2022. Due to boundary changes, all 48 councillors were elected at the same time, with the council moving to a system of all-out elections every four years. The election took place alongside other local elections across the United Kingdom.

The 2022 Calderdale Metropolitan Borough Council election took place on 5 May 2022 to elect members of Calderdale Metropolitan Borough Council in England. One third of councillors — 17 out of 51, plus one vacancy in Ovenden ward were up for election. The election took place alongside other local elections across the United Kingdom.

Elections to Angus Council took place on 5 May 2022, the same day as the 31 other Scottish local government elections. As with other Scottish council elections, it was held using single transferable vote (STV) – a form of proportional representation – in which multiple candidates are elected in each ward and voters rank candidates in order of preference.

The 2023 United Kingdom local elections were held on Thursday, 4 May 2023 in England and on Thursday 18 May 2023 in Northern Ireland. These included district councils, unitary authorities, and directly elected mayors in England, and included all local councils in Northern Ireland. Notably, these elections were the first to be held under the Elections Act 2022, a new voter identification law that required voters to show photo ID when attending a polling station, and was a cause for controversy.

The 2023 Bournemouth, Christchurch and Poole Council election took place on 4 May, 2023, to elect all 76 members of Bournemouth, Christchurch and Poole Council in Dorset, England.

The 2023 Brighton and Hove City Council election took place on 4 May 2023 to elect members of Brighton and Hove City Council, England. This was at the same time as other local elections in England. Due to a boundary review, there was a change in ward boundaries, but the city council continued to comprise 54 members.

The 2023 Plymouth City Council election was held on 4 May 2023 to elect members of Plymouth City Council in England. It coincided with local elections across the United Kingdom.

The 2023 Bracknell Forest Borough Council election took place on 4 May 2023, to elect all 41 members in 15 wards for Bracknell Forest Borough Council in England. The election took place on the same day as other local elections in England as part of the 2023 United Kingdom local elections. Due to a boundary review there had been a change in ward boundaries, along with a reduction in size from 42 members elected in 2019. This is the first election since 1971 where a majority of seats are outside Bracknell. The election was held alongside concurrent town and parish council elections in Binfield, Bracknell, Crowthorne, Sandhurst, Warfield, and Winkfield.
