| |||||||||||||||||||||||||||||||||||||||||||||
20 out of 57 seats to Milton Keynes City Council 29 seats needed for a majority | |||||||||||||||||||||||||||||||||||||||||||||
---|---|---|---|---|---|---|---|---|---|---|---|---|---|---|---|---|---|---|---|---|---|---|---|---|---|---|---|---|---|---|---|---|---|---|---|---|---|---|---|---|---|---|---|---|---|
Turnout | 30.9% | ||||||||||||||||||||||||||||||||||||||||||||
| |||||||||||||||||||||||||||||||||||||||||||||
Winner of each seat at the 2023 Milton Keynes Council election | |||||||||||||||||||||||||||||||||||||||||||||
|
The 2023 Milton Keynes City Council election took place on 4 May 2023 to elect members of Milton Keynes City Council in the ceremonial county of Buckinghamshire, England. [1] This was on the same day as other local elections across England.
At the election, the council remained under no overall control, with the Labour Party (who topped the poll for the second consecutive year) making significant gains at the expense of the Conservatives. The Labour and Liberal Democrat coalition which had been running the council prior to the election continued to form the council's leadership. [2] [3]
2023 Milton Keynes City Council election | ||||||||||
---|---|---|---|---|---|---|---|---|---|---|
Party | This election | Full council | This election | |||||||
Seats | Net | Seats % | Other | Total | Total % | Votes | Votes % | +/− | ||
Labour | 12 | 5 | 60.0 | 10 | 25 | 43.9 | 24,224 | 38.2 | +1.7 | |
Conservative | 2 | 6 | 10.0 | 15 | 17 | 29.8 | 20,761 | 32.7 | –2.3 | |
Liberal Democrats | 6 | 1 | 30.0 | 9 | 15 | 26.3 | 13,735 | 21.6 | +0.4 | |
Green | 0 | 0 | 0.0 | 0 | 0 | 0.0 | 3,579 | 5.6 | +0.1 | |
Reform UK | 0 | 0 | 0.0 | 0 | 0 | 0.0 | 941 | 1.5 | New | |
Women's Equality | 0 | 0 | 0.0 | 0 | 0 | 0.0 | 128 | 0.2 | –0.1 | |
Heritage | 0 | 0 | 0.0 | 0 | 0 | 0.0 | 87 | 0.1 | New | |
The Statement of Persons Nominated, which details the candidates standing in each ward, was released by Milton Keynes City Council following the close of nominations on 5 April 2023. [4]
Party | Candidate | Votes | % | ±% | |
---|---|---|---|---|---|
Labour Co-op | Emily Darlington* | 1,602 | 56.8 | +4.8 | |
Conservative | James Marlow | 716 | 25.4 | –5.4 | |
Liberal Democrats | Sean McCabe | 191 | 6.8 | –2.1 | |
Green | Axel Segebecht | 157 | 5.6 | –2.7 | |
Reform UK | Jane Duckworth | 154 | 5.5 | N/A | |
Majority | 886 | 31.4 | |||
Turnout | 2,834 | 22.7 | –2.9 | ||
Registered electors | 12,471 | ||||
Labour Co-op hold | Swing | 5.1 | |||
Party | Candidate | Votes | % | ±% | |
---|---|---|---|---|---|
Labour Co-op | Waqas Ahmad | 1,427 | 41.5 | –4.0 | |
Conservative | Nabeel Nazir* | 1,360 | 39.5 | –4.1 | |
Green | Michael Shepperd | 282 | 8.2 | +3.1 | |
Liberal Democrats | Timothy Gomm | 229 | 6.7 | +1.0 | |
Reform UK | Mark Rossouw | 141 | 4.1 | N/A | |
Majority | 67 | 2.0 | |||
Turnout | 3,448 | 31.2 | –3.3 | ||
Registered electors | 11,074 | ||||
Labour Co-op gain from Conservative | Swing | 0.1 | |||
Party | Candidate | Votes | % | ±% | |
---|---|---|---|---|---|
Labour Co-op | Lauren Townsend* | 1,412 | 44.0 | –5.1 | |
Conservative | Ade Adeliyi | 1,206 | 37.6 | –0.4 | |
Liberal Democrats | Benjamin Edwards | 217 | 6.8 | +2.3 | |
Green | Joe French | 198 | 6.2 | +2.4 | |
Reform UK | Ray Brady | 177 | 5.5 | N/A | |
Majority | 206 | 6.4 | |||
Turnout | 3,219 | 31.4 | –4.4 | ||
Registered electors | 10,261 | ||||
Labour Co-op hold | Swing | 2.4 | |||
Party | Candidate | Votes | % | ±% | |
---|---|---|---|---|---|
Liberal Democrats | Robin Bradburn* | 1,652 | 57.3 | –0.4 | |
Labour | Hilary Saunders | 755 | 26.2 | +1.4 | |
Conservative | Krishna Panthula | 476 | 16.5 | –1.0 | |
Majority | 897 | 31.1 | |||
Turnout | 2,901 | 30.7 | –1.6 | ||
Registered electors | 9,450 | ||||
Liberal Democrats hold | Swing | 0.9 | |||
Party | Candidate | Votes | % | ±% | |
---|---|---|---|---|---|
Liberal Democrats | Kerrie Bradburn* | 2,093 | 58.8 | +7.7 | |
Conservative | Dev Ahuja | 818 | 23.0 | –9.9 | |
Labour | Ayesha Khanom | 561 | 15.8 | –0.2 | |
Heritage | Alfred Saint-Clair | 87 | 2.4 | N/A | |
Majority | 1,275 | 35.8 | |||
Turnout | 3,568 | 27.1 | –3.2 | ||
Registered electors | 13,162 | ||||
Liberal Democrats hold | Swing | 8.8 | |||
Party | Candidate | Votes | % | ±% | |
---|---|---|---|---|---|
Liberal Democrats | Paul Trendall* | 1,695 | 48.0 | +3.3 | |
Conservative | John Hearnshaw | 1,031 | 29.2 | –7.4 | |
Labour | David Baume | 615 | 17.4 | –1.3 | |
Green | Carol Barac | 193 | 5.5 | N/A | |
Majority | 664 | 18.8 | |||
Turnout | 3,548 | 35.9 | –3.1 | ||
Registered electors | 9,879 | ||||
Liberal Democrats hold | Swing | 5.4 | |||
Party | Candidate | Votes | % | ±% | |
---|---|---|---|---|---|
Labour | Darron Kendrick | 1,201 | 51.1 | –3.1 | |
Labour | Martin Petchey | 1,080 | 46.0 | –8.2 | |
Conservative | Toby Poyner | 589 | 25.1 | –0.5 | |
Conservative | Cindy Taylor | 562 | 23.9 | –1.7 | |
Liberal Democrats | Duncan Banks | 349 | 14.9 | –5.3 | |
Liberal Democrats | Russell Houchin | 323 | 13.8 | –6.4 | |
Green | Simon Green | 254 | 10.8 | N/A | |
Turnout | 2,349 | 22.6 | –2.5 | ||
Registered electors | 10,395 | ||||
Labour hold | |||||
Labour hold | |||||
Party | Candidate | Votes | % | ±% | |
---|---|---|---|---|---|
Labour | Tracey Bailey | 1,617 | 41.1 | +15.1 | |
Conservative | Marlese Levermore | 1,452 | 36.9 | –13.0 | |
Green | Peter Skelton | 409 | 10.4 | –2.4 | |
Liberal Democrats | Rebecca Cave | 279 | 7.1 | –4.2 | |
Reform UK | Chris Northcott | 174 | 4.4 | N/A | |
Majority | 165 | 4.2 | |||
Turnout | 3,940 | 33.6 | +0.1 | ||
Registered electors | 11,725 | ||||
Labour gain from Conservative | Swing | 14.1 | |||
Party | Candidate | Votes | % | ±% | |
---|---|---|---|---|---|
Labour | Brigid McBride | 1,652 | 48.5 | –3.4 | |
Conservative | Rajeev Sharma | 1,315 | 38.6 | +0.8 | |
Liberal Democrats | Garrath Green | 264 | 7.7 | +2.1 | |
Green | Vanessa Skelton | 178 | 5.2 | +0.5 | |
Majority | 337 | 9.9 | |||
Turnout | 3,430 | 34.6 | –7.0 | ||
Registered electors | 9,908 | ||||
Labour gain from Conservative | Swing | 2.1 | |||
Party | Candidate | Votes | % | ±% | |
---|---|---|---|---|---|
Liberal Democrats | Ben Adewale | 1,270 | 51.6 | –6.4 | |
Conservative | Jaime Tamagnini | 546 | 22.2 | –0.2 | |
Labour | Monica Dowling | 471 | 19.1 | –0.5 | |
Green | Ammar Noorwali | 174 | 7.1 | N/A | |
Majority | 724 | 29.4 | |||
Turnout | 2,474 | 26.9 | –2.3 | ||
Registered electors | 9,183 | ||||
Liberal Democrats hold | Swing | 3.1 | |||
Party | Candidate | Votes | % | ±% | |
---|---|---|---|---|---|
Conservative | Alison Andrew | 1,628 | 44.5 | –2.3 | |
Liberal Democrats | Scott Humphries | 1,162 | 31.8 | +13.3 | |
Labour | Carol Wood | 737 | 20.2 | –1.5 | |
Women's Equality | Jane Whild | 128 | 3.5 | –2.6 | |
Majority | 466 | 12.7 | |||
Turnout | 3,673 | 37.1 | +0.9 | ||
Registered electors | 9,898 | ||||
Conservative hold | Swing | 7.8 | |||
Party | Candidate | Votes | % | ±% | |
---|---|---|---|---|---|
Liberal Democrats | Jane Carr* | 1,475 | 46.1 | –4.4 | |
Conservative | James Darling | 1,098 | 34.3 | +1.0 | |
Labour | Veronica Belcher | 510 | 15.9 | –0.3 | |
Reform UK | Lynn Cocksedge | 120 | 3.7 | N/A | |
Majority | 377 | 11.8 | |||
Turnout | 3,216 | 36.3 | +0.5 | ||
Registered electors | 8,853 | ||||
Liberal Democrats hold | Swing | 2.7 | |||
Party | Candidate | Votes | % | ±% | |
---|---|---|---|---|---|
Labour | Debbie Whitworth | 1,903 | 44.8 | +26.2 | |
Conservative | David Hosking | 1,857 | 43.8 | +3.5 | |
Green | Dominic Taylor | 236 | 5.6 | –15.5 | |
Liberal Democrats | Dominic Dyer | 131 | 3.1 | N/A | |
Reform UK | Nigel Birrell | 117 | 2.8 | N/A | |
Majority | 46 | 1.0 | |||
Turnout | 4,252 | 43.5 | +1.7 | ||
Registered electors | 9,776 | ||||
Labour gain from Conservative | Swing | 11.4 | |||
Party | Candidate | Votes | % | ±% | |
---|---|---|---|---|---|
Liberal Democrats | Sophie Bell | 1,184 | 38.7 | –7.6 | |
Conservative | Saleea Raja* | 1,180 | 38.6 | +3.9 | |
Labour | Christian Durugo | 529 | 17.3 | –1.7 | |
Green | Daniel Barthaud | 164 | 5.4 | N/A | |
Majority | 4 | 0.1 | |||
Turnout | 3,068 | 32.4 | –1.5 | ||
Registered electors | 9,467 | ||||
Liberal Democrats gain from Conservative | Swing | 5.8 | |||
Party | Candidate | Votes | % | ±% | |
---|---|---|---|---|---|
Labour | Stephen Brown | 1,756 | 50.3 | +4.1 | |
Conservative | Greg Pius | 1,117 | 32.0 | -6.2 | |
Green | Gary Lloyd | 312 | 8.9 | +0.5 | |
Liberal Democrats | Greg Duffield | 283 | 8.1 | +0.9 | |
Majority | 639 | 18.3 | |||
Turnout | 3,489 | 31.5 | –4.4 | ||
Registered electors | 11,073 | ||||
Labour gain from Conservative | Swing | 5.2 | |||
Party | Candidate | Votes | % | ±% | |
---|---|---|---|---|---|
Labour | Akash Nayee | 1,872 | 46.2 | –6.6 | |
Conservative | Godwin Michael | 1,490 | 36.8 | +1.9 | |
Liberal Democrats | Richard Greenwood | 406 | 10.0 | +3.4 | |
Green | Joan Hughes | 281 | 6.9 | +1.2 | |
Majority | 382 | 9.4 | |||
Turnout | 4,069 | 34.1 | –3.7 | ||
Registered electors | 11,919 | ||||
Labour hold | Swing | 4.3 | |||
Party | Candidate | Votes | % | ±% | |
---|---|---|---|---|---|
Conservative | James Lancaster* | 1,329 | 45.7 | +2.0 | |
Labour Co-op | Rukhsana Malik | 1,183 | 40.6 | +3.6 | |
Green | Lucy Bjorck | 204 | 7.0 | –3.0 | |
Liberal Democrats | Steven Walden | 137 | 4.7 | –4.6 | |
Reform UK | Dan Matthews | 58 | 2.0 | N/A | |
Majority | 146 | 5.1 | |||
Turnout | 2,923 | 33.2 | +2.0 | ||
Registered electors | 8,816 | ||||
Conservative hold | Swing | 0.8 | |||
Party | Candidate | Votes | % | ±% | |
---|---|---|---|---|---|
Labour Co-op | Peter Marland* | 1,959 | 62.2 | +2.5 | |
Conservative | Edith Bald | 610 | 19.4 | –3.3 | |
Green | Alan Francis | 370 | 11.8 | –0.6 | |
Liberal Democrats | Tony Oyakhire | 209 | 6.6 | +1.4 | |
Majority | 1,349 | 42.8 | |||
Turnout | 3,167 | 29.3 | –2.5 | ||
Registered electors | 10,823 | ||||
Labour Co-op hold | Swing | 2.9 | |||
Party | Candidate | Votes | % | ±% | |
---|---|---|---|---|---|
Labour | Sue Smith | 1,382 | 65.3 | –4.6 | |
Conservative | Tatiana Vassilakis | 381 | 18.0 | –2.2 | |
Liberal Democrats | Caroline Picking | 186 | 8.8 | –1.1 | |
Green | Tony Coughlan | 167 | 7.9 | N/A | |
Majority | 1,001 | 47.3 | |||
Turnout | 2,126 | 18.5 | –2.8 | ||
Registered electors | 11,493 | ||||
Labour hold | Swing | 1.2 | |||
Party | Candidate | Votes | % | ±% | |
---|---|---|---|---|---|
Liberal Democrats | Tony Oyakhire | 1,088 | 43.5 | +5.4 | |
Labour | Saskia Soden | 684 | 27.4 | +13.5 | |
Conservative | Ade Adeliyi | 561 | 22.4 | -19.8 | |
Green | Gary Lloyd | 80 | 3.2 | -2.5 | |
Independent | Lynn Cocksedge | 53 | 2.1 | N/A | |
Women's Equality | Jane Whild | 34 | 1.4 | N/A | |
Majority | 404 | 16.1 | +12.0 | ||
Turnout | 2,500 | 28.3 | -10.9 | ||
Registered electors | 8,851 | ||||
Liberal Democrats gain from Conservative | Swing | 12.6 | |||
Party | Candidate | Votes | % | ±% | |
---|---|---|---|---|---|
Labour | Leo Montague | 1,136 | 46.0 | -2.5 | |
Conservative | Rajeev Sharma | 971 | 39.4 | +0.8 | |
Liberal Democrats | Garrath Green | 179 | 7.3 | -0.4 | |
Green | Tim Lee | 113 | 4.6 | -0.6 | |
Independent | Ray Brady | 61 | 2.5 | N/A | |
Majority | 165 | 6.6 | -3.3 | ||
Turnout | 2,467 | 25.1 | -9.5 | ||
Registered electors | 9,846 | ||||
Labour hold | Swing | 1.7 | |||
East of England was a constituency of the European Parliament that was coterminous with the East of England region. It returned 7 MEPs using the D'Hondt method of party-list proportional representation, until the UK exit from the European Union on 31 January 2020.
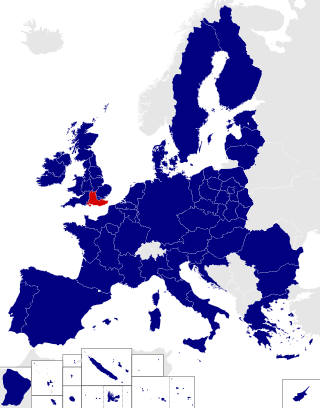
South East England was a constituency of the European Parliament. It elected 10 Members of the European Parliament (MEPs) using the D'Hondt method of party-list proportional representation until the UK exit from the European Union on 31 January 2020.
Milton Keynes North is a constituency represented in the House of Commons of the UK Parliament since the 2019 United Kingdom general election by Ben Everitt, a Conservative. At that election, it was one of two constituencies covering the City of Milton Keynes unitary authority area.
Milton Keynes South was a constituency represented in the House of Commons of the UK Parliament from its 2010 creation until 2024 by Iain Stewart, a Conservative.
Milton Keynes City Council is the local authority of the City of Milton Keynes in Buckinghamshire, England. It is a unitary authority, having the powers of a non-metropolitan county and district council combined. It has both borough status and city status. The borough, which extend beyond the ONS-defined Milton Keynes urban area and encompasses a substantial rural component, is divided into 19 wards, electing 57 councillors.
Milton Keynes City Council is the local authority for the City of Milton Keynes, a unitary authority in Buckinghamshire, England. Until 1 April 1997 it was a non-metropolitan district.
The 2000 Milton Keynes Council election took place on 4 May 2000 to elect members of Milton Keynes Council in Buckinghamshire, England. One third of the council was up for election and the council stayed under no overall control.
An election to Cambridgeshire County Council took place on 2 May 2013 as part of the 2013 United Kingdom local elections. 69 councillors were elected from 60 electoral divisions, which returned either one or two county councillors each by first-past-the-post voting for a four-year term of office. The electoral divisions were the same as those used at the previous election in 2009. No elections were held in Peterborough, which is a unitary authority outside the area covered by the County Council. The election saw the Conservative Party lose overall control of the council.
The 2017 Cambridgeshire County Council election was held on 4 May 2017 as part of the 2017 local elections in the United Kingdom. All 61 councillors were elected from 59 electoral divisions, which returned either one or two county councillors each by first-past-the-post voting for a four-year term of office.
The 2019 Leicester City Council election took place on 2 May 2019 to elect all fifty-four members of the Leicester City Council in England. This was on the same day as other local elections, and the election for the directly elected Mayor of Leicester.
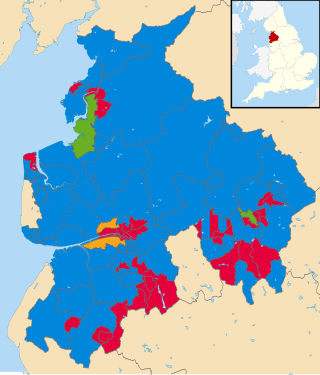
An election to Lancashire County Council took place on 6 May 2021, with counting on 8 May, as part of the 2021 United Kingdom local elections. All 84 councillors are elected from electoral divisions for a four-year term of office. The system of voting used is first-past-the-post. Elections are held in all electoral divisions across the present ceremonial county, excepting Blackpool and Blackburn with Darwen which are unitary authorities.
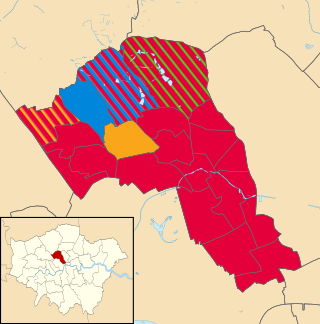
The 2022 Camden London Borough Council election took place on 5 May 2022. All 55 members of Camden London Borough Council were elected. The elections took place alongside local elections in the other London boroughs and elections to local authorities across the United Kingdom.
The 2022 Bury Metropolitan Borough Council election took place on 5 May 2022. Due to boundary changes, all 51 councillors were elected at the same time. The election took place alongside other local elections across the United Kingdom.
The 2022 Coventry City Council election took place on 5 May 2022. One third of councillors — 18 out of 54 — on Coventry City Council were elected. The election took place alongside other local elections across the United Kingdom.
The 2022 Salford City Council election took place on 5 May 2022 along with other local elections across the United Kingdom. One third—20 out of 60—of councillor seats on Salford City Council were up for election.
The 2022 Hastings Borough Council election took place on 5 May 2022 to elect members of Hastings Borough Council in the county of East Sussex, England. This was on the same day as other local elections. 16 of the 32 seats were up for election.
The 2022 Crawley Borough Council took place on 5 May 2022 to elect members of Crawley Borough Council. This is on the same day as other local elections. 12 of the 36 seats were up for election.
The 2023 Colchester City Council election took place on 4 May 2023 to elect members of Colchester City Council in Essex, England. This was on the same day as other local elections across England. There were 17 of the 51 seats on the council up for election, being the usual third of the council, with one seat available for each ward. This set of seats were last contested at the 2019 election.
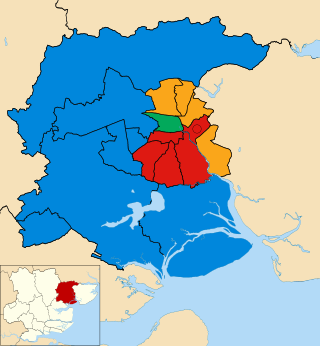
The 2024 Colchester City Council election took place on 2 May 2024 alongside other local elections across England. Eighteen members of the council were elected, one from each of the wards, with an additonal by-election in Greenstead ward.
The 2024 Milton Keynes City Council elections were held on Thursday 2 May 2024, alongside the other local elections in the United Kingdom that were held on the same day. One-third of the 57 members of Milton Keynes City Council in Buckinghamshire were up for election.