Results maps
 2003 results map
 2007 results map
 2011 results map
 2015 results map
Wycombe District Council in Buckinghamshire, England was elected every four years from 1973 until 2020. [1] From the last boundary changes in 2003 until its abolition in 2020, 60 councillors were elected from 28 wards.
From the first election to the council in 1973 until its merger into Buckinghamshire Council in 2020, political control of the council was held by the following parties: [2] [3]
| Party in control | Years | |
|---|---|---|
| Conservative | 1973–1995 | |
| No overall control | 1995–1999 | |
| Conservative | 1999–2020 | |
The leaders of the council from 1999 until its abolition in 2020 were:
| Councillor | Party | From | To | |
|---|---|---|---|---|
| Pam Priestley [4] | Conservative | 1999 | May 2001 | |
| Roger Colomb [5] [6] | Conservative | 14 May 2001 | 19 May 2003 | |
| Lesley Clarke [7] [8] | Conservative | 19 May 2003 | May 2011 | |
| Alex Collingwood [9] [10] | Conservative | 24 May 2011 | 13 May 2013 | |
| Richard Scott [11] [12] | Conservative | 13 May 2013 | May 2015 | |
| Katrina Wood [13] [14] | Conservative | 26 May 2015 | 31 Mar 2020 | |
| Year | Conservative | Labour | Liberal Democrats | UKIP | East Wycombe Independents | Independent | Council control after election | |
|---|---|---|---|---|---|---|---|---|
| 2003 | 46 | 9 | 2 | 0 | 0 | 3 | Conservative | |
| 2007 | 49 | 5 | 4 | 0 | 0 | 2 | Conservative | |
| 2011 | 42 | 7 | 8 | 1 | 0 | 2 | Conservative | |
| 2015 | 47 | 6 | 1 | 1 | 3 | 2 | Conservative | |


| Party | Candidate | Votes | % | ±% | |
|---|---|---|---|---|---|
| Labour | Ann Bennett | 689 | 49.36 | ||
| Liberal Democrats | Ian Morton | 417 | 29.87 | ||
| Conservative | Sue Heath | 290 | 20.77 | ||
| Majority | 272 | 19.49 | |||
| Turnout | 1396 | 25 | |||
| Labour hold | Swing | ||||
| Party | Candidate | Votes | % | ±% | |
|---|---|---|---|---|---|
| Labour | Kathleen Draper [20] | 375 | 48.6 | −12.5 | |
| Conservative | 319 | 43.3 | +29.8 | ||
| Liberal Democrats | 77 | 10.0 | −15.4 | ||
| Majority | 56 | 5.3 | |||
| Turnout | 771 | ||||
| Labour hold | Swing | ||||
| Party | Candidate | Votes | % | ±% | |
|---|---|---|---|---|---|
| Liberal Democrats | 408 | 46.2 | +9.7 | ||
| Conservative | 390 | 44.1 | +11.7 | ||
| Labour | 86 | 9.7 | −21.4 | ||
| Majority | 18 | 2.1 | |||
| Turnout | 884 | ||||
| Liberal Democrats hold | Swing | ||||
| Party | Candidate | Votes | % | ±% | |
|---|---|---|---|---|---|
| Conservative | 434 | 55.9 | −0.7 | ||
| Independent | 342 | 44.1 | +0.7 | ||
| Majority | 92 | 11.8 | |||
| Turnout | 776 | ||||
| Conservative hold | Swing | ||||
| Party | Candidate | Votes | % | ±% | |
|---|---|---|---|---|---|
| Conservative | Roger Emmett [22] | 326 | 49.9 | −20.5 | |
| Independent | 200 | 30.6 | +30.6 | ||
| Labour | 127 | 19.4 | −10.2 | ||
| Majority | 126 | 19.3 | |||
| Turnout | 653 | 34.0 | |||
| Conservative hold | Swing | ||||
| Party | Candidate | Votes | % | ±% | |
|---|---|---|---|---|---|
| Conservative | Bob Bate | 542 | 78.0 | +11.7 | |
| Labour | Trevor Snaith | 153 | 22.0 | −11.7 | |
| Majority | 389 | 56.0 | |||
| Turnout | 695 | 29.1 | |||
| Conservative hold | Swing | ||||
| Party | Candidate | Votes | % | ±% | |
|---|---|---|---|---|---|
| Conservative | David Bainton | 2,172 | 54.1 | +5.4 | |
| Liberal Democrats | Ian Forbes | 1,092 | 27.2 | +5.6 | |
| Labour | Ian Bates | 748 | 18.6 | +7.9 | |
| Majority | 1,080 | 26.9 | |||
| Turnout | 4,012 | 62.8 | |||
| Conservative hold | Swing | ||||
| Party | Candidate | Votes | % | ±% | |
|---|---|---|---|---|---|
| Conservative | Simon Bazley | 404 | 74.5 | +39.0 | |
| Independent | Jonathan Ashman | 138 | 25.5 | −18.5 | |
| Majority | 266 | 49.0 | |||
| Turnout | 542 | ||||
| Conservative gain from Independent | Swing | ||||
| Party | Candidate | Votes | % | ±% | |
|---|---|---|---|---|---|
| Conservative | Ian McEnnis | 357 | 47.4 | +8.2 | |
| Liberal Democrats | Neil Timberlake | 316 | 42.0 | +10.9 | |
| Labour | Ian Bates | 80 | 10.6 | +10.6 | |
| Majority | 41 | 5.4 | |||
| Turnout | 753 | 18.8 | |||
| Conservative hold | Swing | ||||
| Party | Candidate | Votes | % | ±% | |
|---|---|---|---|---|---|
| Conservative | Helen Wilkinson-Makey | 491 | 56.4 | +14.8 | |
| Liberal Democrats | Ivor Coleman | 244 | 28.0 | +28.0 | |
| Labour | Janet Pritchard | 135 | 15.5 | +15.5 | |
| Majority | 247 | 28.4 | |||
| Turnout | 870 | 22.4 | |||
| Conservative gain from Independent | Swing | ||||
| Party | Candidate | Votes | % | ±% | |
|---|---|---|---|---|---|
| Conservative | Katrina Wood | 888 | 65.8 | +17.1 | |
| Liberal Democrats | Ian Forbes | 387 | 28.7 | +7.1 | |
| Labour | Sadia Hussain | 75 | 5.6 | −5.1 | |
| Majority | 501 | 37.1 | |||
| Turnout | 1,350 | 21.6 | |||
| Conservative hold | Swing | ||||
| Party | Candidate | Votes | % | ±% | |
|---|---|---|---|---|---|
| Conservative | Larry Haig | 1,040 | 65.4 | +9.7 | |
| Liberal Democrats | William Barnes | 549 | 34.6 | +4.7 | |
| Majority | 491 | 30.8 | |||
| Turnout | 1,589 | 24.3 | |||
| Conservative hold | Swing | ||||
| Party | Candidate | Votes | % | ±% | |
|---|---|---|---|---|---|
| Conservative | Richard Scott | 928 | 61.1 | +3.6 | |
| Liberal Democrats | Carol Cummins | 382 | 25.1 | −8.4 | |
| Labour | Paul Mansell | 209 | 13.8 | +4.9 | |
| Majority | 546 | 36.0 | |||
| Turnout | 1,519 | 22.6 | |||
| Conservative hold | Swing | ||||
| Party | Candidate | Votes | % | ±% | |
|---|---|---|---|---|---|
| Liberal Democrats | Steve Guy | 733 | 54.1 | +36.5 | |
| Conservative | Tim Hewish | 408 | 30.1 | −10.9 | |
| Labour | Ian Bates | 214 | 15.8 | −25.6 | |
| Majority | 325 | 24.0 | |||
| Turnout | 1,355 | 31.0 | |||
| Liberal Democrats gain from Labour | Swing | ||||
| Party | Candidate | Votes | % | ±% | |
|---|---|---|---|---|---|
| Liberal Democrats | Jen Joseph | 1,234 | 44.5 | +26.9 | |
| Conservative | Lakshan Wanigasooriya | 1,017 | 36.6 | −4.4 | |
| Labour | Ian Bates | 524 | 18.9 | −22.5 | |
| Majority | 217 | 7.8 | |||
| Turnout | 2,775 | ||||
| Liberal Democrats gain from Conservative | Swing | ||||
| Party | Candidate | Votes | % | ±% | |
|---|---|---|---|---|---|
| Conservative | Dominic Barnes | 609 | 52.9 | +17.1 | |
| Independent | Mike Harris | 348 | 30.2 | +30.2 | |
| Liberal Democrats | Kavita Mohan | 195 | 16.9 | +0.0 | |
| Majority | 261 | 22.7 | |||
| Turnout | 1,152 | ||||
| Conservative hold | Swing | ||||
| Party | Candidate | Votes | % | ±% | |
|---|---|---|---|---|---|
| Liberal Democrats | Alex Slater | 412 | 37.7 | +19.0 | |
| UKIP | Brian Mapletoft | 365 | 33.4 | +33.4 | |
| Conservative | Lawrence Wood | 228 | 20.9 | −33.8 | |
| Labour | Alan De'Ath | 88 | 8.1 | +8.1 | |
| Majority | 47 | 4.3 | |||
| Turnout | 1,093 | ||||
| Liberal Democrats gain from Conservative | Swing | ||||
| Party | Candidate | Votes | % | ±% | |
|---|---|---|---|---|---|
| Conservative | Maz Hussain | 553 | 40.0 | +3.3 | |
| Labour | Mohammed Rafiq | 466 | 33.7 | −9.9 | |
| UKIP | Vijay Singh Srao | 234 | 16.9 | +16.9 | |
| Liberal Democrats | Andrew Stevens | 129 | 9.3 | −10.4 | |
| Majority | 87 | 6.3 | |||
| Turnout | 1,382 | ||||
| Conservative gain from Labour | Swing | ||||
| Party | Candidate | Votes | % | ±% | |
|---|---|---|---|---|---|
| Conservative | Roger Metcalfe | 379 | 70.3 | −9.8 | |
| UKIP | Brian Mapletoft | 97 | 18.0 | +18.0 | |
| Labour | Julian Grigg | 63 | 11.7 | +11.7 | |
| Majority | 282 | 52.3 | |||
| Turnout | 539 | ||||
| Conservative hold | Swing | ||||
Wycombe (former district) | ||
|---|---|---|
| Towns (component areas and hamlets) | 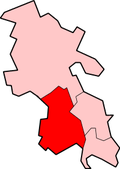 | |
| Other civil parishes (component villages and hamlets) |
| |
| Former districts and boroughs | ||
| Former constituencies | ||