| |||||||||||||||||||||||||
| |||||||||||||||||||||||||
All 75 seats on Wigan Metropolitan Borough Council 38 seats needed for a majority | |||||||||||||||||||||||||
---|---|---|---|---|---|---|---|---|---|---|---|---|---|---|---|---|---|---|---|---|---|---|---|---|---|
| |||||||||||||||||||||||||
Winner of each seat at the 2023 Wigan Metropolitan Borough Council election | |||||||||||||||||||||||||
|
The 2023 Wigan Metropolitan Borough Council elections took place on 4 May 2023 alongside other local elections in the United Kingdom. Due to boundary changes all 75 seats on Wigan Metropolitan Borough Council were contested. [2]
Labour retained its majority on the council. [3]
The Local Government Act 1972 created a two-tier system of metropolitan counties and districts covering Greater Manchester, Merseyside, South Yorkshire, Tyne and Wear, the West Midlands, and West Yorkshire starting in 1974. Manchester was a district of the Greater Manchester metropolitan county. [4] The Local Government Act 1985 abolished the metropolitan counties, with metropolitan districts taking on most of their powers as metropolitan boroughs. The Greater Manchester Combined Authority was created in 2011 and began electing the mayor of Greater Manchester from 2017, which was given strategic powers covering a region coterminous with the former Greater Manchester metropolitan county. [5]
Since its creation in 1974, the council has continuously been under the control of the Labour Party.
In December 2022 the Local Government Boundary Commission for England made The Wigan (Electoral Changes) Order 2022, which officially abolished the existing 25 wards and created 25 new wards with different boundaries. Because of this change, all 75 seats on the council, three per ward, are to be contested. [6]
The election took place using the plurality block voting system, a form of first-past-the-post voting, with each ward being represented by three councillors. The candidate with the most votes in each ward will serve a four year term ending in 2027, the second-placed candidate will serve a three year term anding in 2026 and the third-placed candidate will serve a one year term ending in 2024. [6]
All registered electors (British, Irish, Commonwealth and European Union citizens) living in Wigan aged 18 or over were entitled to vote in the election. People who lived at two addresses in different councils, such as university students with different term-time and holiday addresses, were entitled to be registered for and vote in elections in both local authorities. Voting in-person at polling stations took place from 07:00 to 22:00 on election day. Residents had until Monday 17 April to register to vote, [7] and voters were able to apply for postal votes or proxy votes until 18 April and 25 April, respectively. [8]
As a result of the Elections Act 2022 electors were required to present photographic identification to polling staff in order to cast their vote. [9]
After 2022 election | Before 2023 election | After 2023 election [10] | ||||||
---|---|---|---|---|---|---|---|---|
Party | Seats | Party | Seats | Party | Seats | |||
Labour | 61 | Labour | 61 | Labour | 64 | |||
Conservative | 7 | Conservative | 7 | Conservative | 2 | |||
Independent | 7 | Independent | 7 | Independent | 9 |
Party | Number of Candidates |
---|---|
Labour Party | 75 |
Conservative Party | 38 |
Independents | 25 |
Liberal Democrats | 18 |
Leigh and Atherton Independents | 10 |
Reform UK | 3 |
UKIP | 2 |
Green Party | 1 |
Heritage Party | 1 |
Standish Independents | 1 |
TUSC | 1 |
Wigan Independents | 1 |
Party | Seats | Gains | Losses | Net gain/loss | Seats % | Votes % | Votes | +/− | |
---|---|---|---|---|---|---|---|---|---|
Labour | 64 | 6 | 3 | 3 | 85.3 | 60.9 | 96,342 | 7.9 | |
Conservative | 2 | 0 | 5 | 5 | 2.7 | 17.3 | 27,282 | 9.0 | |
Independent | 9 | 3 | 1 | 2 | 12.0 | 12.7 | 20,120 | 1.9 | |
Liberal Democrats | 0 | 0 | 0 | 0 | 4.2 | 6,567 | 1.2 | ||
Leigh and Atherton Independents | 0 | 0 | 0 | 0 | 2.2 | 3,514 | 0.3 | ||
Wigan Independents | 0 | 0 | 0 | 0 | 0.7 | 1,102 | 0.5 | ||
Reform UK | 0 | 0 | 0 | 0 | 0.6 | 963 | New | ||
Standish Independents | 0 | 0 | 0 | 0 | 0.5 | 795 | 0.5 | ||
UKIP | 0 | 0 | 0 | 0 | 0.4 | 633 | 0.1 | ||
Green | 0 | 0 | 0 | 0 | 0.3 | 416 | New | ||
Heritage | 0 | 0 | 0 | 0 | 0.2 | 269 | New | ||
TUSC | 0 | 0 | 0 | 0 | 0.1 | 150 | New | ||
Vote share % changes are with respect to the 2022 election results.
Incumbent councillors seeking re-election in their ward are marked with an asterisk (*). Turnout percentage changes are all relative to the 2022 turnouts for the respective wards.
Party | Candidate | Votes | % | ±% | |
---|---|---|---|---|---|
Labour | Martyn Smethurst* | 1,291 | 58.8 | ||
Labour | Eunice Smethurst* | 1,253 | 57.1 | ||
Labour | Nazia Rehman | 1,079 | 49.1 | ||
Independent | David Bowker | 646 | 29.4 | ||
Conservative | Janet Walch | 378 | 17.2 | ||
Liberal Democrats | Graham Suddick | 361 | 16.4 | ||
Turnout | 2,196 | 21.1 | 1.5 | ||
Labour hold | Swing | ||||
Party | Candidate | Votes | % | ±% | |
---|---|---|---|---|---|
Labour | Danny Fletcher* | 1,530 | 64.7 | ||
Labour | Jenny Bullen* | 1,033 | 43.7 | ||
Labour | Andrew Bullen* | 989 | 41.9 | ||
Independent | Gary Wilkes | 733 | 31.0 | ||
Independent | Joanne Bradley | 502 | 21.2 | ||
Independent | Stephen Hanway | 476 | 20.1 | ||
Conservative | Paul Martin | 403 | 17.1 | ||
Liberal Democrats | Geoffrey Stephen Matthews | 149 | 6.3 | ||
Turnout | 2,363 | 26.9 | 0.2 | ||
Labour hold | Swing | ||||
Party | Candidate | Votes | % | ±% | |
---|---|---|---|---|---|
Labour | Chris Ready* | 1,836 | 70.5 | ||
Labour | Ron Conway* | 1,835 | 70.5 | ||
Labour | Laura Jean Flynn* | 1,624 | 62.4 | ||
Conservative | Gerard Joseph Houlton | 556 | 21.4 | ||
UKIP | Carl Davies | 406 | 15.6 | ||
Turnout | 2,603 | 27.9 | 0.7 | ||
Labour hold | Swing | ||||
Party | Candidate | Votes | % | ±% | |
---|---|---|---|---|---|
Labour | Christine Lilian Roberts* | 1,816 | 57.4 | ||
Labour | Paula Anne Wakefield* | 1,743 | 55.1 | ||
Labour | Barry John Taylor* | 1,617 | 51.1 | ||
Conservative | Trevor Halliwell Barton | 1,058 | 33.4 | ||
Conservative | Eileen Patricia Strathearn | 949 | 30.0 | ||
Conservative | David John Stirzaker | 817 | 25.8 | ||
Heritage | Sandra Elizabeth Robinson | 269 | 8.5 | ||
Liberal Democrats | Sean Andrew Roocroft | 253 | 8.0 | ||
Turnout | 3,164 | 29.5 | 2.8 | ||
Labour hold | Swing | ||||
Party | Candidate | Votes | % | ±% | |
---|---|---|---|---|---|
Independent | Stuart Andrew Gerrard* | 1,481 | 54.8 | ||
Independent | Jamie Hodgkinson* | 1,420 | 52.5 | ||
Independent | James Paul Watson* | 1,119 | 41.4 | ||
Labour | Julie Ann Hilling | 899 | 33.3 | ||
Labour | Paul James Blinkhorn | 854 | 31.6 | ||
Labour | Matthew Lewis Brown | 698 | 25.8 | ||
Atherton North Independent | Quinton John Smith | 349 | 12.9 | ||
Conservative | Keith Barton | 186 | 6.9 | ||
Atherton North Independent | Rick Carter | 145 | 5.4 | ||
Independent | Martin James Farrimond | 81 | 3.0 | ||
Turnout | 2,703 | 26.6 | 0.3 | ||
Independent hold | Swing | ||||
Party | Candidate | Votes | % | ±% | |
---|---|---|---|---|---|
Labour | John Arthur Harding* | 1,383 | 50.1 | ||
Labour | Debra Susan Ann Wailes* | 1,362 | 49.3 | ||
Labour | Lee Robert Mcstein | 1,206 | 43.6 | ||
Independent | Rachael Flaszczak | 900 | 32.6 | ||
Independent | Anthony Thomas Waite | 784 | 28.4 | ||
Leigh and Atherton Independent | Cameron John Smith | 532 | 19.3 | ||
Independent | Mary Halliday | 520 | 18.8 | ||
Conservative | Kathryn Eirlys Williams | 391 | 14.2 | ||
Leigh and Atherton Independent | Luke Greenhalgh | 279 | 10.1 | ||
Turnout | 2,763 | 26.7 | 1.5 | ||
Labour hold | Swing | ||||
Party | Candidate | Votes | % | ±% | |
---|---|---|---|---|---|
Independent | Steve Jones* | 1,485 | 60.4 | ||
Independent | Sylvia Wilkinson* | 1,122 | 45.7 | ||
Independent | Scarlett Rose Myler | 1,087 | 44.2 | ||
Labour | Margaret Therese Gaffney | 670 | 27.3 | ||
Labour | Samantha Joyce Lloyd | 626 | 25.5 | ||
Labour | Sandra Mary Swift | 599 | 24.4 | ||
Independent | John Cookson | 551 | 22.4 | ||
Conservative | Marie Winstanley | 166 | 6.8 | ||
Turnout | 2,457 | 27.4 | 2.6 | ||
Independent hold | Swing | ||||
Independent gain from Labour | Swing | ||||
Party | Candidate | Votes | % | ±% | |
---|---|---|---|---|---|
Labour | Mary Gwendoline Callaghan* | 1,236 | 64.1 | ||
Labour | Patricia Draper* | 1,216 | 63.0 | ||
Labour | Matthew Thomas Dawber | 1,180 | 61.2 | ||
Green | Peter Jacobs | 416 | 21.6 | ||
Conservative | Margaret Atherton | 380 | 19.7 | ||
Turnout | 1,929 | 20.2 | 0.3 | ||
Labour hold | Swing | ||||
Party | Candidate | Votes | % | ±% | |
---|---|---|---|---|---|
Labour | Yvonne Marie Klieve* | 1,501 | 64.8 | ||
Labour | Gena Merrett* | 1,362 | 58.8 | ||
Labour | Susan Gambles* | 1,320 | 57.0 | ||
Conservative | Stanley Crook | 460 | 19.9 | ||
Conservative | Angela anne Roberts | 418 | 18.0 | ||
Conservative | Richard Byrom Houlton | 409 | 17.7 | ||
Reform UK | Brian Aspinall | 276 | 11.9 | ||
Liberal Democrats | Stuart John Worthington | 187 | 8.1 | ||
Turnout | 2,317 | 25.4 | 2.9 | ||
Labour hold | Swing | ||||
Party | Candidate | Votes | % | ±% | |
---|---|---|---|---|---|
Labour | Paul John Blay* | 1,154 | 49.2 | ||
Labour | Jim Churton | 1,037 | 44.2 | ||
Labour | James Talbot* | 1,003 | 42.8 | ||
Independent | Jim Ellis* | 804 | 34.3 | ||
Independent | Susan Jane Ellis | 519 | 22.1 | ||
Independent | David Joseph Culshaw | 473 | 20.2 | ||
Independent | Hilda Bridget Byrne | 355 | 15.1 | ||
UKIP | Jordan James Gaskell | 227 | 9.7 | ||
Conservative | Frederick John Stuart | 196 | 8.4 | ||
Liberal Democrats | John Charles Skipworth | 186 | 7.9 | ||
Turnout | 2,346 | 23.7 | 0.4 | ||
Labour hold | Swing | ||||
Labour gain from Independent | Swing | ||||
Labour hold | Swing | ||||
Party | Candidate | Votes | % | ±% | |
---|---|---|---|---|---|
Independent | Bob Brierley* | 1,150 | 47.4 | ||
Labour | John Melville Vickers* | 1,139 | 46.9 | ||
Labour | Jim Palmer* | 1,117 | 46.0 | ||
Labour | David Josiah Aitchison | 1,054 | 43.4 | ||
Independent | Mark James Prescott | 667 | 27.5 | ||
Conservative | Paul John Chapman | 361 | 14.9 | ||
Liberal Democrats | Gary John Skipworth | 212 | 8.7 | ||
Turnout | 2,427 | 26.4 | 0.5 | ||
Independent hold | Swing | ||||
Labour hold | Swing | ||||
Party | Candidate | Votes | % | ±% | |
---|---|---|---|---|---|
Independent | Maureen Ann O'Bern | 1,106 | 53.1 | ||
Labour | David Trevor Molyneux* | 965 | 46.4 | ||
Labour | Janice Sharratt* | 808 | 38.8 | ||
Labour | James Moodie* | 713 | 34.3 | ||
Conservative | Allan Atherton | 277 | 13.3 | ||
Turnout | 2,081 | 22.5 | 3.8 | ||
Independent gain from Labour | Swing | ||||
Labour hold | Swing | ||||
Party | Candidate | Votes | % | ±% | |
---|---|---|---|---|---|
Labour | Keith Cunliffe* | 1,472 | 65.1 | ||
Labour | Shelley Guest* | 1,415 | 62.6 | ||
Labour | Fred Walker* | 1,207 | 53.4 | ||
Leigh Central Independent | James Edward Morley | 431 | 19.1 | ||
Conservative | Jean Dickinson | 404 | 17.9 | ||
Leigh Central Independent | Dave Fraser | 360 | 15.9 | ||
Leigh Central Independent | Hannah Elizabeth Sephton | 357 | 15.8 | ||
Liberal Democrats | Andrew Julian Lee Holland | 149 | 6.6 | ||
Turnout | 2,261 | 21.6 | 4.1 | ||
Labour hold | Swing | ||||
Party | Candidate | Votes | % | ±% | |
---|---|---|---|---|---|
Labour | Kevin Anderson* | 1,579 | 59.6 | ||
Labour | John David O'Brien* | 1,529 | 57.7 | ||
Labour | Charles Rigby* | 1,390 | 52.5 | ||
Conservative | James Falle Geddes | 769 | 29.0 | ||
Conservative | Dominic Alexis Sutton | 710 | 26.8 | ||
Conservative | Mark Michael Temperton | 685 | 25.9 | ||
Liberal Democrats | Christopher John Noon | 468 | 17.7 | ||
Turnout | 2,649 | 28.3 | 1.0 | ||
Labour hold | Swing | ||||
Party | Candidate | Votes | % | ±% | |
---|---|---|---|---|---|
Labour | Dane Kevan Anderton* | 1,386 | 60.9 | ||
Labour | Samantha Clare Brown* | 1,375 | 60.4 | ||
Labour | Sue Greensmith* | 1,312 | 57.6 | ||
Conservative | Marie Elizabeth Cooper | 383 | 16.8 | ||
Leigh West Independent | David John Evans | 367 | 16.1 | ||
Leigh West Independent | Jayson Allan Hargreaves | 352 | 15.5 | ||
Leigh West Independent | Rodney Halliwell | 342 | 15.0 | ||
Liberal Democrats | Simon Paul Brooks | 199 | 8.7 | ||
Turnout | 2,276 | 20.8 | 1.9 | ||
Labour hold | Swing | ||||
Party | Candidate | Votes | % | ±% | |
---|---|---|---|---|---|
Labour | Jenny Gregory | 1,820 | 48.2 | ||
Labour | Garry Peter Lloyd | 1,818 | 48.2 | ||
Conservative | Kathleen Houlton* | 1,751 | 46.4 | ||
Conservative | Sheila Gough | 1,734 | 45.9 | ||
Labour | Tracy Ann Croft | 1,705 | 45.2 | ||
Conservative | Edward Noel Houlton* | 1,683 | 44.6 | ||
Turnout | 3,774 | 34.0 | 1.2 | ||
Labour gain from Conservative | Swing | ||||
Conservative hold | Swing | ||||
Party | Candidate | Votes | % | ±% | |
---|---|---|---|---|---|
Labour | Mark Ian Tebbutt | 1,429 | 48.3 | ||
Labour | Jim Nicholson | 1,317 | 44.5 | ||
Labour | Anne Collins | 1,310 | 44.2 | ||
Conservative | Michael William Winstanley | 1,259 | 42.5 | ||
Conservative | Marjorie Clayton* | 1,194 | 40.3 | ||
Conservative | Paul Kevin Bannister | 1,144 | 38.6 | ||
Liberal Democrats | Neil Duncan Stevenson | 369 | 12.5 | ||
Turnout | 2,961 | 31.4 | 1.2 | ||
Labour hold | Swing | ||||
Labour gain from Conservative | Swing | ||||
Party | Candidate | Votes | % | ±% | |
---|---|---|---|---|---|
Labour | Jeanette Prescott* | 1,102 | 58.9 | ||
Labour | Paul Prescott* | 1,033 | 55.2 | ||
Labour | Eileen Winifred Rigby* | 890 | 47.6 | ||
Independent | Tony Porter | 515 | 27.5 | ||
Conservative | Jean Margaret Peet | 360 | 19.3 | ||
Liberal Democrats | David John Burley | 321 | 17.2 | ||
Turnout | 1,870 | 19.6 | 1.0 | ||
Labour hold | Swing | ||||
Party | Candidate | Votes | % | ±% | |
---|---|---|---|---|---|
Labour | Paul Anthony Collins* | 1,661 | 50.5 | ||
Labour | Michael John Crosby* | 1,477 | 44.9 | ||
Labour | Vicky Galligan* | 1,382 | 42.0 | ||
Shevington Independents part of Wigan Independents | Gareth William Fairhurst | 1,102 | 33.5 | ||
Conservative | Michael Colin Owens | 710 | 21.6 | ||
Conservative | Niall Mark El-Assaadd | 528 | 16.1 | ||
Liberal Democrats | Vincent Dean Holgate | 433 | 13.2 | ||
Turnout | 3,287 | 33.4 | 0.5 | ||
Labour hold | Swing | ||||
Party | Candidate | Votes | % | ±% | |
---|---|---|---|---|---|
Labour | Debbie Parkinson* | 1,705 | 47.7 | ||
Conservative | Raymond Whittingham* | 1,411 | 39.5 | ||
Labour | Terry Mugan | 1,303 | 36.5 | ||
Conservative | Judith Atherton* | 1,301 | 36.4 | ||
Labour | Samuel Floyd Flemming | 1,203 | 33.7 | ||
Conservative | Gary Robinson | 1,082 | 30.3 | ||
Standish Independents | Debbie Fairhurst | 795 | 22.2 | ||
Reform UK | Andy Dawber | 260 | 7.3 | ||
TUSC | Sharon Holden | 150 | 4.2 | ||
Turnout | 3,574 | 31.6 | 0.6 | ||
Labour hold | Swing | ||||
Conservative hold | Swing | ||||
Labour gain from Conservative | Swing | ||||
Party | Candidate | Votes | % | ±% | |
---|---|---|---|---|---|
Labour | Joanne Marshall* | 1,425 | 56.4 | ||
Labour | Jess Eastoe | 1,304 | 51.6 | ||
Independent | James Anthony Fish | 979 | 38.7 | ||
Labour | Farai Nhakaniso | 940 | 37.2 | ||
Conservative | Ashley Mccarrick | 626 | 24.8 | ||
Turnout | 2,528 | 26.1 | 0.2 | ||
Labour hold | Swing | ||||
Independent gain from Labour | Swing | ||||
Party | Candidate | Votes | % | ±% | |
---|---|---|---|---|---|
Labour | Lawrence Hunt* | 1,711 | 61.7 | ||
Labour | George Davies* | 1,578 | 56.9 | ||
Labour | Michael Mcloughlin* | 1,419 | 51.1 | ||
Conservative | Mark Nicholas Frith | 832 | 30.0 | ||
Liberal Democrats | Brian Dennis Whitney | 666 | 24.0 | ||
Turnout | 2,775 | 29.7 | 0.7 | ||
Labour hold | Swing | ||||
Party | Candidate | Votes | % | ±% | |
---|---|---|---|---|---|
Labour | Phyll Cullen* | 1,492 | 60.2 | ||
Labour | David Anthony Wood | 1,251 | 50.5 | ||
Labour | Sheila Rosaleen Ramsdale | 1,206 | 48.7 | ||
Liberal Democrats | Ian Dyer | 777 | 31.4 | ||
Liberal Democrats | Stuart David Thomas | 528 | 21.3 | ||
Liberal Democrats | Brian Craig Duff Crombie-Fisher | 499 | 20.1 | ||
Conservative | Adam James Marsh | 320 | 12.9 | ||
Turnout | 2,478 | 25.3 | 2.2 | ||
Labour hold | Swing | ||||
Party | Candidate | Votes | % | ±% | |
---|---|---|---|---|---|
Labour | Paul Terence Kenny* | 1,436 | 61.3 | ||
Labour | Marie Teresa Morgan* | 1,344 | 57.3 | ||
Labour | Clive William Morgan* | 1,244 | 53.1 | ||
Conservative | Margaret Mary Winstanley | 563 | 24.0 | ||
Liberal Democrats | Robert Duncan Stevenson | 498 | 21.2 | ||
Reform UK | Robert Francis Kenyon | 427 | 18.2 | ||
Turnout | 2,344 | 26.2 | 0.4 | ||
Labour hold | Swing | ||||
Party | Candidate | Votes | % | ±% | |
---|---|---|---|---|---|
Labour | David Roland Hurst* | 1,416 | 65.1 | ||
Labour | Helen Louise O'Neill | 1,009 | 46.4 | ||
Labour | Paul David James Molyneux | 999 | 46.0 | ||
Independent | Danny Cooke | 645 | 29.7 | ||
Conservative | Susan Atherton | 428 | 19.7 | ||
Liberal Democrats | Donald John Macnamara | 312 | 14.4 | ||
Turnout | 2,174 | 24.4 | 1.1 | ||
Labour hold | Swing | ||||
The Metropolitan Borough of Wigan is a metropolitan borough of Greater Manchester, England. It is named after its largest town, Wigan but covers a far larger area which includes the towns of Atherton, Ashton-in-Makerfield, Golborne, Hindley, Ince-in-Makerfield, Leigh and Tyldesley. The borough also covers the villages and suburbs of Abram, Aspull, Astley, Bryn, Hindley Green, Lowton, Mosley Common, Orrell, Pemberton, Shevington, Standish, Winstanley and Worsley Mesnes. The borough is also the second-most populous district in Greater Manchester.
Stockport Metropolitan Borough Council (SMBC) is the local authority for the Metropolitan Borough of Stockport, Greater Manchester, England. The council is currently run by a Liberal Democrat minority administration. At the 2023 local elections, the Liberal Democrats gained two more seats, increasing their lead over the Labour Party to six seats, and retaining minority control. This lead is now five seats after one of the Liberal Democrats’ councillors resigned the whip, days after being re-elected. The Liberal Democrats currently have 29 seats, Labour 24, and the Heald Green Ratepayers, Greens and the Edgeley Community Association each holding 3. There is 1 independent.
Bolton Metropolitan Borough Council elections are generally held three years out of every four, with a third of the council being elected each time. Bolton Metropolitan Borough Council, generally known as Bolton Council, is the local authority for the metropolitan borough of Bolton in Greater Manchester, England. Since the last boundary changes in 2004, 60 councillors have been elected from 20 wards. New ward boundaries are being prepared to take effect from the 2023 election.
The 2021 Wigan Metropolitan Borough Council election took place on 6 May 2021 to elect members of Wigan Metropolitan Borough Council in England. This election was held on the same day as other local elections. The election was originally due to take place on 7 May 2020, but was postponed due to the COVID-19 pandemic. A by-election was held on the same day in Orrell ward to fill the seat left vacant by the death of Conservative councillor Richard Clayton.
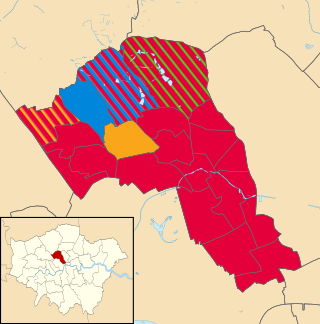
The 2022 Camden London Borough Council election took place on 5 May 2022. All 55 members of Camden London Borough Council were elected. The elections took place alongside local elections in the other London boroughs and elections to local authorities across the United Kingdom.
The 2022 Manchester City Council election took place on 5 May 2022. One third of councillors on Manchester City Council were elected. This election was a part of the other local elections across the United Kingdom.
The 2022 Bury Metropolitan Borough Council election took place on 5 May 2022. Due to boundary changes, all 51 councillors were elected at the same time. The election took place alongside other local elections across the United Kingdom.
The 2022 Rochdale Metropolitan Borough Council election took place as of 5 May 2022. Due to boundary changes, all 60 councillors were elected at the same time. The election took place alongside other local elections across the United Kingdom.
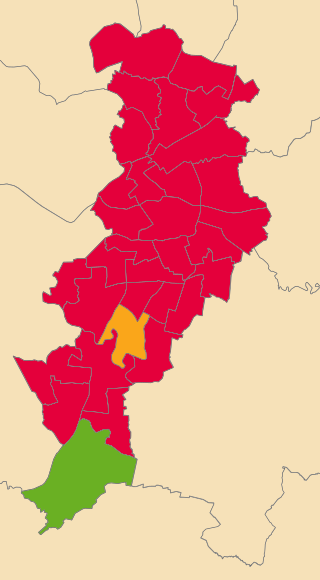
The 2022 St Helens Metropolitan Borough Council election took place on 5 May 2022. Due to boundary changes, all 48 councillors were elected at the same time, with the council moving to a system of all-out elections every four years. The election took place alongside other local elections across the United Kingdom.
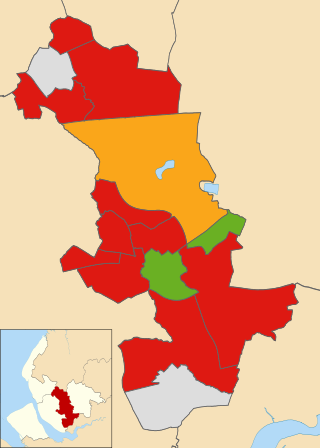
The 2022 Knowsley Metropolitan Borough Council election took place on 5 May 2022. One third of councillors — 15 out of 45 — on Knowsley Metropolitan Borough Council were elected. The election took place alongside other local elections across the United Kingdom.
The 2022 Salford City Council election took place on 5 May 2022 along with other local elections across the United Kingdom. One third—20 out of 60—of councillor seats on Salford City Council were up for election.
The 2023 Salford City Council elections were held on 4 May 2023 alongside other local elections across the United Kingdom. One third of seats (20) on Salford City Council were up for election, with an additional seat being contested in a by-election in Pendlebury & Clifton.
The 2023 Bolton Metropolitan Borough Council elections took place on 4 May 2023 alongside other local elections across the United Kingdom. Due to boundary changes, all 60 seats on Bolton Metropolitan Borough Council were up for election.
The 2023 Bury Metropolitan Borough Council elections took place on 4 May 2023 alongside other local elections across the United Kingdom. One third of seats (17) on Bury Metropolitan Borough Council were contested. Labour retained its control of the council.
The 2023 Oldham Metropolitan Borough Council elections took place on 4 May 2023 alongside other local elections across the United Kingdom. Due to boundary changes all 60 seats on Oldham Metropolitan Borough Council were contested.
The 2023 Tameside Metropolitan Borough Council elections took place on 4 May 2023 alongside other local elections in the United Kingdom. Due to boundary changes, all 57 seats on Tameside Metropolitan Borough Council were contested.
The 2023 Trafford Metropolitan Borough Council elections took place on 4 May 2023 alongside other elections in the United Kingdom. Due to boundary changes, all 63 seats were contested.
The 2024 Manchester City Council elections are scheduled to take place on 2 May 2024, alongside the 2024 Greater Manchester mayoral election and other local elections across England. One third of members of Manchester City Council are up for election.
The 2024 Salford City Council elections are scheduled to be held on 2 May 2024 alongside the 2024 Greater Manchester mayoral election, 2024 Salford mayoral election and other local elections across the United Kingdom. One third of seats (20) on Salford City Council are up for election.
The 2024 Rochdale Metropolitan Borough Council elections are due to take place on 2 May 2024 alongside the 2024 Greater Manchester mayoral election and other local elections across the United Kingdom. One third of seats (20) on Rochdale Metropolitan Borough Council will be contested.