2006 Bury Metropolitan Borough Council election

Last updated

2006 Bury Metropolitan Borough Council election
Flag of England.svg
  2004 4 May 2006 2007  

17 of the 51 seats on Bury Metropolitan Borough Council
26 seats needed for a majority
 First partySecond partyThird party
 
Party Conservative Labour Liberal Democrats
Seats won953
Seats after22236
Seat changeIncrease2.svg 3Decrease2.svg 4Increase2.svg 1
Popular vote21,61917,33711,072
Percentage42.2%33.8%21.6%
SwingIncrease2.svg 5.2%Decrease2.svg 1.2%Decrease2.svg 0.1%

Bury UK local election 2006.svg
Labour in red, Conservatives in blue and Liberal Democrats in orange.

Council control before election


Labour

Council control after election


No overall control

The Metropolitan Borough of Bury shown within England. EnglandBury.png
The Metropolitan Borough of Bury shown within England.

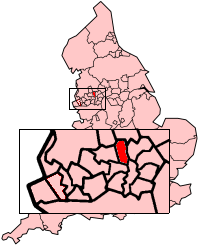
Elections to Bury Metropolitan Borough Council were held on 4 May 2006. One third of the council was up for election, and the Labour Party lost control of the council.

Contents

After the election, the composition of the council was:

Election result

Bury Local Election Result 2006
PartySeatsGainsLossesNet gain/lossSeats %Votes %Votes+/−
  Labour 515-433.817,337-1.2
  Conservative 941+342.221,619+5.2
  Liberal Democrats 310+121.611,072-0.1
  Independent 000002.51,259-0.6

Ward results

Besses
PartyCandidateVotes%±%
Labour Ken Audin 1,085 47.5 −5.8
Conservative Jonathan Grosskopf59726.1+0.4
Liberal Democrats Mary D'Albert39617.3−3.8
Independent Lucy Cohn2089.1+9.1
Majority 48821.3
Turnout 2,286
Labour hold Swing
Church
PartyCandidateVotes%±%
Conservative Robert Bibby 2,048 57.8 +10.9
Labour Benjamin Shatliff84723.9−0.2
Liberal Democrats Paul Jenkins64918.3+3.8
Majority 1,20138.9
Turnout 3,544
Conservative hold Swing
East
PartyCandidateVotes%±%
Labour Trevor Holt 1,259 52.9 +15.6
Conservative Azmat Husain70229.5+3.5
Liberal Democrats Ewan Arthur59718.6−6.7
Majority 55723.4
Turnout 2,382
Labour hold Swing
Elton
PartyCandidateVotes%±%
Conservative Michael Hankey 1,533 47.7 +9.1
Labour Stella Smith1,08333.7−0.9
Liberal Democrats Ewan Arthur59718.6+1.9
Majority 45014.0
Turnout 3,213
Conservative gain from Labour Swing
Holyrood
PartyCandidateVotes%±%
Liberal Democrats Tim Pickstone 1,576 52.0 −4.7
Conservative Marilyn Vincent75725.0+5.6
Labour Suzanne Johnston69923.1−0.8
Majority 81927.0
Turnout 3,032
Liberal Democrats hold Swing
Moorside
PartyCandidateVotes%±%
Conservative Peter Ashworth 1,129 40.2 +7.0
Labour Warren Flood99535.4−9.3
Liberal Democrats Victor Hagan68624.4+2.3
Majority 1344.8
Turnout 2,810
Conservative gain from Labour Swing
North Manor
PartyCandidateVotes%±%
Conservative James Taylor 2,350 61.9 +1.7
Liberal Democrats Robert Sloss74119.5+1.3
Labour Francis Shatliff70618.6−2.9
Majority 1,60942.4
Turnout 3,797
Conservative hold Swing
Pilkington Park
PartyCandidateVotes%±%
Conservative Bernard Vincent 1,760 61.7 +10.1
Labour Alan Quinn84029.5−1.8
Liberal Democrats Mohammed Mustafa2518.8−8.4
Majority 92032.3
Turnout 2,851
Conservative hold Swing
Radcliffe East
PartyCandidateVotes%±%
Conservative Catherine Berry 1,029 38.8 +12.7
Labour Steve Perkins96336.3−1.8
Liberal Democrats Michael Halsall46017.4−0.6
Independent Paul Clarke1997.5+7.5
Majority 662.5
Turnout 2,651
Conservative gain from Labour Swing
Radcliffe North
PartyCandidateVotes%±%
Labour Sharron Briggs 1,431 42.2 +2.0
Conservative Stuart Penketh1,41641.7+7.1
Liberal Democrats Maureen Davison36710.8−6.1
Independent Matthew Randall1805.3−3.1
Majority 150.4
Turnout 3,394
Labour hold Swing
Radcliffe West
PartyCandidateVotes%±%
Labour Wayne Campbell 1,231 54.9 +1.0
Conservative Alan Bigg70931.6+3.8
Independent Deborah Fallon30113.4+13.4
Majority 52223.3
Turnout 2,241
Labour hold Swing
Ramsbottom
PartyCandidateVotes%±%
Conservative Diane Ashworth 1,759 56.3 +5.1
Labour Valerie Robinson93930.0−0.9
Liberal Democrats Fiona Davison42713.7−4.2
Majority 82026.2
Turnout 3,125
Conservative hold Swing
Redvales
PartyCandidateVotes%±%
Labour Farook Chaudhry 1,178 37.5 +2.7
Conservative Khalid Hussain1,12735.8+8.5
Liberal Democrats Bill Brison84026.7+3.9
Majority 511.6
Turnout 3,145
Labour gain from Conservative Swing
St Mary's
PartyCandidateVotes%±%
Liberal Democrats Donal O'Hanlon 1,333 42.0 +17.6
Labour Steve Treadgold89628.2−14.6
Conservative Denise Ormrod72722.9−9.9
Independent Andrew Duff2176.8+6.8
Majority 43713.8
Turnout 3,173
Liberal Democrats gain from Labour Swing
Sedgley
PartyCandidateVotes%±%
Liberal Democrats Andrew Garner 1,478 39.1 +1.5
Labour Peter Timperley1,22432.4−1.9
Conservative Shneur Odze 1,07528.5+0.5
Majority 2546.7
Turnout 3,777
Liberal Democrats hold Swing
Tottington
PartyCandidateVotes%±%
Conservative Iain Garside 1,590 57.2 +13.9
Labour Jane Lewis71125.6−1.2
Liberal Democrats David Foss47817.2+3.2
Majority 87931.6
Turnout 2,779
Conservative hold Swing
Unsworth
PartyCandidateVotes%±%
Conservative Beverley Sullivan 1,311 42.5 +2.5
Labour Joan Grimshaw1,25040.5+1.1
Liberal Democrats Geoffrey Young37212.1−0.9
Independent Paul Gerrard1545.0−2.6
Majority 612.0
Turnout 3,087
Conservative gain from Labour Swing

References