
Brighton Pavilion is a constituency represented in the House of Commons of the UK Parliament since 2024 by Siân Berry of the Green Party.
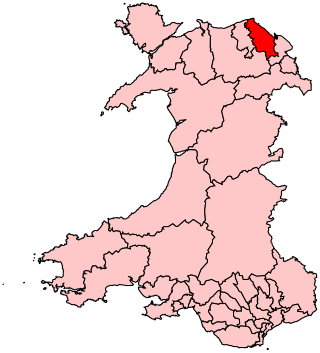
Delyn was a constituency in the House of Commons of the UK Parliament from 1983 to 2024.

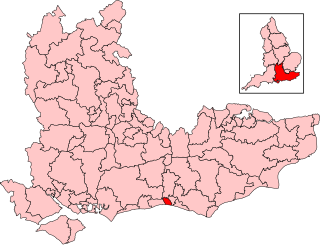
Lewes is a constituency in East Sussex represented in the House of Commons of the UK Parliament since 2024 by James MacCleary, a Liberal Democrat.

Brighton Kemptown and Peacehaven is a constituency represented in the House of Commons of the UK Parliament since the 2024 general election by Chris Ward of the Labour Party.

Basingstoke is a constituency in Hampshire represented in the House of Commons of the UK Parliament since 2024 by Luke Murphy, a member of the Labour Party.
Hove and Portslade is a borough constituency in East Sussex represented in the House of Commons of the UK Parliament since 2015 by Peter Kyle of the Labour Party, who currently serves as Secretary of State for Science, Innovation and Technology in the government of Keir Starmer.
Brighton and Hove City Council is a unitary authority in East Sussex, England. It was created as Brighton and Hove Borough Council on 1 April 1997 replacing Brighton and Hove Borough Councils. It was granted city status in 2001.

The 1999 Wirral Metropolitan Borough Council election took place on 6 May 1999 to elect members of Wirral Metropolitan Borough Council in England. This election was held on the same day as other local elections.

The 2002 Wirral Metropolitan Borough Council election took place on 2 May 2002 to elect members of Wirral Metropolitan Borough Council in England. This election was held on the same day as other local elections.
The 2006 Wirral Metropolitan Borough Council election took place on 4 May 2006 to elect members of Wirral Metropolitan Borough Council in England. This election was held on the same day as other local elections.

East Sussex County Council is the upper tier local authority for the non-metropolitan county of East Sussex in England. The non-metropolitan county is smaller than the ceremonial county; the latter additionally includes Brighton and Hove.

Brighton and Hove City Council is the local authority for Brighton and Hove, a local government district with city status in the ceremonial county of East Sussex, England. The council is a unitary authority, being a district council which also performs the functions of a county council. The council has been under Labour majority control since 2023. It is based at Hove Town Hall.

The 2014 Wirral Metropolitan Borough Council election took place on 22 May 2014 to elect members of Wirral Metropolitan Borough Council in England. This election was held on the same day as other local elections.

The 2014 Basingstoke and Deane Borough Council election took place on 22 May 2014 to elect members of Basingstoke and Deane Borough Council in England. This was on the same day as other local elections. These elections were postponed from the usual first Thursday of May in order to coincide with the 2014 European Parliamentary Elections.
Hove was a non-metropolitan district in East Sussex, England. It was abolished on 1 April 1997 and replaced by Brighton and Hove.
Brighton was a non-metropolitan district in East Sussex, England. It was abolished on 1 April 1997 and replaced by Brighton and Hove.

The 1996 Brighton and Hove Borough Council election was held on 9 May 1996 to elect members to the new unitary authority of Brighton and Hove Borough Council in East Sussex, England. It was the inaugural election to the new council, and was held nearly a year before the council formally came into being on 1 April 1997, replacing the former Brighton Borough Council and Hove Borough Council. The councillors elected in May 1996 served as a shadow authority alongside the outgoing councils, overseeing the transition to the new arrangements, until coming into their powers in April 1997.

The 1999 Brighton and Hove Borough Council election was held on 6 May 1999 to elect members of Brighton and Hove Borough Council in East Sussex, England.
The 1995 Wirral Metropolitan Borough Council election took place on 4 May 1995 to elect members of Wirral Metropolitan Borough Council in England. This election was held on the same day as other local elections.
New Brighton is a Wirral Metropolitan Borough Council ward in the Wallasey Parliamentary constituency.
