2005 Essex County Council election

Last updated

2005 Essex County Council election
Flag of Essex.svg
  2001 9 May 2005 2009  

All 75 seats to Essex County Council
38 seats needed for a majority
 First partySecond partyThird party
  No image wide.svg No image wide.svg No image wide.svg
Party Conservative Labour Liberal Democrats
Last election49 seats, 41.7%19 seats, 30.6%10 seats, 24.3%
Seats before481811
Seats won52138
Seat changeIncrease2.svg4Decrease2.svg5Decrease2.svg3
Popular vote285,899156,561147,561
Percentage44.5%24.3%22.9%
SwingIncrease2.svg 2.8%Decrease2.svg 6.3%Increase2.svg 1.4%

 Fourth partyFifth partySixth party
  No image wide.svg No image wide.svg No image wide.svg
Party Community Representative Loughton Residents Green
Last election0 seats, 0.6%1 seats, 0.4%0 seats, 1.9%
Seats before110
Seats won110
Seat changeIncrease2.svg1Steady2.svgSteady2.svg
Popular vote6,0032,73435,696
Percentage0.9%0.4%5.6%
SwingIncrease2.svg 0.3%Steady2.svgIncrease2.svg 3.7%

Essex UK local election 2005 map.svg
Results by electoral division.Conservatives in blue, Labour in red, Liberal Democrats in yellow, Community Representatives Party in pink and Loughton Residents Association in green.

Majority party before election

Conservative

Majority party after election

Conservative

An election to Essex County Council took place on 9 May 2005 as part of the 2005 United Kingdom local elections. 75 councillors were elected from various electoral divisions, which returned either one or two county councillors each by first-past-the-post voting for a four-year term of office. The electoral divisions were redrawn for this election.

Contents

The Conservative Party retained control with an increased majority, winning 52 of the 75 seats. Labour and the Liberal Democrats both lost seats.

Previous composition

2001 election

PartySeats
Conservative 49
Labour 19
Liberal Democrats 10
Loughton Residents 1
Total79

Composition of council seats before election

PartySeats
Conservative 48
Labour 18
Liberal Democrats 11
Loughton Residents 1
Community Representative1
Total79

Results

Essex County Council election, 2005 [1] [2]
PartySeatsGainsLossesNet gain/lossSeats %Votes %Votes+/−
  Conservative 52Increase2.svg 444.5285,899+2.8
  Labour 13Decrease2.svg 524.3156,561−6.3
  Liberal Democrats 8Decrease2.svg 322.9147,561+1.4
  Community Representative 1Increase2.svg 10.96,003+0.3
  Loughton Residents 1Steady2.svg0.42,734Steady2.svg
  Green 0Steady2.svg5.635,696+3.7
  UKIP 0Steady2.svg0.64,112N/A
  Independent 0Steady2.svg0.32,070−0.3
  BNP 0Steady2.svg0.21,391N/A
  English Democrat 0Steady2.svg0.1825N/A
  Veritas 0Steady2.svg>0.1158N/A
Total75

Election of Group Leaders

Paul White (Stock) was re elected leader of the Conservative Group, Tom Smith-Hughes (Chelmsford North) was elected leader of the Liberal Democratic Group and Paul Kirkman (Pitsea) was elected leader of the Labour Group.

Election of Leader of the Council

Paul White the leader of the conservative group was duly elected leader of the council and formed a conservative administration.

Results by District

Basildon

District summary

PartySeats+/-Votes%+/-
Conservative 5Steady2.svg57,45945.8+2.8
Labour 4Decrease2.svg 139,53731.5−7.8
Liberal Democrat 0Steady2.svg22,78718.2+0.8
Green 0Steady2.svg5,1014.1+4.1
English Democrats 0Steady2.svg4570.4+0.4

Division results

Basildon Westley Heights
PartyCandidateVotes%±%
Conservative John Schofield 3,654 37.9 −3.6
Liberal Democrats Geoffrey Williams *2,75328.6+7.8
Labour Swatantra Nadanwar *2,48925.8−11.9
English Democrat Kim Gandy4574.7New
Green Ernest Humphries2832.9New
Majority9019.3+5.5
Turnout 9,63662.9+2.0
Conservative hold Swing −5.7

Between 2001 and 2005, the seat was won by the Liberal Democrats candidate in a by-election, however it is shown as a hold as it is compared to the previous full council election.

Billericay and Burstead
PartyCandidateVotes%
Conservative Anthony Headley * 10,933 58.3
Conservative Kay Twitchen * 8,418
Liberal Democrats Gilda Bellard3,86820.6
Liberal Democrats Geoffrey Raylor3,718
Labour Patricia Reid2,67414.3
Labour Margaret Viney2,369
Green Annie Humphries1,2696.8
Majority7,0659.4
Turnout 18,49069.7
Conservative win (new seat)
Laindon Park and Fryerns
PartyCandidateVotes%
Labour William Archibald * 6,707 48.3
Labour Rachel Liebeschuetz * 5,349
Conservative Terry Fleet4,10729.6
Conservative Terri Sargent3,904
Liberal Democrats Linda Williams1,90313.7
Liberal Democrats Jonathan Myall1,539
Green Adam Ellis1,1778.5
Majority18.7
Turnout 55.7
Labour win (new seat)
Pitsea
PartyCandidateVotes%
Labour Keith Bobbin * 6,968 45.6
Labour Paul Kirkman * 6,181
Conservative David Abrahall4,91032.1
Conservative Andrew Baggott4,271
Liberal Democrats Martin Howard2,22914.6
Liberal Democrats Philip Jenkins1,964
Green David Wilkinson1,1897.8
Majority13.5
Turnout 51.2
Labour win (new seat)
Wickford Crouch
PartyCandidateVotes%
Conservative Don Morris * 8,841 53.9
Conservative Iris Pummell * 8,421
Labour Wendy Aitken3,92724.0
Labour Christopher Wilson3,873
Liberal Democrats Vivien Howard2,44414.9
Liberal Democrats Michael Woods2,369
Green Dean Hall1,1837.2
Majority30.0
Turnout 62.3
Conservative win (new seat)

Braintree

District summary

PartySeats+/-Votes%+/-
Conservative 6Steady2.svg29,21243.2+3.1
Labour 2Increase2.svg 120,73230.7−5.1
Liberal Democrat 0Steady2.svg11,80817.5+0.2
Green 0Steady2.svg4,6136.8Steady2.svg
UKIP 0Steady2.svg1,2561.9+1.9

Division results

Bocking
PartyCandidateVotes%±%
Labour Lynn Watson 3,231 40.1 +0.5
Conservative Jean Schmitt3,01037.4−3.7
Liberal Democrats Terrence Brooks1,36216.9+4.1
Green Wendy Partridge4495.6−0.8
Majority2212.7
Turnout 8,05261.7−3.0
Labour gain from Conservative Swing +2.1
Braintree Eastern
PartyCandidateVotes%
Conservative Nigel Edey * 3,688 43.0
Labour Eileen Davidson2,87833.6
Liberal Democrats Peter Braley1,25114.6
Green Duncan Stewart4144.8
UKIP Barbara Coutts3383.9
Majority8109.5
Turnout 8,56969.0
Conservative win (new seat)
Braintree Town
PartyCandidateVotes%
Labour Elwyn Bishop 2,700 35.9
Conservative Graham Butland2,48533.1
Liberal Democrats Douglas Rice1,73023.0
Green Philip Hughes3274.4
UKIP Heather Sheehan2733.6
Majority2152.9
Turnout 7,51560.9
Labour win (new seat)
Halstead
PartyCandidateVotes%±%
Conservative Joseph Pike * 4,378 47.0 +2.7
Labour Moia Thorogood2,48626.7−6.4
Liberal Democrats Christine Bayley1,88720.3+2.0
Green Nelson Brunton5606.0+1.7
Majority1,89220.3+9.1
Turnout 9,31163.8+1.5
Conservative hold Swing +4.6
Hedingham
PartyCandidateVotes%±%
Conservative David Finch * 4,959 52.5 +4.8
Liberal Democrats Stephen Bolter2,18223.1+0.8
Labour John Kotz1,72218.2−7.1
Green Robert Kenney5906.2+1.4
Majority2,77729.4+7.0
Turnout 9,45369.4+4.0
Conservative hold Swing +2.0
Three Fields with Great Notley
PartyCandidateVotes%
Conservative Roger Walters * 4,045 51.9
Labour William Edwards1,68221.6
Liberal Democrats Lesley Beckett1,47518.9
Green Kevin Peterson3164.1
UKIP Michael Baker2783.6
Majority2,36330.3
Turnout 7,79670.0
Conservative win (new seat)
Witham Northern
PartyCandidateVotes%±%
Conservative Michael Lager 3,108 37.8 +8.7
Labour Phillip Barlow *2,87835.0−7.0
Green James Abbott1,37616.7−0.2
Liberal Democrats Martin Ashby4906.0−6.0
UKIP Bryan Smith3674.5New
Majority2302.6
Turnout 8,88365.3+4.1
Conservative gain from Labour Swing +7.9
Witham Southern
PartyCandidateVotes%±%
Conservative Derrick Louis 3,539 40.7 −1.1
Labour Jacqueline Martin3,15536.2−2.8
Liberal Democrats Barry Fleet1,43116.4+3.0
Green Stephen Hicks5816.7+0.9
Majority3844.4+1.7
Turnout 8,70663.5+0.9
Conservative hold Swing +0.9

Brentwood

District summary

PartySeats+/-Votes%+/-
Conservative 4Steady2.svg17,86849.3+7.8
Liberal Democrat 0Decrease2.svg 110,75029.6−3.5
Labour 0Steady2.svg4,66512.9−3.4
UKIP 0Steady2.svg1,9305.3+5.3
Green 0Steady2.svg1,0542.9−0.2

Division results

Brentwood Hutton
PartyCandidateVotes%±%
Conservative John Roberts * 5,734 57.8 +9.2
Liberal Democrats Richard Davies 2,29223.1−3.4
Labour Bernadette Pavitt1,33213.4−3.6
UKIP Derek Camp5635.7New
Majority3,44234.7+12.5
Turnout 9,92168.8+1.7
Conservative hold Swing +6.3
Brentwood North
PartyCandidateVotes%±%
Conservative Philip Baker * 4,102 46.7 +11.0
Liberal Democrats Doris Suckling2,68730.6−3.7
Labour Michele Wigram1,14313.0−1.0
Green Frank Seckleman4314.9+1.9
UKIP Yvonne Maguire4194.8New
Majority1,41516.1+14.7
Turnout 8,78267.8−1.1
Conservative hold Swing +7.3
Brentwood Rural
PartyCandidateVotes%±%
Conservative Roger Dyson * 4,751 49.7 +9.0
Liberal Democrats Barry Aspinell *3,06032.0−5.5
Labour Vicki Hann8348.7−2.5
UKIP Michael Heaslip6166.4New
Green Beryl Lankaster2983.1−0.2
Majority1,69117.7+14.5
Turnout 9,55971.1+3.2
Conservative hold Swing +7.3
Brentwood South
PartyCandidateVotes%±%
Conservative Lionel Lee * 3,281 41.0 +2.2
Liberal Democrats David Kendall2,71133.9+2.2
Labour Michael Le-Surf1,35616.9−7.8
UKIP Jeanette Gulleford3324.1New
Green Dean Swift3254.1−0.8
Majority5707.1+0.0
Turnout 8,00565.2−0.4
Conservative hold Swing -0.0

Castle Point

District summary

PartySeats+/-Votes%+/-
Conservative 5Increase2.svg 120,77450.2+1.4
Labour 0Decrease2.svg 214,18534.3−5.6
Liberal Democrat 0Steady2.svg4,47010.8+0.3
Green 0Steady2.svg1,9364.7+3.9

Division results

Canvey Island East
PartyCandidateVotes%±%
Conservative Mark Howard 3,944 45.3 +4.8
Labour Dennis Williams *3,64541.9−5.7
Liberal Democrats Deborah Wood7188.2+0.5
Green Christopher Keane3974.6+0.5
Majority2993.4
Turnout 8,70456.4+3.0
Conservative gain from Labour Swing +5.2
Canvey Island West
PartyCandidateVotes%±%
Conservative Raymond Howard * 3,727 50.8 −4.9
Labour Vincent Heatherson2,78237.9−0.1
Liberal Democrats Shirley Howe5567.6+1.3
Green Irene Willis2693.7New
Majority94512.9−4.8
Turnout 7,33452.7−0.4
Conservative hold Swing −2.4
Hadleigh
PartyCandidateVotes%±%
Conservative Jillian Reeves * 4,998 55.6 +1.4
Labour Jacqueline Reilly2,22924.8−4.7
Liberal Democrats Elizabeth Jones1,02811.4−4.9
Green Vikki Copping7358.2New
Majority2,76930.8+6.2
Turnout 8,99065.6+2.3
Conservative hold Swing +3.1
South Benfleet
PartyCandidateVotes%
Conservative Colin Riley 4,226 50.4
Labour Lorna Trollope2,62731.3
Liberal Democrats Barry Newman1,35716.2
Green Nanine Pachy1752.1
Majority1,59919.1
Turnout 8,38563.2
Conservative win (new seat)
Thundersley
PartyCandidateVotes%±%
Conservative William Dick * 3,879 48.8 −0.2
Labour Joseph Cooke2,90236.5−1.7
Liberal Democrats Paul Westlake81110.2−2.6
Green Eileen Peck3604.5New
Majority97712.3+1.6
Turnout 7,95263.1+3.6
Conservative hold Swing +0.8

Chelmsford

District summary

PartySeats+/-Votes%+/-
Liberal Democrat 5Increase2.svg 125,14331.7+0.4
Conservative 4Steady2.svg34,55343.6+3.4
Labour 0Decrease2.svg 114,26518.0−6.6
Green 0Steady2.svg3,9275.0+1.1
SWFCTA0Steady2.svg8071.0+1.0
UKIP 0Steady2.svg4640.6+0.6
Veritas 0Steady2.svg1580.2+0.2

Division results

Broomfield and Writtle
PartyCandidateVotes%±%
Conservative John Aldridge 4,271 45.4 +1.6
Liberal Democrats John Hunnable2,56527.2−3.4
Labour Prudence Jones1,60317.0−5.0
Green Andrew Tinsley5135.4+1.8
UKIP Charles Cole4644.9New
Majority1,70618.1+5.0
Turnout 9,41666.4+1.9
Conservative hold Swing +2.5
Chelmer
PartyCandidateVotes%
Conservative Peter Martin * 5,364 53.5
Liberal Democrats David Whiteing2,28022.7
Labour David Howell1,73717.3
Green Eleanor Burgess6506.5
Majority3,08430.7
Turnout 10,03163.1
Conservative win (new seat)
Chelmsford Central
PartyCandidateVotes%
Liberal Democrats Keith Francis 2,785 38.0
Conservative David Lee2,58435.3
Labour John Leslie1,53120.9
Green Douglas Copping4305.9
Majority2012.7
Turnout 7,33062.5
Liberal Democrats win (new seat)
Chelmsford North
PartyCandidateVotes%±%
Liberal Democrats Tom Smith-Hughes * 3,276 39.1 +0.5
Conservative Delmas Ashford2,72632.6+3.9
Labour Joan Bliss2,03124.3−5.9
Green Angela Thomson3414.1+1.5
Majority5506.6−1.8
Turnout 8,37460.7−0.6
Liberal Democrats hold Swing −1.7
Chelmsford West
PartyCandidateVotes%±%
Liberal Democrats Ian Gale * 2,876 36.0 +3.6
Conservative Amar Bajaj2,36529.6+3.4
Labour Neil Spurgeon *2,16127.1−11.0
Green Clifford Hughes4265.3+2.0
Veritas Stephen Stratton1582.0New
Majority5116.4+0.8
Turnout 7,98656.5+0.5
Liberal Democrats gain from Labour Swing +7.3
Great Baddow
PartyCandidateVotes%±%
Liberal Democrats Maureen Miller * 3,774 39.3 −3.5
Conservative David Stevenson3,57137.2+4.8
Labour Peter Dixon1,80318.8−2.4
Green Colin Budgey4494.7+1.1
Majority2032.1−8.4
Turnout 9,59763.5+1.7
Liberal Democrats hold Swing −4.2
South Woodham Ferrers
PartyCandidateVotes%
Conservative Norman Hume * 3,950 51.5
Labour Robert Jones1,40318.3
Liberal Democrats Jenifer Goldfinch1,26016.4
SWFCTA Ian Roberts80710.5
Green Valerie Thompson2513.3
Majority2,54733.2
Turnout 7,67159.6
Conservative win (new seat)
Springfield
PartyCandidateVotes%±%
Liberal Democrats Michael Mackrory 4,095 41.5 +13.7
Conservative John Spence3,77838.3−6.4
Labour William Horslen1,99620.2−2.7
Majority3173.2
Turnout 9,86962.5+1.8
Liberal Democrats gain from Conservative Swing +10.1
Stock
PartyCandidateVotes%±%
Conservative Paul White * 5,944 65.7 +12.7
Liberal Democrats Angela Robinson2,23224.7+9.2
Green Dawn Holmes8679.6+5.0
Majority3,71241.0+14.9
Turnout 9,04366.4+2.9
Conservative hold Swing +1.8

Colchester

District summary

PartySeats+/-Votes%+/-
Conservative 4Steady2.svg27,58037.4−1.0
Liberal Democrat 3Steady2.svg23,08931.3−0.6
Labour 2Steady2.svg16,94023.0−5.4
Green 0Steady2.svg4,8456.6+5.4
Independent 0Steady2.svg1,2631.7+1.7

Division results

Abbey division
PartyCandidateVotes%
Liberal Democrats Margaret Fisher * 3,384 42.9
Labour Scott Harris1,84623.4
Conservative David Adams1,80622.9
Green Peter Lynn85210.8
Majority1,53819.5
Turnout 7,88852.4
Liberal Democrats win (new seat)
Constable division
PartyCandidateVotes%±%
Conservative Anthony Clover * 4,943 50.1 −2.0
Liberal Democrats John Stevens2,33323.6−3.0
Labour John Wood1,92519.5−1.9
Green Roger Bamforth6736.8New
Majority2,61026.5+1.1
Turnout 9,87467.7+0.3
Conservative hold Swing +0.5
Drury division
PartyCandidateVotes%±%
Conservative Jeremy Lucas * 4,049 43.9 +2.7
Liberal Democrats Gwendoline Ilott3,03032.9−5.4
Labour David Hough1,51716.5−4.1
Green Timothy Glover6186.7New
Majority1,01911.0+8.0
Turnout 9,21467.8+2.4
Conservative hold Swing +4.0
Maypole division
PartyCandidateVotes%±%
Labour Richard Bourne * 2,226 34.8 −2.1
Liberal Democrats William Frame2,03531.8−4.3
Conservative Robert Davidson1,83728.7+1.8
Green Philippa Lane2994.7New
Majority1913.0+2.2
Turnout 6,39752.8+3.8
Labour hold Swing +1.1
Mersea and Tiptree division
PartyCandidateVotes%
Conservative Christopher Manning-Press * 4,129 44.8
Labour Audrey Spencer1,91620.8
Liberal Democrats Craig Sutton1,49116.2
Independent Jonathan Longman1,26313.7
Green Howard Mettler4284.6
Majority2,21324.0
Turnout 9,22764.5
Conservative win (new seat)
Mile End and Highwoods division
PartyCandidateVotes%
Liberal Democrats Anne Turrell * 2,646 38.1
Conservative Donald Henshall2,61937.7
Labour Richard Bingley1,28218.4
Green Mary Bryan4035.8
Majority270.4
Turnout 6,95057.6
Liberal Democrats win (new seat)
Parsons Heath and East Gates division
PartyCandidateVotes%
Liberal Democrats Theresa Higgins * 3,312 43.4
Conservative Simon Smith2,28029.9
Labour Kim Naish1,64721.6
Green Maria Iacovou3905.1
Majority1,03213.5
Turnout 7,62960.3
Liberal Democrats win (new seat)
Stanway and Pyefleet division
PartyCandidateVotes%
Conservative John Jowers 4,036 44.3
Liberal Democrats Hannah James2,73930.0
Labour John Spademan1,82520.0
Green Patience Rogers5145.6
Majority1,29714.3
Turnout 9,11465.2
Conservative win (new seat)
Wivenhoe St. Andrew division
PartyCandidateVotes%±%
Labour Julie Young * 2,756 37.1 −6.0
Liberal Democrats Jeremy Jacobs2,11928.5+1.4
Conservative Neil Stock1,88125.3−4.3
Green Christopher Fox6689.0New
Majority6378.6−4.9
Turnout 7,42450.9+1.9
Labour hold Swing −3.7

Epping Forest

District summary

PartySeats+/-Votes%+/-
Conservative 6Increase2.svg 128,51949.1+3.0
Loughton Residents 1Steady2.svg2,7344.7+0.4
Liberal Democrat 0Decrease2.svg 213,16722.7−1.8
Labour 0Steady2.svg10,17117.5−7.5
Green 0Steady2.svg1,7122.9+2.9
BNP 0Steady2.svg1,3912.4+2.4
English Democrats 0Steady2.svg3680.6+0.6

Division results

Buckhurst Hill and Loughton South
PartyCandidateVotes%
Conservative Colin Finn * 4,780 48.8
Liberal Democrats Ann Haigh *3,43835.1
Labour Paul Bostock1,58016.1
Majority1,34213.7
Turnout 9,79865.8
Conservative win (new seat)
Chigwell and Loughton Broadway
PartyCandidateVotes%
Conservative Michael Tomkins * 3,748 49.8
Labour Thomas Owen1,55120.6
Liberal Democrats Peter Spencer1,34917.9
BNP Thomas Richardson6238.3
Green Gillian Askew2553.4
Majority2,19729.2
Turnout 7,52660.3
Conservative win (new seat)
Epping and Theydon Bois
PartyCandidateVotes%
Conservative Terence Spencer 3,496 41.9
Liberal Democrats Janet Whitehouse *3,37540.4
Labour Michael Sellears8279.9
English Democrat Robin Tilbrook 3684.4
Green Korinna Willis2843.4
Majority1211.4
Turnout 8,35066.9
Conservative win (new seat)
Loughton Central
PartyCandidateVotes%
Loughton Residents Chris Pond 2,734 35.2
Conservative Matthew Hayday2,17528.0
Labour Margaret Owen1,33117.2
BNP Patricia Richardson 7689.9
Liberal Democrats Lucille Thompson4836.2
Green Jennifer Hart2693.5
Majority5597.2
Turnout 7,76061.6
Loughton Residents win (new seat)
North Weald and Nazeing
PartyCandidateVotes%±%
Conservative Anthony Jackson * 5,301 58.3 −0.9
Labour Kelvin Morris1,65418.2−8.6
Liberal Democrats Janet Hedges1,62317.9+3.9
Green Peter Goldsmith5115.6New
Majority3,64740.1+7.6
Turnout 9,08969.9+7.0
Conservative hold Swing +3.8
Ongar and Rural
PartyCandidateVotes%
Conservative Gerard McEwan * 4,397 59.6
Liberal Democrats Derek Jacobs1,72923.4
Labour Sheila Spring1,25417.0
Majority2,66836.2
Turnout 7,38067.0
Conservative win (new seat)
Waltham Abbey
PartyCandidateVotes%±%
Conservative Elizabeth Webster * 4,622 56.6 +3.4
Labour Peter Sheen1,97424.2−11.3
Liberal Democrats Patricia Brooks1,17014.3+3.0
Green Barry Johns3934.8New
Majority2,64832.5+14.8
Turnout 8,15953.2+0.4
Conservative hold Swing +7.4

Harlow

District summary

PartySeats+/-Votes%+/-
Labour 3Decrease2.svg 220,15441.4−3.5
Conservative 1Increase2.svg 118,09437.2+5.3
Liberal Democrat 0Steady2.svg8,36817.2−6.0
Green 0Steady2.svg2,0114.1+4.1

Division results

Harlow North
PartyCandidateVotes%
Labour Paul Sztumpf * 3,863 42.1
Conservative Jane Steer3,09533.8
Liberal Democrats Christopher Millington1,71618.7
Green Miles Willis4955.4
Majority7688.4
Turnout 9,16963.6
Labour win (new seat)
Harlow South East
PartyCandidateVotes%
Conservative Edward Johnson 3,552 41.5
Labour Patricia Larkin3,22437.6
Liberal Democrats Linda Pailing1,47917.3
Green Michael Gould3113.6
Majority3283.8
Turnout 8,56661.8
Conservative win (new seat)
Harlow West
PartyCandidateVotes%
Labour Anthony Durcan * 6,568 40.4
Labour Jenny Holland * 6,499
Conservative Christopher Ford5,80735.7
Conservative Joshua Jolles5,640
Liberal Democrats Robert Thurston2,69616.6
Liberal Democrats Nicholas Macy2,477
Green Robert Wight1,2057.4
Majority4.7
Turnout 56.3
Labour win (new seat)

Maldon

District summary

PartySeats+/-Votes%+/-
Conservative 3Steady2.svg15,62251.3+2.8
Labour 0Steady2.svg7,23523.8−5.1
Liberal Democrat 0Steady2.svg5,23317.2+1.0
Green 0Steady2.svg2,3517.7+1.2

Division results

Heybridge and Tollesbury
PartyCandidateVotes%
Conservative Rodney Bass * 5,305 51.4
Labour Norman Hunt2,16221.0
Liberal Democrats Gerald Townshead1,90518.5
Green Jonathan King9439.1
Majority3,14330.5
Turnout 10,31568.7
Conservative win (new seat)
Maldon
PartyCandidateVotes%±%
Conservative Brian Mead * 4,588 49.2 +2.4
Labour Michael Bentley2,46126.4−6.2
Liberal Democrats Janetta Sosin1,60317.2+3.3
Green Michael Cole6727.2+0.7
Majority2,12722.8
Turnout 9,32465.8
Conservative hold Swing
Southminster
PartyCandidateVotes%±%
Conservative Robert Boyce * 5,729 53.0 +3.6
Labour Mary Feakins2,61224.2−5.3
Liberal Democrats James Hutchon1,72516.0+1.2
Green Robert King7366.8+0.6
Majority
Turnout
Conservative hold Swing

Rochford

District summary

PartySeats+/-Votes%+/-
Conservative 5Steady2.svg20,36950.1+3.0
Labour 0Steady2.svg9,50423.4−4.0
Liberal Democrat 0Steady2.svg8,35320.5−1.8
Green 0Steady2.svg2,4636.1+6.1

Division results

Rayleigh North
PartyCandidateVotes%±%
Conservative Stephen Castle * 3,815 44.7 −3.2
Liberal Democrats Christopher Black2,90834.1+1.9
Labour Stephen Hinde1,38216.2−3.8
Green Neil Kirsh4325.1New
Majority
Turnout
Conservative hold Swing
Rayleigh South
PartyCandidateVotes%±%
Conservative Mavis Webster * 4,180 53.9 +9.2
Liberal Democrats Keith Budden1,61720.9−11.3
Labour Hilary Dyer1,57720.3+0.3
Green Peggy-Jane Smith3764.9New
Majority
Turnout
Conservative hold Swing
Rochford North
PartyCandidateVotes%±%
Conservative Tracey Chapman * 4,262 51.8 +8.7
Labour Allan Davies1,80922.0−3.1
Liberal Democrats Victor Leach1,55518.9+1.3
Green Andrew Vaughan6077.4New
Majority
Turnout
Conservative hold Swing
Rochford South
PartyCandidateVotes%±%
Conservative Roy Pearson * 3,324 46.8 −0.2
Labour Graham Fox2,46034.6−6.4
Liberal Democrats John Masek86712.2+0.2
Green Robin Hume4536.4New
Majority
Turnout
Conservative hold Swing
Rochford West
PartyCandidateVotes%±%
Conservative Elizabeth Hart * 4,788 52.8 −0.7
Labour Michael Hoy2,27625.1−4.4
Liberal Democrats Mark Pearson1,40615.5−1.6
Green Gabrielle Yeadell5956.6New
Majority
Turnout
Conservative hold Swing

Tendring

District summary

PartySeats+/-Votes%+/-
Conservative 5Steady2.svg28,40840.9+3.4
Labour 2Decrease2.svg 118,85727.2−9.4
CRP1Increase2.svg 16,0038.6+3.2
Liberal Democrat 0Steady2.svg13,07218.8−0.9
Green 0Steady2.svg3,1014.5+4.1

Division results

Brightlingsea
PartyCandidateVotes%±%
Conservative Derek Robinson * 4,157 45.1 +3.9
Labour Colin Olivier2,32725.2−4.8
Liberal Democrats Gary Scott2,25824.5−1.1
Green Nicholas Scales4785.2+2.0
Majority
Turnout
Conservative hold Swing
Clacton East
PartyCandidateVotes%±%
Conservative Pierre Oxley 4,330 51.3 +11.2
Labour Roy Raby2,42728.8−4.2
Liberal Democrats Victor Brown1,20614.3+1.4
Green Cheryl Gerrard2633.1New
Community Representative Fraser Leeks2072.5−11.5
Majority
Turnout
Conservative hold Swing
Clacton North
PartyCandidateVotes%±%
Labour Clive Baker * 2,809 39.4 +1.0
Conservative Paul Honeywood2,20030.8+0.9
Liberal Democrats Harold Shearing1,74624.5−7.1
Community Representative Kevin Watson2042.9New
Green Patricia Brunton1742.4New
Majority
Turnout
Labour hold Swing
Clacton West
PartyCandidateVotes%±%
Community Representative Roy Smith * 2,109 30.8 New
Conservative Christopher Griffiths1,98829.1+0.2
Labour Maurice Alexander1,86327.2−33.6
Liberal Democrats Susan Shearing74710.9+0.6
Green Rachel Brunton1362.0New
Majority
Turnout
Community Representative gain from Labour Swing
Frinton and Walton
PartyCandidateVotes%±%
Conservative Michael Page 6,112 56.8 +1.2
Labour Richard Hebborn2,63324.5−3.8
Liberal Democrats Charles Harrison1,65815.4−0.7
Green Walter Schwartz3583.3New
Majority
Turnout
Conservative hold Swing
Harwich
PartyCandidateVotes%±%
Labour Leslie Double * 3,847 42.3 −2.8
Community Representative Steven Henderson2,84731.3+6.3
Conservative Denzil Watson1,88720.7−0.3
Green Ketherine Bamforth5195.7New
Majority
Turnout
Labour hold Swing
Tendring Rural East
PartyCandidateVotes%±%
Conservative Mark Cossens 3,805 40.5 +0.2
Labour Lawrence Payne2,95131.4−0.5
Liberal Democrats Robert Bevan2,14222.8+0.7
Green Samuel Elliott2893.1New
Community Representative John Brown2082.2-3.6
Majority
Turnout
Conservative hold Swing
Tendring Rural West
PartyCandidateVotes%±%
Conservative Sarah Candy * 3,929 45.9 +7.3
Liberal Democrats Ann Elvin3,31538.7+7.2
Green Michael Mealing88410.3New
Community Representative David Smy4285.0New
Majority
Turnout
Conservative hold Swing

Uttlesford

District summary

PartySeats+/-Votes%+/-
Conservative 4Steady2.svg18,09548.3+0.4
Liberal Democrat 0Steady2.svg12,72434.0+1.7
Labour 0Steady2.svg3,5879.6−8.8
Green 0Steady2.svg2,5826.9+5.5
UKIP 0Steady2.svg4621.2+1.2

Division results

Dunmow
PartyCandidateVotes%±%
Conservative Susan Flack * 5,498 55.8
Liberal Democrats Richard Harris3,52035.7
Green Michael Earley8428.5
Majority
Turnout
Conservative hold Swing
Saffron Walden
PartyCandidateVotes%±%
Conservative Robert Chambers * 4,299 41.9
Liberal Democrats Joan Dawson3,23731.5
Labour Simon Trimnell1,57015.3
Green Trilby Roberts7006.8
UKIP Raymond Tyler4624.5
Majority
Turnout
Conservative hold Swing
Stansted
PartyCandidateVotes%±%
Conservative Raymond Gooding 3,932 43.6
Liberal Democrats Peter Wilcock3,77941.9
Labour Betty McGregor90410.0
Green Sanjukta Ghosh4114.6
Majority
Turnout
Conservative hold Swing
Thaxted
PartyCandidateVotes%±%
Conservative Simon Walsh 4,366 52.6
Liberal Democrats Robert Wingard2,18826.4
Labour Yvonne Morton1,11313.4
Green Susan Halsted6297.6
Majority
Turnout
Conservative hold Swing

By-elections

Brentwood Rural

Brentwood Rural: 13 July 2006 [3]
PartyCandidateVotes%±%
Conservative 2,062 61.5 +11.8
Liberal Democrats 1,15034.3+2.3
Labour 1424.2–4.5
Majority91227.2+9.5
Turnout 3,354
Conservative hold Swing Increase2.svg4.8

No UKIP (6.4%) or Green (3.1%) candidates as previous.

Related Research Articles

Guildford Borough Council in Surrey, England is elected every four years.

Hertfordshire County Council in England is elected every four years. Since the last boundary changes, that took effect for the 2001 election, 77 councillors are elected for single member districts.

<span class="mw-page-title-main">Essex County Council</span> English principal local authority in the East of England

Essex County Council is the county council that governs the non-metropolitan county of Essex in England. It has 75 councillors, elected from 70 divisions, and is currently controlled by the Conservative Party. The council meets at County Hall in the centre of Chelmsford. It is a member of the East of England Local Government Association.

<span class="mw-page-title-main">2005 Suffolk County Council election</span>

Elections to Suffolk County Council were held on 5 May 2005. The whole council was up for election with boundary changes since the last election in 2001 reducing the number of seats by 5. The Conservative Party gained control of the council from no overall control.

<span class="mw-page-title-main">2009 Suffolk County Council election</span>

Elections to Suffolk County Council were held on 4 June 2009 as part of the 2009 United Kingdom local elections on the same day as the elections to the European Parliament. 75 councillors were elected from 63 electoral divisions, which returned either one or two county councillors each by first-past-the-post voting for a four-year term of office. The electoral divisions were the same as those used at the previous election in 2005.

<span class="mw-page-title-main">2009 Essex County Council election</span>

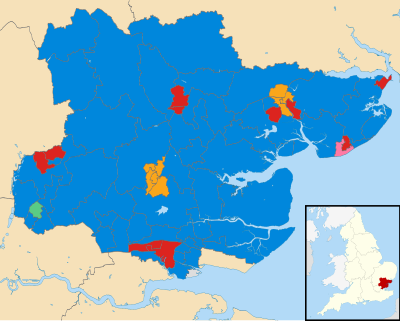
An election to Essex County Council took place on 4 June 2009 as part of the 2009 United Kingdom local elections. The elections had been delayed from 7 May, to coincide with elections to the European Parliament. 75 councillors were elected from various electoral divisions, which returned either one or two county councillors each by first-past-the-post voting for a four-year term of office. The electoral divisions were the same as those used at the previous election in 2005.

<span class="mw-page-title-main">2013 Norfolk County Council election</span>

The Norfolk County Council election took place across Norfolk on 2 May 2013, coinciding with local elections for all county councils in England. The results were announced the following day, Friday 3 May 2013. The result brought to an end 12 years of Conservative administration, who finished three seats short of a majority after losing 20 seats, leaving the Council in no overall control (NOC). UKIP and the Labour Party both made gains of 14 and 11 seats respectively. The Liberal Democrats and the Green Party both lost three seats each, whilst an independent won a single seat in North Norfolk.

<span class="mw-page-title-main">2013 Cambridgeshire County Council election</span>

An election to Cambridgeshire County Council took place on 2 May 2013 as part of the 2013 United Kingdom local elections. 69 councillors were elected from 60 electoral divisions, which returned either one or two county councillors each by first-past-the-post voting for a four-year term of office. The electoral divisions were the same as those used at the previous election in 2009. No elections were held in Peterborough, which is a unitary authority outside the area covered by the County Council. The election saw the Conservative Party lose overall control of the council.
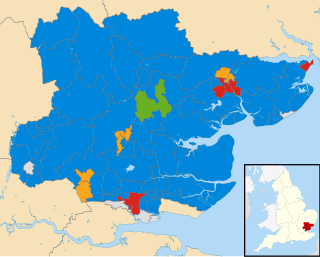
<span class="mw-page-title-main">2013 Essex County Council election</span>

An election to Essex County Council took place on 2 May 2013 as part of the 2013 United Kingdom local elections. 75 councillors were elected from 70 electoral divisions, which returned either one or two county councillors each by first-past-the-post voting for a four-year term of office. The electoral divisions were the same as those used at the previous election in 2009. No elections were held in Thurrock or Southend-on-Sea, which are unitary authorities outside the area covered by the County Council.

<span class="mw-page-title-main">2003 Colchester Borough Council election</span>

The 2003 Colchester Borough Council election took place on 1 May 2003 to elect members of Colchester Borough Council in Essex, England. This was the same day as the other 2003 United Kingdom local elections. One third of the seats were up for election and the council stayed under no overall control.

<span class="mw-page-title-main">2013 Suffolk County Council election</span>

Elections to Suffolk County Council took place on 2 May 2013 as part of the 2013 United Kingdom local elections. 75 councillors were elected from 63 electoral divisions, which returned either one or two county councillors each by first-past-the-post voting for a four-year term of office. The electoral divisions were the same as those used at the previous election in 2009.

<span class="mw-page-title-main">2004 Colchester Borough Council election</span>

The 2004 Colchester Borough Council election took place on 10 June 2004 to elect members of Colchester Borough Council in Essex, England. This was the same day as the other 2004 United Kingdom local elections and as the 2004 European Parliament Elections. One third of the seats were up for election and the council stayed under no overall control.

An election to Essex County Council took place on 7 June 2001 as part of the 2001 United Kingdom local elections. 79 councillors were elected from various electoral divisions, which returned either one or two county councillors each by first-past-the-post voting for a four-year term of office. The electoral divisions were the same as those used at the previous election in 1997.

An election to Essex County Council took place on 1 May 1997 as part of the 1997 United Kingdom local elections. 79 councillors were elected from various electoral divisions, which returned either one or two county councillors each by first-past-the-post voting for a four-year term of office. With the creation of Southend-on-Sea Borough Council and Thurrock Council in 1998 the number of seats contested at this election was reduced by 19. In 1993 the breakdown of these seats were, Lab 9 Con 5 LD 5.

<span class="mw-page-title-main">2011 Harlow District Council election</span>

The 2011 Harlow District Council election took place on 5 May 2011 to elect members of Harlow District Council in Essex, England. One third of the council was up for election and the Conservative Party stayed in overall control of the council.

<span class="mw-page-title-main">2017 Essex County Council election</span>

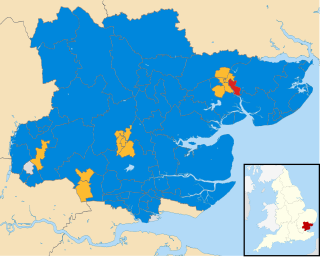
Elections to Essex County Council took place on 4 May 2017 as part of the 2017 local elections. All 75 councillors were elected from 70 electoral divisions, which each returned either one or two councillors by first-past-the-post voting for a four-year term of office.

<span class="mw-page-title-main">2017 Norfolk County Council election</span>

The 2017 Norfolk County Council election took place on 4 May 2017 as part of the 2017 local elections in the United Kingdom.

<span class="mw-page-title-main">2017 Suffolk County Council election</span>

The 2017 Suffolk County Council election took place on 4 May 2017 as part of the 2017 local elections in the United Kingdom. All 75 councillors were elected from 63 electoral divisions, which returned either one or two county councillors each, by first-past-the-post voting, for a four-year term of office.

<span class="mw-page-title-main">2021 Cambridgeshire County Council election</span>

The 2021 Cambridgeshire County Council election took place on 6 May 2021 as part of the 2021 local elections in the United Kingdom. All 61 councillors were elected from 59 electoral divisions, which returned either one or two county councillors each by first-past-the-post voting for a four-year term of office. The election was held alongside a full election for Cambridge City Council, the Cambridgeshire Police and Crime Commissioner, Mayor of Cambridgeshire and Peterborough and one-third of Peterborough City Council.

<span class="mw-page-title-main">2021 Essex County Council election</span>

Elections to Essex County Council took place on 6 May 2021 as part of the 2021 United Kingdom local elections. All 75 councillors were elected from 70 electoral divisions, with each returning either one or two councillors by first-past-the-post voting for a four-year term of office.

References

  1. "Essex" . Retrieved 28 January 2014.
  2. "Elections". Archived from the original on 2 February 2014. Retrieved 28 January 2014.
  3. "Brentwood Rural Division - Essex". Andrew Teale. Local Elections Archive Project. Retrieved 11 January 2023.