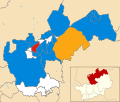
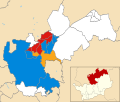
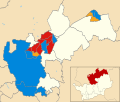
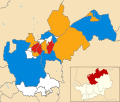
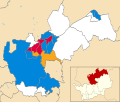
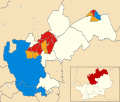
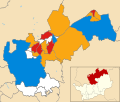
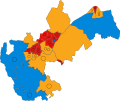
One third of North Hertfordshire District Council in England is elected each year, followed by one year without election. A boundary review is underway to allow the council to instead be elected all at once every four years from 2024 onwards. [1]
The elections have been as follows: [2] [3]
Year | Seats | Conservative | Labour | Liberal Democrats [a] | Ratepayers | Independent | Notes |
---|---|---|---|---|---|---|---|
1973 | 48 | 23 | 17 | 0 | 1 | 7 | |
1976 | 48 | 30 | 11 | 0 | 2 | 5 | |
1979 | 50 | 34 | 12 | 0 | 2 | 2 | New ward boundaries. [4] |
1980 | 50 | 32 | 14 | 0 | 2 | 2 | |
1982 | 50 | 32 | 14 | 0 | 2 | 2 | |
1983 | 50 | 30 | 15 | 1 | 2 | 2 | |
1984 | 50 | 31 | 12 | 2 | 3 | 2 | |
1986 | 50 | 26 | 14 | 7 | 3 | 0 | |
1987 | 50 | 26 | 13 | 8 | 3 | 0 | |
1988 | 50 | 27 | 13 | 7 | 3 | 0 | |
1990 | 50 | 29 | 15 | 3 | 3 | 0 | District boundary changes took place but the number of seats remained the same. [5] [6] |
1991 | 50 | 26 | 18 | 2 | 3 | 1 | |
1992 | 50 | 26 | 17 | 3 | 3 | 1 | |
1994 | 50 | 25 | 18 | 5 | 1 | 1 | |
1995 | 50 | 22 | 21 | 6 | 0 | 1 | |
1996 | 50 | 16 | 26 | 7 | 0 | 1 | |
1998 | 50 | 17 | 26 | 6 | 0 | 1 | |
1999 | 49 | 28 | 18 | 3 | 0 | 0 | New ward boundaries. [7] |
2000 | 49 | 29 | 18 | 2 | 0 | 0 | |
2002 | 49 | 28 | 17 | 4 | 0 | 0 | |
2003 | 49 | 27 | 16 | 6 | 0 | 0 | |
2004 | 49 | 28 | 14 | 7 | 0 | 0 | |
2006 | 49 | 33 | 9 | 7 | 0 | 0 | |
2007 | 49 | 30 | 10 | 9 | 0 | 0 | New ward boundaries. [8] |
2008 | 49 | 32 | 8 | 9 | 0 | 0 | |
2010 | 49 | 33 | 7 | 9 | 0 | 0 | |
2011 | 49 | 34 | 7 | 8 | 0 | 0 | |
2012 | 49 | 33 | 10 | 6 | 0 | 0 | |
2014 | 49 | 34 | 12 | 3 | 0 | 0 | |
2015 | 49 | 36 | 11 | 2 | 0 | 0 | |
2016 | 49 | 34 | 12 | 3 | 0 | 0 | |
2018 | 49 | 29 | 14 | 6 | 0 | 0 | |
2019 | 49 | 22 | 16 | 11 | 0 | 0 | |
2021 | 49 | 23 | 15 | 11 | 0 | 0 | |
2022 | 49 | 19 | 17 | 13 | 0 | 0 | |
2023 | 49 | 15 | 19 | 15 | 0 | 0 | |
2024 | 51 | 7 | 25 | 19 | 0 | 0 | New ward boundaries. [9] |
Party | Candidate | Votes | % | ±% | |
---|---|---|---|---|---|
Liberal Democrats | Marilyn Kirkland [11] | 331 | 48.3 | −4.7 | |
Conservative | 324 | 47.2 | +0.2 | ||
Labour | 31 | 4.5 | +4.5 | ||
Majority | 7 | 1.0 | |||
Turnout | 686 | ||||
Liberal Democrats hold | Swing |
Party | Candidate | Votes | % | ±% | |
---|---|---|---|---|---|
Conservative | Faye Barnard | 774 | 56.8 | −7.4 | |
UKIP | Peter Robbins | 217 | 15.9 | +15.9 | |
Labour | Jackie McDonald | 189 | 13.9 | −3.1 | |
Liberal Democrats | Peter Johnson | 110 | 8.1 | +0.4 | |
Green | George Howe | 72 | 5.3 | −5.8 | |
Majority | 557 | 40.9 | |||
Turnout | 1,362 | ||||
Conservative hold | Swing |
Party | Candidate | Votes | % | ±% | |
---|---|---|---|---|---|
Conservative | Julian Cunningham | 761 | 51.3 | −2.7 | |
Labour | Martin Stears-Handscomb | 399 | 26.9 | +7.1 | |
UKIP | John Barry | 184 | 12.4 | +12.4 | |
Liberal Democrats | Margaret Higbid | 88 | 5.9 | −7.6 | |
Green | Mario May | 51 | 3.4 | −9.3 | |
Majority | 362 | 24.4 | |||
Turnout | 1,483 | ||||
Conservative hold | Swing |
Party | Candidate | Votes | % | ±% | |
---|---|---|---|---|---|
Labour | Frank Radcliffe | 361 | 48.0 | −12.8 | |
Conservative | Mara MacSeoinin | 180 | 23.9 | −0.7 | |
UKIP | Peter Croft | 148 | 19.7 | +19.7 | |
Green | Jacqueline Greatorex | 32 | 4.3 | −5.5 | |
Liberal Democrats | Clare Body | 31 | 4.1 | −0.7 | |
Majority | 181 | 24.1 | |||
Turnout | 752 | ||||
Labour hold | Swing |
Party | Candidate | Votes | % | ±% | |
---|---|---|---|---|---|
Labour | Martin Stears-Handscomb | 258 | 31.9 | −17.4 | |
Independent | Jackie McDonald | 200 | 24.8 | +24.8 | |
Conservative | Serena Farrow | 158 | 19.6 | −12.4 | |
Liberal Democrats | Louise Peace | 150 | 18.6 | +9.9 | |
Green | George Howe | 42 | 5.2 | −4.8 | |
Majority | 58 | 7.2 | |||
Turnout | 808 | ||||
Labour hold | Swing |
Party | Candidate | Votes | % | ±% | |
---|---|---|---|---|---|
Conservative | Raymond Shakespeare-Smith | 717 | 41.7 | −2.6 | |
Liberal Democrats | John Hefford | 394 | 22.9 | +12.3 | |
Independent | Jacqueline McDonald | 277 | 16.1 | +6.1 | |
Labour | Dave Winstanley | 219 | 12.7 | −5.5 | |
Green | Des Stephens | 114 | 6.6 | −2.6 | |
Majority | 323 | 7.2 | |||
Turnout | 1,721 | ||||
Conservative hold | Swing |
Party | Candidate | Votes | % | ±% | |
---|---|---|---|---|---|
Conservative | Sarah Dingley | 844 | 50.4 | −0.6 | |
Liberal Democrats | Carol Stanier | 470 | 28.1 | +14.7 | |
Labour | Vaughan West | 196 | 11.7 | −4.6 | |
Green | Katherine Shann | 97 | 5.8 | −1.3 | |
UKIP | Christopher Arquati | 68 | 4.1 | −8.0 | |
Majority | 374 | 22.3 | |||
Turnout | 1,675 | ||||
Conservative hold | Swing |
Party | Candidate | Votes | % | ±% | |
---|---|---|---|---|---|
Liberal Democrats | Raj Bhakar | 1,238 | 67.0 | +18.6 | |
Conservative | Samuel Forsyth | 450 | 24.3 | −3.8 | |
Green | Deolinda Eltringham | 134 | 7.2 | −1.1 | |
CPA | Leigh Smith | 27 | 1.5 | +0.4 | |
Majority | 788 | 42.6 | |||
Turnout | 1,849 | ||||
Liberal Democrats hold | Swing |
Party | Candidate | Votes | % | ±% | |
---|---|---|---|---|---|
Labour | Sarah Lucas | 302 | 25.9 | ||
Liberal Democrats | Gill Lewis | 298 | 25.6 | ||
Conservative | Callum Bartram-Bell | 280 | 24.1 | ||
Reform UK | John Froggett | 196 | 16.8 | ||
Green | Peter Wilkin | 88 | 7.6 | ||
Majority | 4 | 0.3 | |||
Turnout | 1,164 | ||||
Labour hold | Swing |
Rugby Borough Council elections are held three years out of every four, with a third of the council elected each time. Rugby Borough Council is the local authority for the non-metropolitan district of Rugby in Warwickshire, England. Since the last boundary changes in 2012, 42 councillors have been elected from 16 wards.
Aylesbury Vale District Council was the council for the non-metropolitan district of Aylesbury Vale in Buckinghamshire, England, which existed as a local government area from 1974 to 2020. The council was elected every four years from 1973 until 2020. At the time of its abolition, the council had 59 councillors, elected from 33 wards.
Chichester District Council in West Sussex, England is elected every four years. Since the last boundary changes in 2019, 36 councillors have been elected from 21 wards.
Newark and Sherwood District Council elections are held every four years. Newark and Sherwood District Council is the local authority for the non-metropolitan district of Newark and Sherwood in Nottinghamshire, England. Since the last boundary changes in 2015, 39 councillors have been elected from 21 wards.
Warwick District Council elections are held every four years. Warwick District Council is the local authority for the non-metropolitan district of Warwick in Warwickshire, England. Since the last boundary changes in 2019, 44 councillors have been elected from 17 wards.
West Lancashire Borough Council elections are generally held three years out of every four, with a third of the council elected each time. West Lancashire Borough Council is the local authority for the non-metropolitan district of West Lancashire in Lancashire, England. Since the last boundary changes in 2023 the council has comprised 45 councillors representing 15 wards, with each ward electing three councillors.
East Hampshire District Council elections are held every four years to elect councillors to East Hampshire District Council in Hampshire, England. Since the last boundary changes in 2019 the council has comprised 43 councillors representing 31 wards, with each ward electing one, two or three councillors.
Uttlesford District Council is elected every four years.
Watford Borough Council elections are held three years out of every four, to elect members of Watford Borough Council in Hertfordshire, England. A third of the council is elected each time. Since the last boundary changes in 2016 the council has comprised 36 councillors representing 12 wards, each of which elects three councillors. In addition to the 36 councillors Watford also has a directly-elected mayor. Elections to Hertfordshire County Council are held in the fourth year of the cycle when there are no borough council elections.
Hertfordshire County Council in England is elected every four years. Since the last boundary changes took effect in 2017 there have been 78 electoral divisions electing one councillor each.
East Hertfordshire District Council is elected every four years.
New Forest District Council elections are held every four years to elect members of New Forest District Council in Hampshire, England. Since the last boundary changes in 2023 the council has comprised 48 councillors representing 26 wards, with each ward electing one, two or three councillors.
Warrington Borough Council elections are held every four years. Warrington Borough Council is the local authority for the unitary authority of Warrington in Cheshire, England. Since the last boundary changes in 2016, 58 councillors have been elected from 22 wards.
Three Rivers District Council elections are held three years out of four to elect members of Three Rivers District Council in Hertfordshire, England. Since the last boundary changes in 2014 the council has comprised 39 councillors representing 13 wards, each of which elects three councillors, one at each election such that a third of the council is elected each time. Elections to Hertfordshire County Council are held in the fourth year of the cycle when there are no district council elections.
One third of Welwyn Hatfield Borough Council in Hertfordshire, England is elected each year, followed by one year without election. Since the last boundary changes in 2016 the council has comprised 48 councillors representing 16 wards, each of which elects three councillors.
Shropshire Council elections are held every four years, and since 2009 74 councillors have been elected from 63 electoral divisions.
Hertsmere Borough Council elections are held every four years to elect members of Hertsmere Borough Council in Hertfordshire, England. Since the last boundary changes in 2019, the council comprises 39 councillors elected from 16 wards.
Luton Borough Council is the local authority for the unitary authority of Luton in Bedfordshire, England. Until 1 April 1997 it was a non-metropolitan district.
Tewkesbury Borough Council is the local authority for the Borough of Tewkesbury in Gloucestershire, England. The whole council is elected together every four years. Since the last boundary changes in 2019, a total of 38 councillors have been elected from 20 wards.
Nottingham City Council elections are held every four years. Nottingham City Council is the local authority for the unitary authority of Nottingham in Nottinghamshire, England. Until 1 April 1998 it was a non-metropolitan district. Since the last boundary changes in 2019, 55 councillors are elected from 20 wards.