1980 St Albans City and District Council election

Last updated

The 1980 St Albans City and District Council election took place on 1 May 1980 to elect members of St Albans City and District Council in England. [1] This was on the same day as other local elections.

Contents

Summary

1980 St Albans City and District Council election
PartyThis electionFull councilThis election
SeatsNetSeats %OtherTotalTotal %VotesVotes %+/−
  Conservative 13Decrease2.svg 659.1243764.921,51849.6–7.6
  Labour 5Increase2.svg 322.761119.311,65326.9+0.5
  Liberal 4Increase2.svg 313.6158.88,29819.1+7.4
  Independent 1Steady2.svg4.5235.31,8924.4+0.9
  Ind. Conservative 0Steady2.svg0.0111.8N/AN/A–1.2

Ward results

Ashley

Ashley
PartyCandidateVotes%±%
Liberal B. Rigby 1,104 49.0
Conservative S. Davies*73132.4
Labour R. Protz41918.6
Majority37316.5
Turnout 2,25447.5
Registered electors 4,750
Liberal gain from Conservative Swing

Batchwood

Batchwood
PartyCandidateVotes%±%
Labour D. Ramsden 889 46.6
Conservative B. Eyles*62332.7
Liberal L. Coates39520.7
Majority26613.9
Turnout 1,90739.5
Registered electors 4,827
Labour gain from Conservative Swing

Clarence

Clarence
PartyCandidateVotes%±%
Conservative R. Wheeldon* 1,092 54.0
Labour A. Kirby50725.1
Liberal J. Mason42421.0
Majority58528.9
Turnout 2,02346.8
Registered electors 4,319
Conservative hold Swing

Colney Heath

There is an error for this election result in the source material where the result from London Colney is duplicated in the place of Colney Heath's result. The outcome of the election was a Liberal hold.

Cunningham

Cunningham
PartyCandidateVotes%±%
Liberal R. Donald 842 37.3
Conservative A. Hill*73632.6
Labour J. Brown67730.0
Majority1064.7
Turnout 2,25547.3
Registered electors 4,772
Liberal gain from Conservative Swing

Harpenden East

Harpenden East (2 seats due to by-election)
PartyCandidateVotes%
Conservative M. Morrell* 1,150 52.0
Conservative D. Lloyd 1,127 51.0
Labour C. Mathews53424.2
Liberal C. Clark52723.8
Labour R. Collins49822.5
Turnout 2,21143.8
Registered electors 5,049
Conservative hold
Conservative hold

Harpenden North

Harpenden North
PartyCandidateVotes%±%
Conservative K. Wood* 1,331 59.0
Labour H. Holmes51522.8
Liberal D. Collins41018.2
Majority81636.2
Turnout 2,25639.4
Registered electors 5,721
Conservative hold Swing

Harpenden South

Harpenden South (2 seats due to by-election)
PartyCandidateVotes%
Conservative K. Jenkins* 1,358 57.4
Conservative K. Nash 1,167 49.4
Independent L. Freitag41817.7
Liberal P. De Fraitas36515.4
Labour K. Griffin2219.3
Labour J. Ryan1817.7
Turnout 2,36448.0
Registered electors 4,924
Conservative hold
Conservative hold

Harpenden West

Harpenden West
PartyCandidateVotes%±%
Conservative T. Tarry* 1,466 69.9
Liberal T. Woodhead43220.6
Labour J. McKrell1999.5
Majority1,03449.3
Turnout 2,09740.9
Registered electors 5,123
Conservative hold Swing

London Colney

London Colney
PartyCandidateVotes%±%
Labour M. Macmillan 1,185 60.0
Conservative J. Smee*78940.0
Majority39620.0
Turnout 1,97471.9
Registered electors 2,744
Labour gain from Conservative Swing

Marshallwick North

Marshallwick North
PartyCandidateVotes%±%
Conservative M. Pattison 936 51.6
Liberal G. Churchard45124.9
Labour P. Landman42723.5
Majority48526.7
Turnout 1,81440.8
Registered electors 4,451
Conservative hold Swing

Marshallwick South

Marshallwick South
PartyCandidateVotes%±%
Conservative J. Turner* 1,173 52.7
Liberal H. Lowe69731.3
Labour D. Allan35616.0
Majority47621.4
Turnout 2,22644.2
Registered electors 5,033
Conservative hold Swing

Park Street

Park Street
PartyCandidateVotes%
Liberal J. Griffin 662 39.9
Conservative D. Allen 633 38.2
Conservative K. Hill63238.1
Liberal J. Allen57334.5
Labour D. Goodchild36522.0
Labour R. Fricker29117.5
Turnout 1,65939.0
Registered electors 4,254
Liberal gain from Conservative
Conservative hold

Redbourn

Redbourn
PartyCandidateVotes%±%
Independent S. Bailey 875 56.0
Conservative S. Russell*68844.0
Majority18712.0
Turnout 1,56334.9
Registered electors 4,483
Independent gain from Conservative Swing

Sopwell

Sopwell
PartyCandidateVotes%±%
Labour D. Carr* 1,058 58.4
Conservative K. Davies53829.7
Liberal G. Woollatt21712.0
Majority52028.7
Turnout 1,81339.5
Registered electors 4,585
Labour hold Swing

St. Peters

St. Peters
PartyCandidateVotes%±%
Labour P. Fowler 663 35.6
Conservative E. Banbury48926.3
Independent R. Rayment*39121.0
Liberal P. Thompson31717.0
Majority1749.4
Turnout 1,86040.5
Registered electors 4,590
Labour gain from Independent Swing

St. Stephens

St. Stephens
PartyCandidateVotes%±%
Conservative A. Nowell* 1,335 57.6
Labour K. Morcom55524.0
Liberal M. Barron42618.4
Majority78033.7
Turnout 2,31641.2
Registered electors 5,617
Conservative hold Swing

Verulam

Verulam
PartyCandidateVotes%±%
Conservative E. Hewitt* 1,549 72.4
Labour D. Partridge59027.6
Majority95944.8
Turnout 2,13941.6
Registered electors 5,140
Conservative hold Swing

Wheathampstead

Wheathampstead
PartyCandidateVotes%±%
Conservative D. Evans 1,186 54.2
Liberal N. Clements45620.8
Labour A. Latchford33815.4
Independent S. Whittaker2089.5
Majority73033.4
Turnout 2,18847.6
Registered electors 4,600
Conservative hold Swing

Related Research Articles

<span class="mw-page-title-main">St Albans</span> City in southern Hertfordshire, England

St Albans is a cathedral city in Hertfordshire, England, east of Hemel Hempstead and west of Hatfield, 20 miles (32 km) north-west of London, 8 miles (13 km) south-west of Welwyn Garden City and 11 miles (18 km) south-east of Luton. St Albans was the first major town on the old Roman road of Watling Street for travellers heading north and became the city of Verulamium. It is within the London commuter belt and the Greater London Built-up Area.

<span class="mw-page-title-main">St Albans City and District</span> Local authority district in England

The City and District of St Albans is a local government district with city status in Hertfordshire, England. Its council is based in St Albans, the largest settlement in the district. The district also includes the town of Harpenden and several villages. The district borders North Hertfordshire, Welwyn Hatfield, Hertsmere, Watford, Three Rivers, Dacorum, and Central Bedfordshire.

<span class="mw-page-title-main">London Colney</span> Village in Hertfordshire, England

London Colney is a village and civil parish in Hertfordshire, England. It is located to the north of London, close to Junction 22 of the M25 motorway.

<span class="mw-page-title-main">St Albans (UK Parliament constituency)</span> Parliamentary constituency in the United Kingdom, 1801-1852 & 1885 onwards

St Stephen is a civil parish in the St Albans City and District in Hertfordshire, England. It is located approximately 17 miles (27 km) north-northwest of central London, straddling the M25 motorway and immediately adjacent to the southern boundary of St Albans. St Stephen is a partly urbanised parish with multiple centres of activity and open land that forms part of the Metropolitan Green Belt. The local council is St Stephen Parish Council. The parish covers Bricket Wood, Chiswell Green, Frogmore, Colney Street, How Wood and Park Street. It is an ancient parish, and sections of it were transferred to St Albans progressively up to 1935. At the 2011 census it had a population of 13,865.

<span class="mw-page-title-main">South Hertfordshire (UK Parliament constituency)</span> Parliamentary constituency in the United Kingdom, 1974–1983

South Hertfordshire was a constituency in Hertfordshire which returned one Member of Parliament (MP) to the House of Commons of the Parliament of the United Kingdom. It was created for the February 1974 general election and abolished for the 1983 general election when it was mainly replaced by the new Hertsmere constituency.

St Albans City and District Council elections are held three years out of every four to elect members of St Albans City and District Council in Hertfordshire, England. Since the last boundary changes in 2022 the council has comprised 56 councillors, with the district being divided into 20 wards. Elections to Hertfordshire County Council are held in the fourth year of the cycle when there are no district council elections.

<span class="mw-page-title-main">2008 St Albans City and District Council election</span>

The 2008 St Albans City and District Council election took place on 1 May 2008 to elect members of St Albans District Council in Hertfordshire, England. One third of the council was up for election and the Liberal Democrats gained overall control of the council from no overall control.

<span class="mw-page-title-main">2002 St Albans City and District Council election</span>

The 2002 St Albans City and District Council election took place on 2 May 2002 to elect members of St Albans District Council in Hertfordshire, England. One third of the council was up for election and the council stayed under no overall control.

<span class="mw-page-title-main">2004 St Albans City and District Council election</span>

The 2004 St Albans City and District Council election took place on 10 June 2004 to elect members of St Albans District Council in Hertfordshire, England. One third of the council was up for election and the council stayed under no overall control.

<span class="mw-page-title-main">2007 St Albans City and District Council election</span>

The 2007 St Albans City and District Council election took place on 3 May 2007 to elect members of St Albans District Council in Hertfordshire, England. One third of the council was up for election and the Liberal Democrats lost overall control of the council to no overall control.

<span class="mw-page-title-main">2010 St Albans City and District Council election</span>

The 2010 St Albans City and District Council election took place on 6 May 2010 to elect members of St Albans District Council in Hertfordshire, England. One third of the council was up for election and the Liberal Democrats stayed in overall control of the council.

<span class="mw-page-title-main">2012 St Albans City and District Council election</span>

The 2012 St Albans City and District Council election took place on 3 May 2012 to elect members of St Albans District Council in Hertfordshire, England. One third of the council was up for election and the council stayed under no overall control.

<span class="mw-page-title-main">2011 St Albans City and District Council election</span>

The 2011 St Albans City and District Council election took place on 5 May 2011 to elect members of St Albans District Council in Hertfordshire, England. One third of the council was up for election and the Liberal Democrats lost overall control of the council to no overall control.

<span class="mw-page-title-main">2014 St Albans City and District Council election</span>

The 2014 St Albans City and District Council election took place on 22 May 2014 to elect members of St Albans District Council in Hertfordshire, England. One third of the council was up for election and the council stayed under no overall control.

<span class="mw-page-title-main">2015 St Albans City and District Council election</span>

The 2015 St Albans City and District Council election took place on 7 May 2015 to elect members of St Albans City and District Council in England. This was on the same day as other local elections.

<span class="mw-page-title-main">2019 St Albans City and District Council election</span> Election

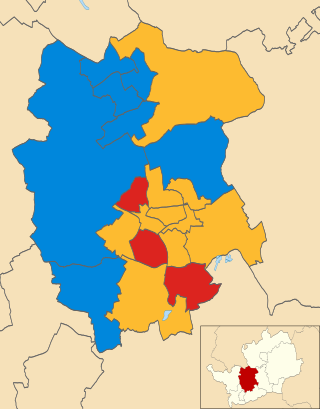
The 2019 St Albans City and District Council election took place on 2 May 2019 to elect members of St Albans City and District Council in England. This was on the same day as other local elections. At the elections, the Conservatives lost control of the council

<span class="mw-page-title-main">2021 Hertfordshire County Council election</span>

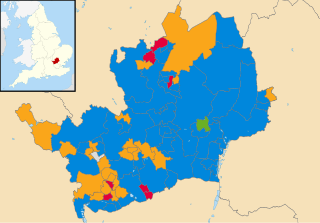
Elections to Hertfordshire County Council took place on 6 May 2021 alongside other local elections in the United Kingdom. All 78 seats to the council were elected.

<span class="mw-page-title-main">2021 St Albans City and District Council election</span> Election

The 2021 St Albans City and District Council election took place on 6 May 2021, delayed by one year due to the COVID-19 pandemic, to elect members of St Albans City and District Council in England. This was on the same day as other local elections. At the elections, the Liberal Democrats achieved a majority for the first time since 2011 and took the council back from no overall control.

References

  1. "Results 1973 to 2011" (PDF). Colin Rallings and Michael Thrasher. The Elections Centre, Plymouth University . Retrieved 22 January 2023.