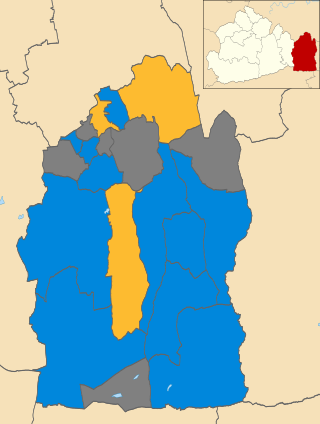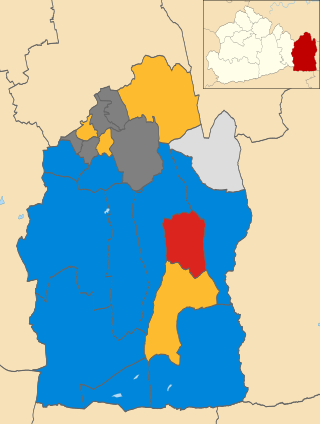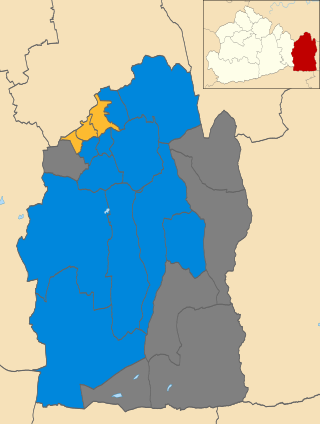
The 2022 Tandridge District Council election took place on 5 May 2022 to elect members of Tandridge District Council in Surrey, England. One third of the council was up for election and the council remained in no overall control.

The 2022 Tandridge District Council election took place on 5 May 2022 to elect members of Tandridge District Council in Surrey, England. One third of the council was up for election and the council remained in no overall control.
| Party | Seats | Gains | Losses | Net gain/loss | Seats % | Votes % | Votes | +/− | |
|---|---|---|---|---|---|---|---|---|---|
| Liberal Democrats | 5 | 1 | 0 | 35.7 | 21.1 | 4,106 | |||
| Independent | 5 | 2 | 0 | 35.7 | 21.1 | 4,096 | |||
| Residents | 3 | 0 | 0 | 21.4 | 18.7 | 3,629 | |||
| Conservative | 1 | 0 | 3 | 7.1 | 29.5 | 5,735 | |||
| Labour | 0 | 0 | 0 | 0.0 | 8.5 | 1,643 | |||
| Green | 0 | 0 | 0 | 0.0 | 1.1 | 210 | New | ||
| Party | Candidate | Votes | % | ±% | |
|---|---|---|---|---|---|
| Independent | Chris Pinard | 712 | 40.9 | New | |
| Conservative | Ian Borman | 507 | 29.1 | ||
| Liberal Democrats | Richard Fowler | 258 | 14.8 | ||
| Labour | Linda Baharier | 150 | 8.6 | ||
| Green | Jack Baart | 115 | 6.6 | New | |
| Majority | 205 | 11.8 | N/A | ||
| Turnout | 1,742 | 38.9 | |||
| Independent gain from Conservative | Swing | ||||
| Party | Candidate | Votes | % | ±% | |
|---|---|---|---|---|---|
| Independent | Sue Farr | 722 | 48.1 | New | |
| Conservative | Charlie Pilkington | 459 | 30.6 | ||
| Labour | Stephen Case-Green | 156 | 10.4 | ||
| Green | Elliott de Boer | 95 | 6.3 | New | |
| Liberal Democrats | Sam Howson | 70 | 4.7 | ||
| Majority | 263 | 17.5 | N/A | ||
| Turnout | 1,510 | 31.2 | |||
| Independent hold | Swing | ||||
| Party | Candidate | Votes | % | ±% | |
|---|---|---|---|---|---|
| Independent | Nicholas White | 585 | 49.3 | ||
| Conservative | Harry Baker-Smith | 434 | 36.6 | ||
| Liberal Democrats | Roger Martin | 120 | 10.1 | ||
| Labour | Emba Jones | 48 | 4.0 | ||
| Majority | 151 | 12.7 | |||
| Turnout | 1,192 | 39.0 | |||
| Independent hold | Swing | ||||
| Party | Candidate | Votes | % | ±% | |
|---|---|---|---|---|---|
| Independent | Chris Farr | 991 | 61.9 | ||
| Conservative | Keith Ward | 333 | 20.8 | ||
| Labour | Paul Ryan | 185 | 11.5 | ||
| Liberal Democrats | Martin Redman | 93 | 5.8 | ||
| Majority | 658 | 41.1 | |||
| Turnout | 1,609 | 35.5 | |||
| Independent hold | Swing | ||||
| Party | Candidate | Votes | % | ±% | |
|---|---|---|---|---|---|
| Liberal Democrats | Annette Evans | 721 | 55.2 | ||
| Conservative | Jeremy Webster | 524 | 40.1 | ||
| Labour | Anne Watson | 61 | 4.7 | ||
| Majority | 197 | 15.1 | N/A | ||
| Turnout | 1,313 | 41.1 | |||
| Liberal Democrats gain from Conservative | Swing | ||||
| Party | Candidate | Votes | % | ±% | |
|---|---|---|---|---|---|
| Residents | Ian Booth | 850 | 65.4 | ||
| Conservative | Beverley Connolly | 266 | 20.5 | ||
| Liberal Democrats | Rupert McCann | 125 | 9.6 | ||
| Labour | Angie Horrigan | 58 | 4.5 | ||
| Majority | 584 | 44.9 | |||
| Turnout | 1,300 | 45.4 | |||
| Residents hold | Swing | ||||
| Party | Candidate | Votes | % | ±% | |
|---|---|---|---|---|---|
| Independent | Katie Montgomery | 558 | 44.0 | New | |
| Conservative | Mark Ridge | 544 | 42.9 | ||
| Labour | Fern Warwick-Ching | 89 | 7.0 | ||
| Liberal Democrats | Dave Wilkes | 76 | 6.0 | ||
| Majority | 14 | 1.1 | N/A | ||
| Turnout | 1,271 | 38.4 | |||
| Independent gain from Conservative | Swing | ||||
| Party | Candidate | Votes | % | ±% | |
|---|---|---|---|---|---|
| Residents | Catherine Sayer | 1,568 | 78.5 | ||
| Conservative | Richard Aldridge | 248 | 12.4 | ||
| Liberal Democrats | Martin Caxton | 100 | 5.0 | ||
| Labour | Sara Jupp | 81 | 4.1 | ||
| Majority | 1,320 | 66.1 | |||
| Turnout | 1,999 | 44.5 | |||
| Residents hold | Swing | ||||
| Party | Candidate | Votes | % | ±% | |
|---|---|---|---|---|---|
| Residents | Bryan Black | 1,211 | 67.1 | ||
| Conservative | Nicolas Cook | 253 | 14.0 | ||
| Labour | James Tickner | 229 | 12.7 | ||
| Liberal Democrats | Kerrin McManus | 113 | 6.3 | ||
| Majority | 958 | 53.1 | |||
| Turnout | 1,814 | 38.5 | |||
| Residents hold | Swing | ||||
| Party | Candidate | Votes | % | ±% | |
|---|---|---|---|---|---|
| Liberal Democrats | Vicky Robinson | 489 | 44.9 | ||
| Conservative | Maria Grasso | 486 | 44.6 | ||
| Labour | Roy Stewart | 114 | 10.5 | ||
| Majority | 3 | 0.3 | |||
| Turnout | 1,093 | 37.6 | |||
| Liberal Democrats hold | Swing | ||||
| Party | Candidate | Votes | % | ±% | |
|---|---|---|---|---|---|
| Liberal Democrats | Perry Chotai | 713 | 45.0 | ||
| Conservative | Nathan Adams | 517 | 32.6 | ||
| Independent | Martin Haley | 256 | 16.1 | New | |
| Labour | Mark Wilson | 100 | 6.3 | ||
| Majority | 196 | 12.4 | |||
| Turnout | 1,590 | 36.7 | |||
| Liberal Democrats hold | Swing | ||||
| Party | Candidate | Votes | % | ±% | |
|---|---|---|---|---|---|
| Conservative | Robin Bloore | 483 | 45.7 | ||
| Independent | Dan Matthews | 272 | 25.8 | New | |
| Liberal Democrats | Neill Cooper | 247 | 23.4 | ||
| Labour | Nathan Manning | 54 | 5.1 | ||
| Majority | 211 | 19.9 | |||
| Turnout | 1,060 | 37.7 | |||
| Conservative hold | Swing | ||||
| Party | Candidate | Votes | % | ±% | |
|---|---|---|---|---|---|
| Liberal Democrats | Helen Bilton | 491 | 50.7 | ||
| Conservative | Derek Carpenter | 317 | 32.7 | ||
| Labour | Robin Clements | 161 | 16.6 | ||
| Majority | 174 | 18.0 | |||
| Turnout | 972 | 28.4 | |||
| Liberal Democrats hold | Swing | ||||
| Party | Candidate | Votes | % | ±% | |
|---|---|---|---|---|---|
| Liberal Democrats | Jeffrey Gray | 490 | 48.5 | ||
| Conservative | Fodi Foti | 364 | 36.0 | ||
| Labour | Jonathan Wheale | 157 | 15.5 | ||
| Majority | 126 | 12.5 | |||
| Turnout | 1,020 | 31.5 | |||
| Liberal Democrats hold | Swing | ||||

Tandridge is a local government district in east Surrey, England. Its council is based in Oxted, although the largest settlement is Caterham; other notable settlements include Warlingham, Godstone and Lingfield. In mid-2019, the district had an estimated population of 88,129.

One third of Tandridge District Council in Surrey, England is elected each year, followed by one year when there is an election to Surrey County Council instead. Since the last boundary changes in 2000, 42 councillors have been elected from 20 wards.
The 1998 Tandridge District Council election took place on 7 May 1998 to elect members of Tandridge District Council in Surrey, England. One third of the council was up for election and the council stayed under no overall control.
The 1999 Tandridge District Council election took place on 6 May 1999 to elect members of Tandridge District Council in Surrey, England. One third of the council was up for election and the council stayed under no overall control.
The 2000 Tandridge District Council election took place on 4 May 2000 to elect members of Tandridge District Council in Surrey, England. The whole council was up for election, rather than the normal election by thirds, following boundary changes since the last election in 1999. There remained 42 seats on the council: six three-member wards, ten two-member wards and four one-member wards. The Conservative Party gained overall control of the council from no overall control.

The 2002 Tandridge District Council election took place on 2 May 2002 to elect members of Tandridge District Council in Surrey, England. One third of the council was up for election and the Conservative Party stayed in overall control of the council.

The 2003 Tandridge District Council election took place on 1 May 2003 to elect members of Tandridge District Council in Surrey, England. One third of the council was up for election and the Conservative Party stayed in overall control of the council.

The 2004 Tandridge District Council election took place on 10 June 2004 to elect members of Tandridge District Council in Surrey, England. One third of the council was up for election and the Conservative Party stayed in overall control of the council.

The 2006 Tandridge District Council election took place on 4 May 2006 to elect members of Tandridge District Council in Surrey, England. One third of the council was up for election and the Conservative Party stayed in overall control of the council.

The 2007 Tandridge District Council election took place on 3 May 2007 to elect members of Tandridge District Council in Surrey, England. One third of the council was up for election and the Conservative Party stayed in overall control of the council.

The 2008 Tandridge District Council election took place on 1 May 2008 to elect members of Tandridge District Council in Surrey, England. One third of the council was up for election and the Conservative Party stayed in overall control of the council.

The 2010 Tandridge District Council election took place on 6 May 2010 to elect members of Tandridge District Council in Surrey, England. One third of the council was up for election and the Conservative Party stayed in overall control of the council.

The 2011 Tandridge District Council election took place on 5 May 2011 to elect members of Tandridge District Council in Surrey, England. One third of the council was up for election and the Conservative Party stayed in overall control of the council.

The 2012 Tandridge District Council election took place on 3 May 2012 to elect members of Tandridge District Council in Surrey, England. One third of the council was up for election and the Conservative Party stayed in overall control of the council.

The 2014 Tandridge District Council election took place on 22 May 2014 to elect members of Tandridge District Council in Surrey, England. One third of the council was up for election and the Conservative Party stayed in overall control of the council.
The 2015 Tandridge District Council election took place on 7 May 2015 to elect one third of members to Tandridge District Council in England coinciding with other local elections held simultaneously with a General Election which resulted in increased turnout compared to the election four years before. Elections in each ward, depending on size are held in two or three years out of four.
The 2016 Tandridge District Council election took place on 5 May 2016 to elect members of Tandridge District Council in England. This was on the same day as other local elections.
The 2018 Tandridge District Council election took place on 3 May 2018 to elect members of Tandridge District Council in Surrey, England. One third of the council was up for election and the Conservative Party narrowly stayed in overall control of the council.
The 2019 Tandridge District Council election took place on 2 May 2019 to elect one third of members to Tandridge District Council in England coinciding with other local elections

The 2021 Tandridge District Council election took place on 6 May 2021 to elect members of Tandridge District Council in England. This was on the same day as other local elections.