This article needs to be updated.(July 2022) |

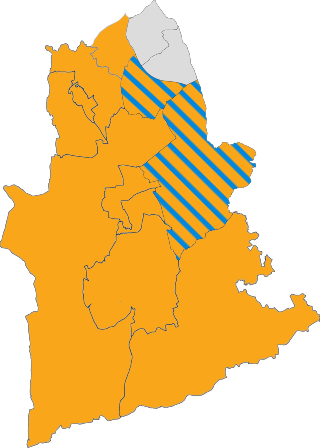
The 2022 Mole Valley District Council election took place on 5 May 2022 to elect one-third of Mole Valley District Council members in England. [1]
This article needs to be updated.(July 2022) |
The 2022 Mole Valley District Council election took place on 5 May 2022 to elect one-third of Mole Valley District Council members in England. [1]
| 2022 Mole Valley District Council election [2] | ||||||||||
|---|---|---|---|---|---|---|---|---|---|---|
| Party | This election | Full council | This election | |||||||
| Seats | Net | Seats % | Other | Total | Total % | Votes | Votes % | +/− | ||
| Liberal Democrats | 8 | 57.1 | 16 | 24 | 58.5 | 11,070 | 45.3 | +8.4 | ||
| Conservative | 3 | 21.4 | 7 | 10 | 24.4 | 7,910 | 32.3 | -5.8 | ||
| Ashtead Ind. | 3 | 21.4 | 4 | 7 | 17.1 | 2,977 | 12.2 | -0.4 | ||
| Green | 0 | 0.0 | 0 | 0 | 0.0 | 1,507 | 6.2 | ±0.0 | ||
| Labour | 0 | 0.0 | 0 | 0 | 0.0 | 889 | 3.6 | -2.3 | ||
| Independent | 0 | 0.0 | 0 | 0 | 0.0 | 107 | 0.4 | N/A | ||
| Party | Candidate | Votes | % | ±% | |
|---|---|---|---|---|---|
| Ashtead Ind. | Patricia Wiltshire | 828 | 61.1 | -2.2 | |
| Conservative | Gavin Newton | 202 | 14.9 | −4.1 | |
| Liberal Democrats | Roland Hogg | 201 | 14.8 | +5.7 | |
| Green | Jo Sherring | 125 | 9.2 | N/A | |
| Majority | 626 | 46.2 | |||
| Turnout | 1,356 | 43.0 | |||
| Ashtead Ind. hold | Swing | ||||
| Party | Candidate | Votes | % | ±% | |
|---|---|---|---|---|---|
| Ashtead Ind. | Garry Stansfield | 906 | 64.1 | +9.4 | |
| Conservative | Stephen Connor | 366 | 25.9 | −1.8 | |
| Liberal Democrats | Leonard Rugina | 142 | 10.0 | +2.4 | |
| Majority | 540 | 38.2 | |||
| Turnout | 1,414 | 41.3 | |||
| Ashtead Ind. hold | Swing | ||||
| Party | Candidate | Votes | % | ±% | |
|---|---|---|---|---|---|
| Ashtead Ind. | Alan Reilly | 1,243 | 62.9 | +4.2 | |
| Conservative | Peter Crooks | 321 | 16.2 | −5.1 | |
| Liberal Democrats | Philippa Shimmin | 245 | 12.4 | +4.3 | |
| Labour | Susan Gilchrist | 167 | 8.5 | +1.6 | |
| Majority | 922 | 46.7 | |||
| Turnout | 1,976 | 42.2 | |||
| Ashtead Ind. hold | Swing | ||||
| Party | Candidate | Votes | % | ±% | |
|---|---|---|---|---|---|
| Liberal Democrats | Monica Weller | 1,420 | 60.6 | +20.3 | |
| Conservative | Richard Moyse | 785 | 33.5 | −16.0 | |
| Green | John Roche | 139 | 5.9 | +0.5 | |
| Majority | 635 | 27.1 | |||
| Turnout | 2,344 | 50.2 | |||
| Liberal Democrats gain from Conservative | Swing | ||||
| Party | Candidate | Votes | % | ±% | |
|---|---|---|---|---|---|
| Liberal Democrats | Elizabeth Daly | 1,347 | 61.1 | +17.4 | |
| Conservative | Mary Huggins | 718 | 32.6 | −14.4 | |
| Green | Molly Crook | 139 | 6.3 | +1.3 | |
| Majority | 629 | 28.5 | |||
| Turnout | 2,204 | 48.7 | |||
| Liberal Democrats hold | Swing | ||||
| Party | Candidate | Votes | % | ±% | |
|---|---|---|---|---|---|
| Conservative | Simon Budd | 969 | 57.7 | +20.7 | |
| Liberal Democrats | Mike Hebberd | 522 | 31.1 | −14.7 | |
| Green | Christopher Crook | 122 | 7.3 | −7.8 | |
| Labour | Leo Nassakau | 66 | 3.9 | +1.9 | |
| Majority | 447 | 26.6 | |||
| Turnout | 1,679 | 47.1 | |||
| Conservative hold | Swing | ||||
| Party | Candidate | Votes | % | ±% | |
|---|---|---|---|---|---|
| Liberal Democrats | Charls Engel | 808 | 48.7 | −2.2 | |
| Conservative | Corrina Osborne-Patterson | 739 | 44.5 | +8.8 | |
| Green | Lisa Scott | 112 | 6.8 | +2.8 | |
| Majority | 69 | 4.2 | |||
| Turnout | 1,659 | 48.9 | |||
| Liberal Democrats gain from Conservative | Swing | ||||
| Party | Candidate | Votes | % | ±% | |
|---|---|---|---|---|---|
| Liberal Democrats | David Draper | 881 | 56.9 | −2.7 | |
| Green | Holland Weston | 330 | 21.3 | +8.5 | |
| Conservative | Paul Austin | 245 | 15.8 | −5.2 | |
| Labour | Samuel Cockle-Hearne | 93 | 6.0 | −0.7 | |
| Majority | 551 | 35.6 | |||
| Turnout | 1,549 | 44.4 | |||
| Liberal Democrats hold | Swing | ||||
| Party | Candidate | Votes | % | ±% | |
|---|---|---|---|---|---|
| Liberal Democrats | Margaret Cooksey | 1,505 | 61.4 | +5.5 | |
| Conservative | Austin Kesseiri | 446 | 18.2 | −7.1 | |
| Green | Lucy Barford | 314 | 12.8 | +1.3 | |
| Labour Co-op | Kev Stroud | 187 | 7.6 | +0.3 | |
| Majority | 1,059 | 43.2 | |||
| Turnout | 2,452 | 43.3 | |||
| Liberal Democrats hold | Swing | ||||
| Party | Candidate | Votes | % | ±% | |
|---|---|---|---|---|---|
| Conservative | Tim Hall | 779 | 58.7 | −1.9 | |
| Liberal Democrats | Christine Miller | 440 | 33.2 | +7.7 | |
| Green | Susan McGrath | 108 | 8.1 | −1.8 | |
| Majority | 339 | 25.5 | |||
| Turnout | 1,327 | 43.1 | |||
| Conservative hold | Swing | ||||
| Party | Candidate | Votes | % | ±% | |
|---|---|---|---|---|---|
| Liberal Democrats | Raj Haque | 1,035 | 65.8 | +7.6 | |
| Conservative | Stephen Conisbee | 539 | 34.2 | −5.1 | |
| Majority | 496 | 31.6 | |||
| Turnout | 1,574 | 49.4 | |||
| Liberal Democrats hold | Swing | ||||
| Party | Candidate | Votes | % | ±% | |
|---|---|---|---|---|---|
| Liberal Democrats | Clayton Wellman | 997 | 60.2 | +9.6 | |
| Conservative | Leslie Maruziva | 546 | 33.0 | −4.0 | |
| Labour | Christine Foster | 114 | 6.9 | +1.0 | |
| Majority | 451 | 27.2 | |||
| Turnout | 1,657 | 35.5 | |||
| Liberal Democrats hold | Swing | ||||
| Party | Candidate | Votes | % | ±% | |
|---|---|---|---|---|---|
| Liberal Democrats | Josie Brinker | 988 | 54.3 | +7.2 | |
| Conservative | Paul Purcelll | 578 | 31.8 | −9.7 | |
| Labour Co-op | James Stringer | 145 | 8.0 | −3.4 | |
| Independent | Jessica Moram | 107 | 5.9 | N/A | |
| Majority | 410 | 22.5 | |||
| Turnout | 1,818 | 33.3 | |||
| Liberal Democrats hold | Swing | ||||
| Party | Candidate | Votes | % | ±% | |
|---|---|---|---|---|---|
| Conservative | Joanna Slater | 677 | 46.7 | −9.8 | |
| Liberal Democrats | Gareth Parsons | 539 | 37.1 | +12.0 | |
| Green | Melissa Awcock | 118 | 8.1 | −0.7 | |
| Labour Co-op | Ann Clark | 117 | 8.1 | −1.4 | |
| Majority | 138 | 9.6 | |||
| Turnout | 1,451 | 42.8 | |||
| Conservative hold | Swing | ||||

Reigate and Banstead is a local government district with borough status in Surrey, England. Its council is based in Reigate and the borough also includes the towns of Banstead, Horley and Redhill. Parts of the borough are within the Surrey Hills, a designated Area of Outstanding Natural Beauty. Northern parts of the borough, including Banstead, lie inside the M25 motorway which encircles London.

The Borough of Waverley is a local government district with borough status in Surrey, England. The council is based in the town of Godalming. The borough also contains the towns of Farnham and Haslemere and numerous villages, including the large village of Cranleigh, and surrounding rural areas. At the 2021 Census, the population of the borough was 128,200. The borough is named after Waverley Abbey, near Farnham. Large parts of the borough are within the Surrey Hills National Landscape.

Sir Alexander Paul Beresford is a British–New Zealander politician who served as the Conservative Member of Parliament (MP) for Mole Valley in Surrey from 1997 to 2024. He previously served as MP for Croydon Central from 1992 to 1997.

Mole Valley is a local government district in Surrey, England. Its council is based in Dorking, and the district's other town is Leatherhead. The largest villages are Ashtead, Fetcham and Great Bookham, in the northern third of the district.
Horsham is a local government district in West Sussex, England. It is named after the town of Horsham, which is its largest settlement and where the council is based. The district also includes the surrounding rural area and contains many villages, the largest of which are Southwater and Billingshurst. The district includes part of the South Downs National Park and part of the designated Area of Outstanding Natural Beauty of High Weald. At the 2021 census the district had a population of 147,487.
Winchester, or the City of Winchester, is a local government district with city status in Hampshire, England.

Epsom and Ewell is a constituency in Surrey represented in the House of Commons of the UK Parliament since 2024 by Helen Maguire, a Liberal Democrat.

Brockham is a village and civil parish in the Mole Valley district of Surrey, England. It is approximately 1.5 miles (2.4 km) east of Dorking and 4 miles (6.4 km) west of Reigate. The village lies south of Box Hill, with the River Mole flowing west through the village. At the 2011 census, it had a population of 2,868.

Mole Valley is a former constituency in Surrey represented in the House of Commons of the UK Parliament since 1997 by Sir Paul Beresford, a Conservative, until it was abolished in 2024, primarily replaced by Dorking and Horley.

Surrey County Council is the county council for the non-metropolitan county of Surrey, England. The council is composed of 81 elected councillors, and in all but one election since 1974 the Conservative Party has held the majority. The leader of the council is Tim Oliver.
One third of Mole Valley District Council in Surrey, England is elected each year, followed by one year when there is an election to Surrey County Council instead.
Elections to Mole Valley Council were held on 3 May 2007. One third of the council was up for election and the Conservative Party kept overall control of the council. Overall turnout was 46.5%.
Elections to Mole Valley Council were held on 1 May 2008. One third of the council was up for election and the Conservative Party stayed in overall control of the council. Overall turnout was 46.5% a drop from the 47.2% seen in the 2007 election.
The 2014 Mole Valley District Council election took place on 22 May 2014 to elect members of Mole Valley District Council in England. This was on the same day as other local elections.
The 2015 Mole Valley District Council election took place on 7 May 2015 to elect approximately one-third of members to Mole Valley District Council in England coinciding with other local elections held simultaneously with a general election which resulted in increased turnout compared to the election four years before. Some two-member wards such as Holmwoods did not hold a local election in this year, being contested in even-numbered years.
The 2016 Mole Valley District Council election took place on 5 May 2016 to elect members of Mole Valley District Council in England. This was on the same day as other local elections.
The 2019 Mole Valley District Council election took place on 2 May 2019 to elect approximately one-third of members to Mole Valley District Council in England, coinciding with other local elections held simultaneously across 248 councils in England and all 11 councils in Northern Ireland. The 2019 Mole Valley local election outcomes are outlined below in the summary results chart and the detailed results charts for each ward. The 2019 election results are compared against the results when these wards were last contested four years previously, on the same day as the General Election of May 2015. The difference in the results for certain political parties is stark. This is largely influenced by an excellent result for the Conservatives on their general election winning day in May 2015, but a terrible result for the Conservatives in May 2019 when, nationally, the Government of Theresa May had failed to ‘deliver Brexit’ by the anticipated date of 29 March 2019. But even taking the national backdrops of these two very different local elections into account, it was still a spectacularly poor set of results for the Conservatives in Mole Valley in these 2019 local elections and a very good set of results for the Liberal Democrats. Some Mole Valley wards did not hold a local election in 2019, being contested instead in even-numbered years.

The 2021 Mole Valley District Council election took place on 6 May 2021 to elect one-third of members to Mole Valley District Council in England. This Mole Valley local election had been postponed from 2020 because of the coronavirus pandemic, so it took place instead alongside the scheduled 2021 Surrey County Council election and all the other local elections across the United Kingdom. The 2021 election results are compared against the results when these wards were last contested five years previously, in 2016.
The 2018 Mole Valley District Council election took place on 3 May 2018 to elect approximately one-third of members to Mole Valley District Council in England, coinciding with other local elections. The Conservatives went into the elections with a majority of 1, but lost control of the council, leaving it with no overall majority. The 2018 election results are compared against the results when these wards were last contested four years previously, in 2014.

The 2023 Mole Valley District Council election took place on 4 May 2023 to elect members of Mole Valley District Council in Surrey, England. This would be on the same day as other local elections in England. This was the first election following the redrawing of ward boundaries that resulted in the number of councillors being reduced by two to 39. All positions were contested. As a result of the election, the Liberal Democrats increased their majority on the council to 30 out of 39 seats.