Abercromby (Liverpool ward)

Last updated

Abercromby
Liverpool Abercromby (1980 ward).svg
Abercromby ward (1980) within Liverpool
Registered Electors11,020 (2003 election)
Metropolitan borough
Metropolitan county
Region
Country England
Sovereign state United Kingdom
List of places
UK
England
Merseyside

Abercromby ward was an electoral division of Liverpool City Council.

Contents

Background

The ward was originally created in 1835, its boundaries were changed in 1953, merged with St James ward in 1974 and was recreated in 1980 before being dissolved in 2004.

1835 boundaries

The ward was created in 1835 as an original ward of Liverpool Town Council under the provisions of the Municipal Corporations Act 1835. This was the first democratically elected council replacing the previous Liverpool Common Council. Three councillors were returned to the council by Abercromby Ward.

By 1860 the ward boundary commenced from London Road at its junction with Norton Street and Seymour Street, proceeding eastwards along Pembroke Place, thereafter southeastwards along Crown Street to its junction with Falkner Street, westwards along said street to Hope Street, proceeding northwards to Mount Pleasant, thereafter westwards towards Clarence Street, continuing along Russell Street and Seymour Street to the point of commencement. [1]

From 1835 to 1885 the ward was part of the Liverpool Parliamentary constituency, from 1885 to 1918 part of the Liverpool Abercromby Parliamentary constituency, and from 1918 to its dissolution part of the Liverpool Exchange Parliamentary constituency.

1980 boundaries

The ward boundary was changed for the 1980 elections. A report of the Local Government Boundary Commission for England published in November 1978 set out proposals for changes to the wards of Liverpool City Council, maintaining the number of councillors at 99 representing 33 wards. Abercromby ward was represented by three councillors. [2]

The report describes the boundaries of Tuebrook ward as "Commencing at a point where the western boundary of the City meets the southern boundary of Everton Ward, thence northeastwards along said ward boundary to Russell Street, thence southwards along said street to Brownlow Hill, thence eastwards along said hill to Crown Street, thence southeastwards along said street and in prolongation thereof to Upper Parliament Street, thence westwards along said street to Windsor Street, thence southeastwards along said street to Northumberland Street, thence southwestwards along said street and in prolongation thereof to the western boundary of the City, thence northwestwards along said boundary to the point of commencement". [3]

From 1980 to 1983 the ward was part of the Liverpool Exchange Parliamentary constituency, and from 1983 to its dissolution was part of the Liverpool Riverside Parliamentary constituency.

2004 elections

A report of the Local Government Boundary Commission published in March 2003 recommended the number of wards in the city be reduced to 30 and the number of councillors reduced to 90. The Abercromby ward was dissolved and distributed into the new Riverside and Princes Park wards. [4]

Councillors

ElectionCouncillorCouncillorCouncillor [5]
1835 Thomas Brocklebank (Ref)James Carson (Ref)William Earle (Ref)
1836 Thomas Brocklebank (Whig)James Carson (Whig)William Earle (Whig)
1837 Thomas Brocklebank (Whig)James Carson (Whig)William Earle (Whig)
1838 Thomas Brocklebank (Whig)James Carson (Whig) Robertson Gladstone (Con)
1839 Christopher Bushell (Con)James Carson (Whig) Robertson Gladstone (Con)
(1840-1952)
1953 L Murphy (Lab)Thomas Maguire (Lab)Harry Livermore (Lab)
Kenneth Walter Consell (Lab)
1954 L Murphy (Lab)Kenneth Walter Consell (Lab)Harry Livermore (Lab)
1955 L Murphy (Lab)P Maguire (Lab)Harry Livermore (Lab)
1956 L Murphy (Lab)P Maguire (Lab)Paul Orr (Lab)
1957 C Morris (Lab)P Maguire (Lab)Paul Orr (Lab)
1958 C Morris (Lab)P Maguire (Lab)Paul Orr (Lab)
1959 C Morris (Lab)P Maguire (Lab)Paul Orr (Lab)
1960 R.W. Rollins (Con)P Maguire (Lab)Paul Orr (Lab)
1961 R.W. Rollins (Con)John E McPherson (Lab)Paul Orr (Lab)
1962 R.W. Rollins (Con)John E McPherson (Lab)Harry Livermore (Lab)
1963 L Caplan (Lab)John E McPherson (Lab)Harry Livermore (Lab)
1964 L Caplan (Lab)John E McPherson (Lab)Harry Livermore (Lab)
1965 L Caplan (Lab)John E McPherson (Lab)Frank Gaier (Lab)
1966 William Burke (Lab)John E McPherson (Lab)Frank Gaier (Lab)
1967 William Burke (Lab)John E McPherson (Lab)Frank Gaier (Lab)
1968 William Burke (Lab)John E McPherson (Lab)David Daniel (Con)
1969 William Burke (Lab)John E McPherson (Lab)David Daniel (Con)
1970 William Burke (Lab)John E McPherson (Lab)David Daniel (Con)
1971 William Burke (Lab)John E McPherson (Lab)SF Jacobs (Lab)
1972 William Burke (Lab)John E McPherson (Lab)SF Jacobs (Lab)
1973-1980 see Abercromby St. James
1980 David Vasmer (Lib)Alan Troy (Lib)Chris Davies (Lib)
1982 Tony Hood (Lab)Alan Troy (Lib)Chris Davies (Lib)
1983 Tony Hood (Lab)Jimmy Rutledge (Lab)Chris Davies (Lib)
1984 Tony Hood (Lab)Jimmy Rutledge (Lab)Joe Devaney (Lab)
1986 Tony Hood (Lab)Jimmy Rutledge (Lab)Joe Devaney (Lab)
1987 Keith Hackett (Lab)Alan Dean (Lab)K. Feintuck (Lab)
1988 Keith Hackett (Lab)Alan Dean (Lab)K. Feintuck (Lab)
1990 Keith Hackett (Lab)Alan Dean (Lab)Sarah Norman (Lab)
1991 Keith Hackett (Lab)N Stanley (Lab)Sarah Norman (Lab)
1992 Keith Hackett (Lab)N Stanley (Lab)Sarah Norman (Lab)
1994 J Hackett (Lab)N Stanley (Lab)Sarah Norman (Lab)
1995 S Watson (Lab)A Cleary (Lab)Sarah Norman (Lab)
1996 S Watson (Lab)A Cleary (Lab)Sarah Norman (Lab)
1998 Joe Anderson (Lab)A Cleary (Lab)Steve Munby (Lab)
1999 Joe Anderson (Lab)Paul Brant (Lab)Steve Munby (Lab)
2000 Joe Anderson (Lab)Paul Brant (Lab)Steve Munby (Lab)
2002 Joe Anderson (Lab)Paul Brant (Lab)Steve Munby (Lab)
2003 Joe Anderson (Lab)Paul Brant (Lab)Steve Munby (Lab)

  indicates seat up for re-election after boundary changes.

  indicates seat up for re-election.

  indicates change in affiliation.

  indicates seat up for re-election after casual vacancy.


Election results

Elections of the 2000s

1 May 2003
PartyCandidateVotes%±%
Labour Paul Brant953 61.29 Decrease2.svg4.53
Liberal Democrats Linda-Jane Buckle28818.52Increase2.svg3.27
Green Peter Cranie23014.79Increase2.svg3.94
Conservative John Creagh553.54Decrease2.svg1.26
Liberal Arthur Carroll291.86Decrease2.svg1.42
Majority66542.77Decrease2.svg7.79
Turnout 1,55514.11Increase2.svg0.13
Registered electors 11,020
Labour hold Swing -3.90
2 May 2002
PartyCandidateVotes%±%
Labour Joe Anderson 1,001 65.81 Decrease2.svg0.45
Liberal Democrats Daniel Clein23215.25Decrease2.svg2.05
Green Peter Cranie16510.85Increase2.svg4.47
Conservative Diane Watson734.80Increase2.svg0.87
Liberal Arthur Carroll503.29Decrease2.svg2.83%
Majority76950.56Increase2.svg1.61
Turnout 1,52113.98Increase2.svg2.84
Registered electors 10,876
Labour hold Swing +0.80
4 May 2000
PartyCandidateVotes%±%
Labour Steve Munby758 66.26 Increase2.svg8.77
Liberal Democrats Jeremy Wright19817.31Decrease2.svg15.46
Green R. Barratt736.38Decrease2.svg0.49
Liberal J. Richardson706.12Steady2.svg N/A
Conservative G.A. Watson453.93Increase2.svg1.06
Majority56048.95Increase2.svg24.23
Turnout 1,07411.15Decrease2.svg4.67
Registered electors 10,263
Labour hold Swing +12.11

Elections of the 1990s

6 May 1999
PartyCandidateVotes%±%
Labour Paul Brant 879 57.49 Decrease2.svg1.85
Liberal Democrats Josie Mullen50132.77Increase2.svg3.50
Green Jennifer Mary. Brown1056.87Steady2.svg N/A
Conservative Diane Isabel Watson442.88Decrease2.svg1.36
Majority37824.72Decrease2.svg5.35
Turnout 1,52915.81Increase2.svg5.29
Registered electors 9,669
Labour hold Swing -2.67
7 May 1998 (2 seats)
PartyCandidateVotes%±%
Labour Joe Anderson 588 59.33 Decrease2.svg13.50
Labour Steve Munby 547 55.20 -
Liberal Democrats C. Barnett29029.26Increase2.svg21.60
Liberal Democrats J.Cowan24424.62-
Liberal M. Wingfield717.16Increase2.svg0.44
Conservative C.P.S. Biller424.24Decrease2.svg1.81
Conservative C.S. Harley414.14-
Majority29830.07Decrease2.svg35.09
Turnout 99110.52Decrease2.svg7.43
Registered electors 9,419
Labour hold Swing -17.55
Labour hold Swing
2 May 1996
PartyCandidateVotes%±%
Labour Sarah Norman1,083 72.83 Decrease2.svg1.93
Liberal Democrats Kevin Firth1147.67Decrease2.svg0.37
Liberal A. Carroll1006.72Increase2.svg2.41
Green R. Spalding1006.72Decrease2.svg1.00
Conservative C. Zsigmond906.05Increase2.svg0.89
Majority96965.16Decrease2.svg1.56
Turnout 1,48717.95Decrease2.svg5.03
Registered electors 8,285
Labour hold Swing -0.78
4 May 1995 (2 seats)
PartyCandidateVotes%±%
Labour A. Cleary 1,404 74.76 Increase2.svg1.17
Labour S. Watson 1,265 67.36 -
Liberal Democrats Nigel Dyer1518.04Decrease2.svg3.90
Green R. Spalding1457.72Increase2.svg1.72
Liberal Democrats John Clucas1417.54-
Conservative P. Edwards975.17Increase2.svg0.40
Liberal J. Mayes814.31Increase2.svg0.62
Majority1,25366.72Increase2.svg5.07
Turnout 1,87822.98Decrease2.svg0.91
Registered electors 8,172
Labour hold Swing +2.54
Labour hold Swing
5 May 1994
PartyCandidateVotes%±%
Labour J. Hackett 1,374 73.59 Increase2.svg2.73
Liberal Democrats Nigel Dyer22311.94Increase2.svg0.72
Green Jennifer Brown1126.00Decrease2.svg1.68
Conservative P. Edwards894.77Decrease2.svg5.47
Liberal J. Highcock694.77Steady2.svg N/A
Majority1,15161.65Increase2.svg2.00
Turnout 1,86723.89Increase2.svg3.25
Registered electors 7,815
Labour hold Swing +1.00
7 May 1992
PartyCandidateVotes%±%
Labour Sarah Norman 1,080 70.87 Decrease2.svg6.60
Liberal Democrats Nigel Dyer17111.22Decrease2.svg3.45
Conservative A. Zsigmond15610.24Increase2.svg2.37
Green S. Mansfield1177.68Steady2.svg N/A
Majority90959.65Decrease2.svg3.15
Turnout 1,52420.64Decrease2.svg7.43
Registered electors 7,385
Labour hold Swing -1.57
2 May 1991
PartyCandidateVotes%±%
Labour N. Stanley 1,526 77.46 Increase2.svg4.15
Liberal Democrats Nigel Dyer28914.67Increase2.svg8.77
Conservative C. Zsigmond1557.87Increase2.svg2.70
Majority1,23762.79Increase2.svg0.75
Turnout 1,97028.07Decrease2.svg15.10
Registered electors 7,018
Labour hold Swing -2.31
3 May 1990 (2 seats)
PartyCandidateVotes%±%
Labour Keith Hackett1,802 73.31 Decrease2.svg7.39
Labour Sarah Norman 1,745 70.99 -
Green Laura Davenport27711.27Steady2.svg N/A
Liberal Democrats Jeremy Chowings1455.90Decrease2.svg1.35
Liberal Democrats Nigel Dyer1345.45-
Conservative Pauline Edwards1275.90Decrease2.svg1.85
Conservative D. Radcliffe1144.64-
Communist F. Carroll1074.35Decrease2.svg0.68
Majority1,52562.04Decrease2.svg11.41
Turnout 2,45843.17Increase2.svg5.34
Registered electors 5,694
Labour hold Swing -

Elections of the 1980s

5 May 1988
PartyCandidateVotes%±%
Labour K. Feintuck2,070 80.70 Increase2.svg11.57
SLD Carole Matthews1867.25Decrease2.svg 11.38
Conservative P. Lee1807.02Increase2.svg1.73
Communist P. Carroll1295.03Decrease2.svg1.91
Majority1,88473.45Increase2.svg22.95
Turnout 1,88473.45Decrease2.svg4.92
Registered electors 6,780
Labour hold Swing +11.47
7 May 1987 - 3 seats [Note 1]
PartyCandidateVotes%±%
Labour Alan W. Dean 2,260 79.13 Decrease2.svg0.93
Labour Keith Hackett 2,225 68.06 -
Labour K. Feintuck 2,221 67.94 -
Liberal Annette Butler60918.63Increase2.svg1.47
Liberal W. M. Bullock54516.67-
Liberal K. D. Kelbrick54517-
Communist F. Carroll2276.94Increase2.svg3.09
Conservative G. A. Earle1735.29Decrease2.svg0.14
Conservative E. B. Steadman1384.22-
Conservative G. A. H. Tann1303.98-
Majority1,65150.50Decrease2.svg2.39
Turnout 3,26942.75Increase2.svg9.02
Registered electors 7,646
Labour hold Swing -1.20
1 May 1986
PartyCandidateVotes%±%
Labour Antony Hood1,947 70.06 Decrease2.svg9.72
Alliance B. Aston47717.16Increase2.svg6.97
Conservative H. V. Tracey Forster1515.43Decrease2.svg1.91
Communist F. Carroll1073.85Increase2.svg1.17
Green N. Everard973.49Steady2.svg N/A
Majority1,47052.90Decrease2.svg16.69
Turnout 2,77933.73Decrease2.svg4.58
Registered electors 8,239
Labour hold Swing -8.35
1 May 1984
PartyCandidateVotes%±%
Labour Joe Devaney 2,739 89.78 Increase2.svg6.13
Liberal C. J. Leahy35010.20Decrease2.svg3.40
Conservative H. V. Tracy-Forster2527.34Decrease2.svg1.34
Communist F. Carroll922.68Decrease2.svg1.39
Majority2,38969.59Increase2.svg9.53
Turnout 3,43338.31Increase2.svg9.19
Registered electors 8,960
Labour gain from Liberal Swing +4.77
5 May 1983
PartyCandidateVotes%±%
Labour J. Rutledge 2,010 73.65 Increase2.svg19.59
Liberal C. J. Leahy37113.59Decrease2.svg24.00
Conservative H. V. Tracy-Forster2378.68Increase2.svg5.40
Communist F. Carroll1114.07Decrease2.svg0.99
Majority1,63960.06Increase2.svg43.59
Turnout 2,72929.12Decrease2.svg2.11
Registered electors 9,370
Labour gain from Liberal Swing +21.79
6 May 1982
PartyCandidateVotes%±%
Labour Antony Hood 1,648 54.07 Increase2.svg19.57
Liberal David Vasmer1,14637.60Decrease2.svg16.21
Communist Roger O'Hara1545.05Decrease2.svg3.15
Conservative G. A. Powell1003.28Decrease2.svg0.20
Majority50216.47Decrease2.svg2.84
Turnout 3,04831.24Decrease2.svg3.62
Registered electors 9,757
Labour gain from Liberal Swing +17.89
6 May 1980 (3 seats)
PartyCandidateVotes%±%
Liberal Chris Davies 2,040 53.8
Liberal Alan Troy 1,696
Liberal David Vasmer 1,692
Labour Owen Joseph Doyle 1,30834.5
Labour Edward Shields 1,301
Labour Violet McCoy 1,292
Communist Roger O'Hara3118.2
Conservative Ian McFall1323.5
Conservative Eric Wardle Mossford116
Conservative Ernest Peat107
Majority732
Turnout 36.3
Registered electors 10,455
Liberal win (new seat)

For elections between 1973 and 1979 see Abercromby St James

Elections of the 1970s

1972

3 May 1972
PartyCandidateVotes%±%
Labour William F Burke87178.75%Increase2.svg11.44
Conservative LW Mossford13912.57%Decrease2.svg6.04
Communist Anthony McLelland968.68%Increase2.svg3.17
Majority73266.18%Increase2.svg17.48
Turnout 1,10621.20%Decrease2.svg6.93
Registered electors 5,218
Labour hold Swing Increase2.svg8.74

1971

13 May 1971
PartyCandidateVotes%±%
Labour SF Jacobs1,03867.32%Increase2.svg0.97
Conservative David E. Daniels28718.61%Decrease2.svg3.78
Communist Anthony McLelland855.51%Decrease2.svg5.76
Majority75148.70%Increase2.svg4.75
Turnout 1,54228.12%Increase2.svg4.71
Registered electors 5,483
Labour gain from Conservative Swing Increase2.svg2.38

1970

7 May 1970
PartyCandidateVotes%±%
Labour John E McPherson88366.34%Increase2.svg21.98
Conservative A.W. Jones29822.39%Decrease2.svg16.28
Communist Anthony McLelland15011.27%Decrease2.svg2.34
Majority58543.95%Increase2.svg38.27
Turnout 1,33123.42%Increase2.svg2.52
Registered electors 5,684
Labour hold Swing Increase2.svg19.13

Elections of the 1960s

1969

8 May 1969
PartyCandidateVotes%±%
Labour William F Burke51544.36%Increase2.svg0.27
Conservative Stanley V Hennessy44938.67%Decrease2.svg6.64
Communist Anthony McLelland15813.61%Increase2.svg3.01
National Front Elvyn Thompson393.36%Steady2.svg N/A
Majority665.68%Increase2.svg4.47
Turnout 1,16120.89%Increase2.svg2.94
Registered electors 5,557
Labour hold Swing Increase2.svg3.45

1968

9 May 1968
PartyCandidateVotes%±%
Conservative David E Daniel48345.31%Increase2.svg3.92
Labour Frank Gaier47044.09%Decrease2.svg3.61
Communist Anthony McLelland11310.60%Decrease2.svg0.31
Majority131.22%Decrease2.svg5.09
Turnout 1,06627.95%Decrease2.svg2.07
Registered electors 5,938
Conservative gain from Labour Swing Increase2.svg3.77

1967

11 May 1967
PartyCandidateVotes%±%
Labour John E McPherson69547.70%Decrease2.svg10.51
Conservative Herbert C Norcott60341.39%Increase2.svg8.05
Communist Anthony McLelland15910.91%Increase2.svg2.46
Majority926.31%Decrease2.svg18.56
Turnout 1,45720.02%Increase2.svg2.38
Registered electors 7,276
Labour hold Swing Decrease2.svg9.28

1966

12 May 1966
PartyCandidateVotes%±%
Labour William F Burke83385.21%Decrease2.svg0.17
Conservative Herbert C Norcott47733.33%Decrease2.svg3.23
Communist Anthony McLelland1218.46%Increase2.svg3.40
Majority35624.88%Increase2.svg3.06
Turnout 1,43117.65%Decrease2.svg2.62
Registered electors 8,108
Labour hold Swing Increase2.svg1.53

1965

13 May 1965
PartyCandidateVotes%±%
Labour Frank Gaier1,01758.38%Decrease2.svg4.44
Conservative C Hughes63736.57%Increase2.svg7.06
Communist Anthony McLelland885.05%Decrease2.svg2.62
Majority38021.81%Decrease2.svg11.50
Turnout 1,74220.27%Decrease2.svg2.74
Registered electors 8,596
Labour hold Swing Decrease2.svg5.75

1964

7 May 1964
PartyCandidateVotes%±%
Labour John E McPherson1,31862.82%Decrease2.svg1.09
Conservative G.W. Boult61929.50%Decrease2.svg1.63
Communist Anthony McLelland1617.67%Increase2.svg2.72
Majority69933.32%Increase2.svg0.54
Turnout 2,09823.01%Decrease2.svg6.97
Registered electors 9,118
Labour hold Swing Increase2.svg0.27

1963

9 May 1963
PartyCandidateVotes%±%
Labour L Caplan1,79263.91%Decrease2.svg2.15
Conservative R.W. Rollins87331.13%Increase2.svg2.42
Communist Anthony McLelland1394.96%Decrease2.svg0.27
Majority91932.77%Decrease2.svg4.57
Turnout 2,80429.98%Increase2.svg3.64
Registered electors 9,353
Labour gain from Conservative Swing Decrease2.svg2.29

1962

10 May 1962
PartyCandidateVotes%±%
Labour Harry Livermore1,70766.06%Increase2.svg12.25
Conservative L Huglin74228.72%Decrease2.svg13.03
Communist Anthony McLelland1355.22%Steady2.svg N/A
Majority96537.35%Increase2.svg25.28
Turnout 2,58426.34%Increase2.svg1.27
Registered electors 9,810
Labour hold Swing Increase2.svg12.64

1961

11 May 1961
PartyCandidateVotes%±%
Labour John E McPherson1,35653.81%Increase2.svg11.32
Conservative G.W. Boult1,05241.75%Decrease2.svg7.22
Union Movement H Taylor1124.44%Decrease2.svg0.28
Majority30412.07%Increase2.svg5.59
Turnout 2,52025.07%Increase2.svg4.07
Registered electors 10,052
Labour hold Swing Increase2.svg9.27

1960

12 May 1960
PartyCandidateVotes%±%
Conservative R.W. Rollins1,08948.97%Increase2.svg9.14
Labour A Williams94542.49%Decrease2.svg12.20
Union Movement H Taylor1054.72%Steady2.svg N/A
Communist Anthony McLelland853.82%Decrease2.svg1.66
Majority1446.47%Decrease2.svg8.38
Turnout 2,22421.00%Decrease2.svg6.00
Registered electors 10,592
Conservative gain from Labour Swing Increase2.svg10.67

Elections of the 1950s

1959

7 May 1959
PartyCandidateVotes%±%
Labour Paul Orr1,61654.69%Increase2.svg2.22
Conservative A Lloyd1,17739.83%Increase2.svg6.77
Communist Anthony McLelland1625.48%Increase2.svg1.24
Majority43914.86%Decrease2.svg4.55
Turnout 2,95527.00%Decrease2.svg3.80
Registered electors 10,944
Labour hold Swing Decrease2.svg2.28

1958

8 May 1958
PartyCandidateVotes%±%
Labour P Maguire1,79552.47%Increase2.svg7.58
Conservative A McVeigh1,13133.06%Decrease2.svg4.25
Communist Anthony McLelland1454.24%Increase2.svg0.40
Majority66419.41%Increase2.svg11.84
Turnout 3,42130.80%Decrease2.svg1.43
Registered electors 11,108
Labour hold Swing Increase2.svg5.92

1957

9 May 1957
PartyCandidateVotes%±%
Labour C Morris1,67244.89%Decrease2.svg9.35
Conservative A McVeigh1,39037.32%Decrease2.svg2.93
Independent LabourL Murphy52013.96%Steady2.svg N/A
Communist Anthony McLelland1433.84%Decrease2.svg1.68
Majority2827.57%Decrease2.svg6.42
Turnout 3,72532.23%Increase2.svg0.79
Registered electors 11,557
Labour hold Swing Decrease2.svg3.21

1956

10 May 1956
PartyCandidateVotes%±%
Labour Paul Orr2,02354.24%Increase2.svg3.28
Conservative J.H.W. Stewart1,50140.24%Decrease2.svg3.03
Communist Anthony McLelland2065.52%Decrease2.svg0.25
Majority52213.99%Increase2.svg6.32
Turnout 3,73031.44%Decrease2.svg5.92
Registered electors 11,864
Labour hold Swing Increase2.svg3.16

1955

12 May 1955
PartyCandidateVotes%±%
Labour P Maguire2,33050.95%Decrease2.svg14.83
Conservative J.H.W. Stewart1,97942.28%Increase2.svg9.06
Communist Anthony McLelland2645.77%Steady2.svg N/A
Majority3517.68%Decrease2.svg23.89
Turnout 4,57337.36%Increase2.svg0.73
Registered electors 12,241
Labour hold Swing Decrease2.svg11.95

1954

13 May 1954
PartyCandidateVotes%±%
Labour L Murphy3,05765.78%Increase2.svg7.72
Conservative H.M. Dobbie1,59034.22%Decrease2.svg7.22
Majority1,46731.57%Decrease2.svg26.99
Turnout 4,64736.63%Decrease2.svg7.24
Registered electors 12,687
Labour hold Swing Increase2.svg7.22

1953

Cllr Thomas George Dominic Maguire died on 24 August 1953.

Abercromby By-election, 24 August 1953
PartyCandidateVotes%±%
Labour Kenneth Walter Consell2,49357.38%
Conservative Reginald John McLaughlin1,85242.62%
Majority64114.76%
Turnout 4,34533.83%
Registered electors 12,845
Labour hold Swing

The 1953 Municipal elections followed boundary changes resulting in all seats being contested.

7 May 1953 (3 seats)
PartyCandidateVotes%±%
Labour Harry Livermore3,30058.56%
Labour Thomas George Dominic Maguire3,13055.55%
Labour L. Murphy3,11555.28%
Conservative John Cheshire2,33544.44%
Conservative Abram Maxwell Caplin12,25640.04%
Conservative Francis Joseph Bullen2,23139.59%
Majority96517.13%
Turnout 5,63543.87%
Registered electors 12,845
Labour win (new seat)

1952

8 May 1952
PartyCandidateVotes%±%
Labour Harry Livermore3,56462.28%Increase2.svg15.68
Conservative John Kenneth Hart2,15937.72%Decrease2.svg15.68
Majority1,40524.55%Increase2.svg17.75
Turnout 5,72343.17%Increase2.svg5.13
Registered electors 13,256
Labour gain from Conservative Swing Increase2.svg15.68

1951

11 May 1951
PartyCandidateVotes%±%
Conservative Francis Joseph Bullen2,74053.40%Increase2.svg0.87
Labour William Smyth2,39146.60%Decrease2.svg0.87
Majority3496.80%Increase2.svg1.73
Turnout 5,13138.04%Decrease2.svg1.54
Registered electors 13,488
Conservative hold Swing Increase2.svg0.87

1950

11 May 1950
PartyCandidateVotes%±%
Conservative John Cheshire2,74752.53%Decrease2.svg1.54
Labour William Smyth2,48247.47%Increase2.svg5.38
Majority2655.07%Decrease2.svg6.92
Turnout 5,22939.58%Increase2.svg1.56
Registered electors 13,210
Conservative hold Swing Decrease2.svg3.46

Elections of the 1940s

1949

12 May 1949
PartyCandidateVotes%±%
Conservative John Kenneth Hart2,95454.07%Increase2.svg0.05
Labour Francis Lavery2,29942.08%Decrease2.svg3.89
Communist Mrs Olwyn White2103.84%Steady2.svg N/A
Majority65511.99%Increase2.svg3.94
Turnout 5,46338.03%Decrease2.svg3.19
Registered electors 14,366
Conservative gain from Labour Swing Decrease2.svg2.28

1947

1 November 1947
PartyCandidateVotes%±%
Conservative Francis Joseph Bullen3,16054.03%Increase2.svg2.37
Labour Harry Livermore2,68945.97%Decrease2.svg2.37
Majority4718.05%Increase2.svg4.74
Turnout 5,84941.22%Increase2.svg7.21
Registered electors 14,189
Conservative gain from Labour Swing

1946

1 November 1946
PartyCandidateVotes%±%
Conservative John Reginald Bevins 2,43551.65%Increase2.svg7.33
Labour Richard Clitherow2,27948.35%Decrease2.svg7.33
Majority1563.31%Decrease2.svg8.05
Turnout 4,71434.02%Decrease2.svg0.96
Registered electors 13,858

1945

1 November 1945
PartyCandidateVotes%±%
Labour Francis Lavery2,46655.68%
Labour Harry Livermore2,43955.07%
Conservative Joseph James E Sloan1,96344.32%
Conservative George Bowman1,96144.28%
Majority50311.36%
Turnout 4,42934.98%
Registered electors 12,663

Elections of the 1830s

Friday 1 November 1839 [6]
PartyCandidateVotes%±%
Conservative Christopher Bushell 318 50.64 Decrease2.svg 1.38
Whig Henry Ripley31049.36Increase2.svg 1.38
Majority81.27Decrease2.svg 2.77
Turnout 62883.18Decrease2.svg 2.64
Registered electors 755
Conservative gain from Whig Swing 1.38
Thursday 1 November 1838 [7]
PartyCandidateVotes%±%
Conservative Robertson Gladstone 296 52.02 Increase2.svg 2.53
Whig William Earle27347.98Decrease2.svg 2.53
Majority234.04Increase2.svg 3.03
Turnout 56985.82
Registered electors 663
Conservative gain from Whig Swing +2.53
Wednesday 1 November 1837 [8]
PartyCandidateVotes%±%
Whig Dr. James Carson250 50.51 Decrease2.svg 2.82
Conservative Thomas Kaye24549.49Increase2.svg 2.82
Majority51.01Decrease2.svg 5.66
Turnout 495
Registered electors
Whig hold Swing -2.82
Tuesday 1 November 1836 [9] [10]
PartyCandidateVotes%±%
Whig Thomas Brocklebank192 53.33 Decrease2.svg 2.53
Conservative Thomas Kaye16846.67Increase2.svg 2.53
Majority246.67Decrease2.svg5.05
Turnout 36063.38Decrease2.svg25.90
Registered electors 568
Whig hold Swing -2.53
Saturday 26 December 1835 [Note 2] [11] [12] [13]
PartyCandidateVotes%±%
Whig William Earle Jr. [Note 3] 186 55.86
Whig Dr James Carson 184 55.26
Whig Thomas Brocklebank 172 51.65
Conservative Robertson Gladstone 14744.14
Conservative Thomas Kaye14142.34
Conservative William Ripley12938.74
Majority3911.72
Turnout 33389.28
Registered electors 373
Whig win (new seat)
Whig win (new seat)
Whig win (new seat)

Notes

  1. Tony Hood, Jimmy Rutledge and Joe Devaney were surcharged and banned from office following the Rate-capping rebellion. Three seats were contested at the 1987 election.
  2. Following the establishment of the Liverpool Town Council under the provisions of the Municipal Corporations Act 1835 three members were elected.
  3. William Earle Jr. was a member of the preceding Liverpool Common Council who sought election to the Liverpool Town Council.

See also

Related Research Articles

<span class="mw-page-title-main">Tuebrook (Liverpool ward)</span> Former metropolitan borough council ward in Liverpool, England

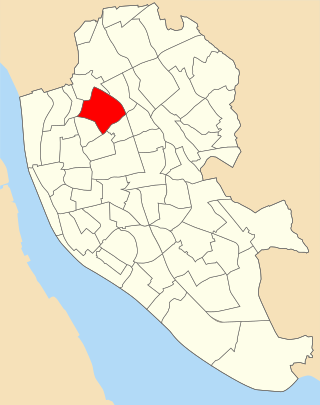
Tuebrook ward was an electoral district of Liverpool City Council centred on the Tuebrook district of Liverpool.

<span class="mw-page-title-main">Kensington and Fairfield (Liverpool ward)</span> Metropolitan borough council ward in England

Kensington & Fairfield ward is an electoral division of Liverpool City Council in the Liverpool Wavertree, Liverpool West Derby and Liverpool Riverside Parliamentary constituencies. The ward contains the Kensington and Fairfield areas of Liverpool.

<span class="mw-page-title-main">Grassendale and Cressington (Liverpool ward)</span> Metropolitan borough council ward in Liverpool, England

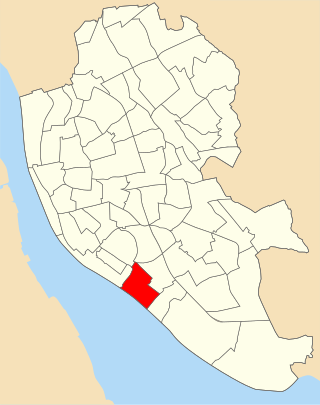
Grassendale and Cressington ward is an electoral division of Liverpool City Council in the Garston and Halewood Parliamentary constituency, in the Garston area of Liverpool.

<span class="mw-page-title-main">Church (Liverpool ward)</span> Metropolitan borough council ward in England

Church ward is an electoral district of Liverpool City Council. The ward is within the Liverpool Wavertree Parliamentary constituency.

<span class="mw-page-title-main">Warbreck (ward)</span> Former metropolitan borough council ward in Liverpool, England

Warbreck ward was an electoral division of Liverpool City Council containing parts of the Walton and Orrell Park areas of Liverpool.

<span class="mw-page-title-main">Picton (ward)</span> Former metropolitan borough council ward in Liverpool, England

Picton ward was an electoral division of Liverpool City Council centred on the Edge Hill, Liverpool district of Liverpool.

<span class="mw-page-title-main">Yew Tree (Liverpool ward)</span> Metropolitan Borough Council ward in Liverpool, England

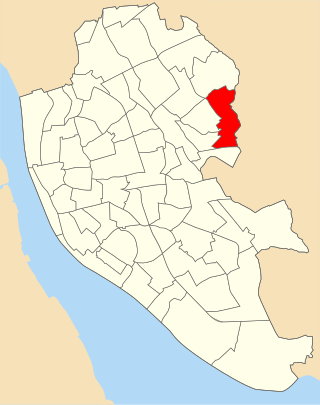
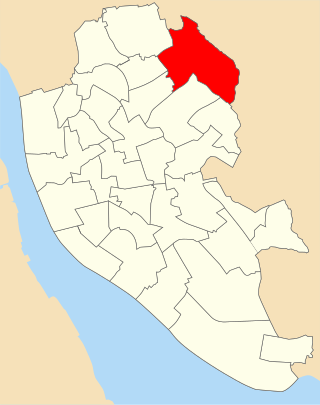
Yew Tree ward is an electoral division of Liverpool City Council within the Liverpool West Derby Parliamentary constituency.

<span class="mw-page-title-main">Woolton (ward)</span> Former ward of Liverpool City Council (UK)

Woolton ward was an electoral division of Liverpool City Council between 1953 and 1973, and 1980 and 2023. It and was centred on the Woolton district of Liverpool.

<span class="mw-page-title-main">Old Swan (ward)</span> Former metropolitan borough council ward in Liverpool, England

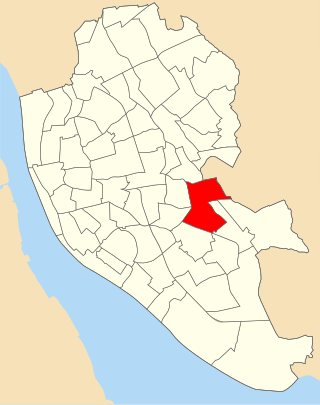
Old Swan ward was an electoral division of Liverpool City Council, centred on the Old Swan district of Liverpool.

<span class="mw-page-title-main">Fazakerley (ward)</span> Former metropolitan borough council ward in Liverpool, England

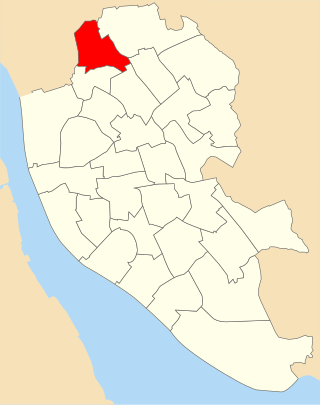
Fazakerley ward was an electoral division of Liverpool City Council between 1953 and 2022.

<span class="mw-page-title-main">Everton (ward)</span> Metropolitan borough council ward in Liverpool, England

Everton ward was an electoral division of Liverpool City Council in the Liverpool Walton Parliamentary constituency.

<span class="mw-page-title-main">Clubmoor (ward)</span> Metropolitan borough council ward in Liverpool, England

Clubmoor ward was an electoral division of Liverpool City Council in the Liverpool Walton Parliamentary constituency.

<span class="mw-page-title-main">Childwall (Liverpool ward)</span> Metropolitan borough council ward in Liverpool, England

Childwall ward is an electoral district of Liverpool City Council within the Liverpool Wavertree and Garston and Halewood Parliamentary constituencies.

<span class="mw-page-title-main">Anfield (Liverpool ward)</span> Metropolitan borough council ward in England

Anfield ward is an electoral district of Liverpool City Council centred on the Anfield district of Liverpool. The ward is within the Liverpool Walton Parliamentary constituency.

<span class="mw-page-title-main">Aigburth (Liverpool ward)</span> Metropolitan borough council ward in England

Aigburth ward is an electoral district of Liverpool City Council within the Liverpool Riverside Parliamentary constituency.

<span class="mw-page-title-main">Vauxhall (Liverpool ward)</span> Metropolitan borough council ward in Liverpool, England

Vauxhall ward is an electoral division of Liverpool City Council centred on the Vauxhall area of the city.

<span class="mw-page-title-main">Breckfield (ward)</span> Former electoral district of Liverpool

Breckfield ward was an electoral district of Liverpool City Council from 1895 until 2004. It was part of the Everton and Anfield districts of Liverpool.

<span class="mw-page-title-main">Smithdown (Liverpool ward)</span> Ward of the Liverpool City Council, in England

Smithdown ward is an electoral district of Liverpool City Council within the Liverpool Riverside and Liverpool Wavertree constituencies.

<span class="mw-page-title-main">Gillmoss (Liverpool ward)</span> Former ward of Liverpool City Council (UK)

Gillmoss ward was an electoral division of Liverpool City Council between 1953 and 2004. It and was centred on the Croxteth district of Liverpool.

<span class="mw-page-title-main">Valley (Liverpool ward)</span> Former ward of Liverpool City Council (UK)

Valley ward was an electoral division of Liverpool City Council between 1980 and 2004. It and was centred on the Netherley district of Liverpool.

References

  1. B.R. Davies (16 December 1860). Weekly Dispatch Atlas (Map).
  2. The City of Liverpool (Electoral Arrangements) Order 1979
  3. "Report No.319" (PDF). Local Government Boundary Commission For England. Archived from the original (PDF) on 20 March 2022.
  4. "The City of Liverpool (Electoral Changes) Order 2003". 29 September 2003. Retrieved 15 May 2023.
  5. "Liverpool City Council elections 1973-2012" (PDF). The Elections Centre, University of Plymouth. 16 May 2018.
  6. Liverpool Mercury . Liverpool. 8 November 1839.
  7. Liverpool Mercury . Liverpool. 2 November 1838.
  8. The Albion. Liverpool. 6 November 1837.
  9. The Albion. Liverpool. 7 November 1836.
  10. Liverpool Mercury and Lancashire General Advertiser . Liverpool. 4 November 1836.
  11. The Albion. Liverpool. 28 December 1835.
  12. Liverpool Courier . Liverpool. 30 December 1835.
  13. Liverpool Mercury . Liverpool. 1 January 1836.