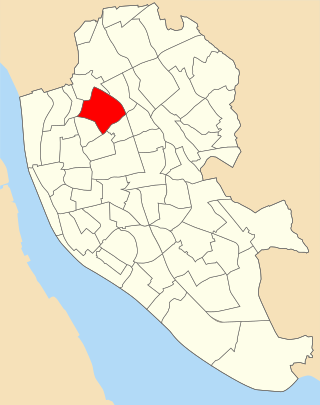
1980 boundaries
A report of the Local Government Boundary Commission for England published in November 1978 set out proposals for changes to the wards of Liverpool City Council, maintaining the number of councillors at 99 representing 33 wards. Gillmoss ward was retained to be represented by three councillors. [3]
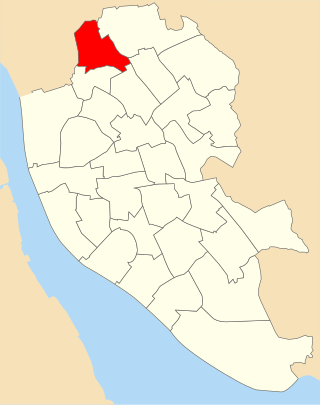
The report describes the boundaries of Gillmoss ward as "Commencing at a point where Muirhead Avenue East meets Stalisfield Avenue, thence northwestwards along said Stalisfield Avenue to Dencourt Road, thence northeastwards along said road to Marcham Way, thence northwards along said way to Mentmore Crescent, thence northweatwards and northwards along said crescent to Marshfield Road, thence northeastwards along, said road to Eldersfield Road, thence northwestwards along said road and Whinhowe Road to Carr Lane, thence southwestwaafds along said lane to Sandway-Crescent (western access), thence generally northeastwards along said crescent to Carsington Road, thence northwards along said road to Utting Avenue East, thence northeastwards along said avenue to Lower House Lane, thence northwestwards along said lane to the southern boundary of Fazakerley Ward, thence northeastwards along said boundary and northwestwards along the eastern boundary of said ward to the northeastern boundary of the City, thence eastwards, northwards and generally southeastwards along said boundary to the access way to the southwest of the properties in the road known as Marled Hey, thence northwestwards along said access way to Waterpark Drive, thence southwestwards along said drive to NG ref SJ 4195093696, thence northwestwards in a straight line passing through NG ref SJ 4186993767 to the River Alt, thence continuing-northweotwards along said river to a point being the prolongation northeastwards of Oak Lane, thence southwestwards along said prolongation, said lane and Muirhead Avenue East to the point of commencement". [4]
The ward was part of the Liverpool West Derby Parliamentary constituency. [1]