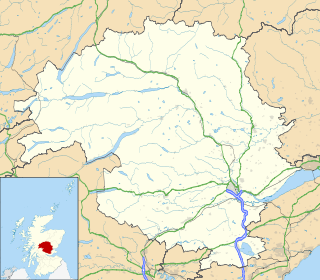
Perth and Kinross is one of the 32 council areas of Scotland, and a lieutenancy area. It is bordered by Highland and Aberdeenshire to the north, Angus, Dundee, and Fife to the east, Clackmannanshire to the south, and Stirling and Argyll and Bute to the west.

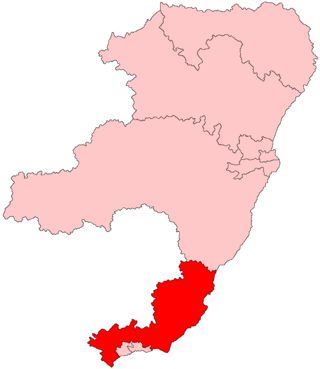
Ochil and South Perthshire was a county constituency of the House of Commons of the Parliament of the United Kingdom. It elected one Member of Parliament (MP) by the first-past-the-post system of election.

Perth and North Perthshire was a county constituency of the House of Commons of the Parliament of the United Kingdom. It elected one Member of Parliament (MP) by the first past the post system of election. The constituency was created in 2005.
Angus was a constituency of the Scottish Parliament (Holyrood). It elected one Member of the Scottish Parliament (MSP) by the first past the post method of election. Also, however, it was one of nine constituencies in the North East Scotland electoral region, which elects seven additional members, in addition to nine constituency MSPs, to produce a form of proportional representation for the region as a whole.

Perth and Kinross Council is the local authority for Perth and Kinross, one of the 32 council areas of Scotland. The council has been under no overall control since 1999. It is based in Perth.
Ewan Dow is a former Scottish politician.

Perthshire South and Kinross-shire is a constituency of the Scottish Parliament (Holyrood) covering part of the council area of Perth and Kinross. It elects one Member of the Scottish Parliament (MSP) by the plurality method of election. It is one of nine constituencies in the Mid Scotland and Fife electoral region, which elects seven additional members, in addition to the nine constituency MSPs, to produce a form of proportional representation for the region as a whole.

Alexander James Stewart is a Scottish Conservative Party politician who has been a Member of the Scottish Parliament (MSP) for the Mid Scotland and Fife region since 2016.
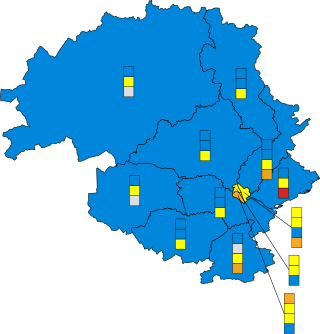
The 2017 Perth and Kinross Council election was held on 4 May 2017, the same day as the other Scottish local government elections. The election covered the twelve wards created as a result of the Local Governance (Scotland) Act 2004, with each ward electing three or four councillors using the single transferable vote system form of proportional representation, with 40 Councillors being elected, a reduction of 1 member compared to 2012.

Strathmore is one of the twelve wards used to elect members of the Perth and Kinross Council. It elects four Councillors.

Blairgowrie and Glens is one of the twelve wards used to elect members of the Perth and Kinross Council. It elects three Councillors.

Highland is one of the twelve wards used to elect members of the Perth and Kinross Council. It elects three Councillors.

Strathtay is one of the twelve wards used to elect members of the Perth and Kinross Council. It elects three Councillors.

Strathearn is one of the twelve wards used to elect members of the Perth and Kinross Council. It elects three Councillors.

Strathallan is one of the twelve wards used to elect members of the Perth and Kinross Council. It elects three Councillors.

Kinross-shire is one of the twelve wards used to elect members of the Perth and Kinross Council. It elects four Councillors.

Almond and Earn is one of the twelve wards used to elect members of the Perth and Kinross Council. It elects three Councillors.
Perth City South is one of the twelve wards used to elect members of the Perth and Kinross Council. It elects four Councillors.

Perth City North is one of the twelve wards used to elect members of the Perth and Kinross Council. It elects three Councillors.

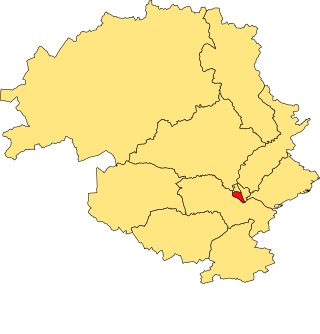
Perth City Centre is one of the twelve wards used to elect members of the Perth and Kinross Council. It elects four Councillors.