This article needs additional citations for verification .(April 2016) |
| |||||||||||||||||
24 of 70 seats (one third) to Bristol City Council 36 seats needed for a majority | |||||||||||||||||
---|---|---|---|---|---|---|---|---|---|---|---|---|---|---|---|---|---|
| |||||||||||||||||
2003 local election results in Bristol | |||||||||||||||||
|
The 2003 Bristol City Council election took place on 1 May 2003, on the same day as other local elections in the UK. The Labour Party made a number of losses, mainly to the Liberal Democrats, and lost overall control of the council. [1] Loses included Council leader Diane Bunyan, who lost her Windmill Hill seat to the Liberal Democrats. [2] This year also saw elections contested by the new Bristolian Party, founded by the local 'scandal sheet' The Bristolian , though they failed to win any seats. [3]
Party | Candidate | Votes | % | |
---|---|---|---|---|
Liberal Democrats | Shirley Marshall | 1,313 | 41.62 | |
Labour | Helga Christine Benson | 746 | 23.65 | |
Bristolian | Darryl Malcolm Wandless | 343 | 10.87 | |
Green | David Mark Simpson | 335 | 10.62 | |
Socialist Alliance | Anne Martha Lemon | 202 | 6.40 | |
Conservative | Richard James Manns | 151 | 4.79 | |
Socialist Labour | Bernard Joseph Kennedy | 65 | 2.06 | |
Majority | 567 | 17.97 | ||
Liberal Democrats gain from Labour | ||||
Party | Candidate | Votes | % | |
---|---|---|---|---|
Labour | Peter John Crispin | 1,001 | 31.70 | |
Independent | Stewart Robert Parkman | 508 | 16.09 | |
Conservative | Christian Virginia Jessie Simpson | 436 | 13.81 | |
Liberal Democrats | Paul Elvin | 386 | 12.22 | |
Bristolian | Julie Anne Palmer | 319 | 10.10 | |
BNP | Clive Courtney | 310 | 9.82 | |
Green | Peter Murray Andrews | 198 | 6.27 | |
Majority | 493 | 15.61 | ||
Labour hold |
Party | Candidate | Votes | % | |
---|---|---|---|---|
Conservative | Richard Stephen Eddy | 2,119 | 63.63 | |
Labour | Julie Watts | 735 | 22.07 | |
BNP | David John Millard | 195 | 5.86 | |
Liberal Democrats | Jean Althea Lemin | 190 | 5.71 | |
Green | Barrie Robert Lewis | 91 | 2.73 | |
Majority | 1,384 | 41.56 | ||
Conservative hold |
Party | Candidate | Votes | % | |
---|---|---|---|---|
Labour | Peter Thomas James Begley | 1,165 | 40.28 | |
Conservative | Vincent James Mora | 839 | 29.01 | |
Liberal Democrats | Jeffery Exon | 448 | 15.49 | |
BNP | John Alan Jarvis | 293 | 10.13 | |
Green | David Simon Coombes | 103 | 3.56 | |
Socialist Labour | Brian Andrew Corbett | 44 | 1.52 | |
Majority | 326 | 11.27 | ||
Labour hold |
Party | Candidate | Votes | % | |
---|---|---|---|---|
Liberal Democrats | Jackie Norman | 1,573 | 56.16 | |
Labour | Terry Cook | 611 | 21.81 | |
Conservative | Colin Robert Bretherton | 442 | 15.78 | |
Green | Mary Beryl Wood | 175 | 6.25 | |
Majority | 962 | 34.35 | ||
Liberal Democrats hold |
Party | Candidate | Votes | % | |
---|---|---|---|---|
Liberal Democrats | Anne Pauline White | 981 | 52.83 | |
Labour | Brian Peter Mead | 290 | 15.62 | |
Conservative | Ian Jenkins Dennis | 233 | 12.55 | |
Bristolian | Richard Miles Higgs | 178 | 9.59 | |
Green | Lela Helen McTernan | 175 | 9.42 | |
Majority | 691 | 37.21 | ||
Liberal Democrats hold |
Party | Candidate | Votes | % | |
---|---|---|---|---|
Liberal Democrats | Barbara Janke | 1,499 | 57.19 | |
Conservative | Ian Darsie Millard | 538 | 20.53 | |
Labour | Andrew Mandeville Butterly | 304 | 11.60 | |
Green | Arjuna Krishna-Das | 171 | 6.52 | |
Bristolian | Bear Hackenbush | 109 | 4.16 | |
Majority | 961 | 36.66 | ||
Liberal Democrats hold |
Party | Candidate | Votes | % | |
---|---|---|---|---|
Liberal Democrats | Geoffrey Robert Jones | 996 | 45.07 | |
Conservative | Stephen Christopher O'Keefe | 714 | 32.31 | |
Labour | Dave Sutton | 257 | 11.63 | |
Green | John Mark Hills | 152 | 6.88 | |
Bristolian | Kevin Richard Bainbridge | 91 | 4.12 | |
Majority | 282 | 12.76 | ||
Liberal Democrats hold |
Party | Candidate | Votes | % | |
---|---|---|---|---|
Liberal Democrats | Evelyn Mary Elworthy | 1,257 | 52.35 | |
Conservative | Alistair Peter Lindsay Watson | 395 | 16.45 | |
Labour | Judith Sluglett | 386 | 16.08 | |
Green | Geoff Collard | 363 | 15.12 | |
Majority | 862 | 35.90 | ||
Liberal Democrats hold |
Party | Candidate | Votes | % | |
---|---|---|---|---|
Liberal Democrats | John Francis Kelly | 1,298 | 46.21 | |
Labour | Raja Khalid | 603 | 21.47 | |
Bristolian | Jane Marie Nicholl | 427 | 15.20 | |
Green | Samantha Elizabeth Pullinger | 264 | 9.40 | |
Conservative | Seva Singh | 118 | 4.20 | |
Socialist Alliance | Houri Ghamian | 99 | 3.52 | |
Majority | 695 | 24.74 | ||
Liberal Democrats hold |
Party | Candidate | Votes | % | |
---|---|---|---|---|
Liberal Democrats | Muriel Cole | 1,145 | 40.35 | |
Labour | Malcolm Patterson | 781 | 27.52 | |
Conservative | Jonathan Arthur Thorne | 498 | 17.55 | |
Green | Martin Cottingham | 299 | 10.54 | |
Independent | Robert Hansjurg Paterson | 155 | 4.05 | |
Majority | 364 | 12.83 | ||
Liberal Democrats hold |
Party | Candidate | Votes | % | |
---|---|---|---|---|
Liberal Democrats | Ian Robert Cooper | 1,293 | 57.16 | |
Labour | Mary Catherine Smith | 614 | 27.14 | |
Bristolian | Andrew Francis Lovell Cocks | 167 | 7.38 | |
Conservative | Jonathan Robert Hucker | 127 | 5.61 | |
Green | Mary Elizabeth Thompson | 61 | 2.70 | |
Majority | 679 | 30.02 | ||
Liberal Democrats gain from Labour | ||||
Party | Candidate | Votes | % | |
---|---|---|---|---|
Conservative | Lesley Ann Alexander | 1,602 | 47.03 | |
Labour | Edmund John Bramall | 1,175 | 34.50 | |
Liberal Democrats | Roland Ivor Potts | 481 | 14.12 | |
Green | Tony John Gosling | 148 | 4.35 | |
Majority | 427 | 12.53 | ||
Conservative gain from Labour | ||||
Party | Candidate | Votes | % | |
---|---|---|---|---|
Labour | Mark Royston Brain | 996 | 42.49 | |
Conservative | Shirley Diane Hodges | 894 | 38.14 | |
Liberal Democrats | Joyce Rosaline Mary Cooper | 366 | 15.61 | |
Green | Stephen Petter | 88 | 3.75 | |
Majority | 102 | 4.35 | ||
Labour hold |
Party | Candidate | Votes | % | |
---|---|---|---|---|
Liberal Democrats | Jos Clark | 1,600 | 51.83 | |
Conservative | Roy Devid Pepworth | 696 | 22.55 | |
Labour | Richard Anthony Hughes | 695 | 22.51 | |
Green | Nicholas Owain Thomas | 96 | 3.11 | |
Majority | 904 | 29.28 | ||
Liberal Democrats hold |
Party | Candidate | Votes | % | |
---|---|---|---|---|
Labour | Graham Roy Robertson | 1,057 | 43.36 | |
Liberal Democrats | John Patrick Hassell | 726 | 29.78 | |
Conservative | Lindsay Clare Elliott | 655 | 26.87 | |
Majority | 331 | 13.58 | ||
Labour hold |
Party | Candidate | Votes | % | |
---|---|---|---|---|
Liberal Democrats | Christopher Davies | 1,952 | 59.58 | |
Labour | Philip John Stephen Gibby | 717 | 21.89 | |
Conservative | Jennifer Rogers | 315 | 9.62 | |
Green | Graham Hugh Davey | 179 | 5.46 | |
Socialist Alliance | Clare Hall | 113 | 3.45 | |
Majority | 1,235 | 37.69 | ||
Liberal Democrats gain from Labour | ||||
Party | Candidate | Votes | % | |
---|---|---|---|---|
Liberal Democrats | John Richard Astley | 1,150 | 46.30 | |
Labour | Carrie Martin | 873 | 35.14 | |
Bristolian | Julien George Weston | 215 | 8.66 | |
Conservative | Guy Neale Dawe | 149 | 6.00 | |
Green | Michael Crawford | 97 | 3.90 | |
Majority | 277 | 11.16 | ||
Liberal Democrats hold |
Party | Candidate | Votes | % | |
---|---|---|---|---|
Labour | Linda Ruth Slater | 1,294 | 40.94 | |
Green | Charles Nicholas Bolton | 923 | 29.20 | |
Conservative | Anthony James Smith | 419 | 13.26 | |
Liberal Democrats | Andrew Kybert | 306 | 9.68 | |
Bristolian | Merv Woolford | 159 | 5.03 | |
Socialist Alternative | Mark Ian Baker | 60 | 1.90 | |
Majority | 371 | 11.74 | ||
Labour hold |
Party | Candidate | Votes | % | |
---|---|---|---|---|
Labour | Margaret Ann Shovelton | 1,030 | 38.66 | |
Conservative | Matthew James Denyer | 914 | 34.31 | |
Liberal Democrats | Gordon Henry Draper | 469 | 17.61 | |
Bristolian | Andrew James Way | 144 | 5.41 | |
Green | Donald Brown | 107 | 4.02 | |
Majority | 116 | 4.35 | ||
Labour hold |
Party | Candidate | Votes | % | |
---|---|---|---|---|
Labour | John Edward Deasy | 1,044 | 44.92 | |
Liberal Democrats | Gordon Lennox Williams | 525 | 22.59 | |
Conservative | Charles William Alexander | 438 | 18.85 | |
Bristolian | John Edward Francom | 182 | 7.83 | |
Green | David Mowat | 135 | 5.81 | |
Majority | 519 | 22.33 | ||
Labour hold |
Party | Candidate | Votes | % | |
---|---|---|---|---|
Conservative | Jack Lopresti | 1,753 | 51.30 | |
Labour | Susan Milestone | 741 | 21.69 | |
Liberal Democrats | Robert Ian Johnston | 511 | 14.95 | |
BNP | Dianne Mary Carr | 330 | 9.66 | |
Green | Royston Clifford Gallop | 82 | 2.40 | |
Majority | 1,012 | 29.61 | ||
Conservative hold |
Party | Candidate | Votes | % | |
---|---|---|---|---|
Labour | Helen Holland | 910 | 35.15 | |
Liberal Democrats | Nicholas Lance Doddrell | 878 | 33.90 | |
Conservative | Kathryn Elizabeth Morris | 740 | 28.57 | |
Green | Daniella Elsa Radice | 62 | 2.39 | |
Majority | 32 | 1.24 | ||
Labour hold |
Party | Candidate | Votes | % | |
---|---|---|---|---|
Liberal Democrats | Mark Bailey | 1,558 | 46.42 | |
Labour | Diane Elizabeth Bunyan | 917 | 27.32 | |
Green | Patrick Dorian Hulme | 327 | 9.74 | |
Conservative | Graham David Morris | 229 | 6.82 | |
Bristolian | Roy Norris | 226 | 6.73 | |
Socialist Alliance | Sharon Mary Foley | 99 | 2.95 | |
Majority | 641 | 19.10 | ||
Liberal Democrats gain from Labour | ||||
Bristol City Council is the local authority of Bristol, England. The council is a unitary authority, and is unusual in the United Kingdom in that its executive function is controlled by a directly elected mayor of Bristol. Bristol has 35 wards, electing a total of 70 councillors.
The city of Bristol, England, is a unitary authority, represented by four MPs representing seats wholly within the city boundaries. As well as these, Filton and Bradley Stoke covers the northern urban fringe in South Gloucestershire and the north eastern urban fringe is in the Kingswood constituency. The overall trend of both local and national representation became left of centre during the latter 20th century, but there was a shift to the right in the 2010 general election. The city has a tradition of local activism, with environmental issues and sustainable transport being prominent issues in the city.
The Liberal Democrats are a liberal political party in the United Kingdom. The party has 13 Members of Parliament in the House of Commons, 84 members of the House of Lords, four Members of the Scottish Parliament, one member in the Welsh Senedd and two members in the London Assembly. The party served as the junior party in a coalition government with the Conservative Party between 2010–2015, with Scottish Labour in the Scottish Executive from 1999 to 2007, and with Welsh Labour in the Welsh Government from 2000 to 2003 and from 2016 to 2021.
The Leeds City Council election took place on 2 May 2002 to elect members of City of Leeds Metropolitan Borough Council in West Yorkshire, England. Prior to the election, there had been several by-elections held with no change to the council composition. One third of the council was up for election and the Labour party stayed in overall control of the council.
The 2000 Southampton Council election took place on 4 May 2000 to elect members of Southampton Unitary Council in Hampshire, England. One third of the council was up for election and the Labour Party lost overall control of the council to no overall control.
The 2008 Cheltenham Council election took place on 1 May 2008 to elect members of Cheltenham Borough Council in Gloucestershire, England. Half of the council was up for election and the council stayed under no overall control.
The 2007 Southampton Council election took place on 3 May 2007 to elect members of Southampton Unitary Council in Hampshire, England. One third of the council was up for election and the council stayed under no overall control.
The 1999 Pendle Borough Council election took place on 6 May 1999 to elect members of Pendle Borough Council in Lancashire, England. One third of the council was up for election and the Liberal Democrats lost overall control of the council to no overall control.
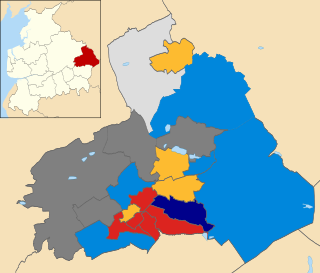
The 2008 Pendle Borough Council election took place on 1 May 2008 to elect members of Pendle Borough Council in Lancashire, England. One third of the council was up for election and the Liberal Democrats lost overall control of the council to no overall control.
The 2003 Wealden District Council election took place on 1 May 2003 to elect members of Wealden District Council in East Sussex, England. The whole council was up for election with boundary changes since the last election in 1999 reducing the number of seats by 3. The Conservative Party stayed in overall control of the council.
The 2013 United Kingdom local elections took place on Thursday 2 May 2013. Elections were held in 35 English councils: all 27 non-metropolitan county councils and eight unitary authorities, and in one Welsh unitary authority. Direct mayoral elections took place in Doncaster and North Tyneside. These elections last took place on the 4 June 2009 at the same time as the 2009 European Parliament Elections, except for County Durham, Northumberland and the Anglesey where elections last took place in 2008.
The Norfolk County Council election took place across Norfolk on 2 May 2013, coinciding with local elections for all county councils in England. The results were announced the following day, Friday 3 May 2013. The result brought to an end 12 years of Conservative administration, who finished three seats short of a majority after losing 20 seats, leaving the Council in no overall control (NOC). UKIP and the Labour Party both made gains of 14 and 11 seats respectively. The Liberal Democrats and the Green Party both lost three seats each, whilst an independent won a single seat in North Norfolk.
The 2003 South Kesteven District Council election took place on 1 May 2003 to elect members of South Kesteven District Council in Lincolnshire, England. The whole council was up for election and the Conservative party gained control of the council from no overall control.
The 2016 Newcastle City Council Council elections took place on 5 May 2016 to elect one third of the members of Newcastle City Council in England. The elections took place on the same day as other local elections.
The 2016 Bristol City Council election took place on Thursday 5 May 2016, alongside nationwide local elections. Following a boundary review, the number of wards in the City was reduced to 34, with each electing one, two or three Councillors. The overall number of Councillors remained 70, with all seats up for election at the same time. Elections would then be held every 4 years.
The 1999 Bristol City Council election took place on 6 May 1999, on the same day as other local elections. All seats were up for election due to boundary changes, with each ward electing 2 councillors. The total number of seats on the council increased by 2 due to the creation of a new ward: Clifton East.
The 2006 Bristol City Council election took place on 4 May 2006, on the same day as other local elections. The Labour Party continued to lose seats, but the Liberal Democrats failed to gain enough to form an overall majority. This election saw the first election of a Green Councillor to Bristol City Council – the first time four parties had been represented since the Council’s creation.
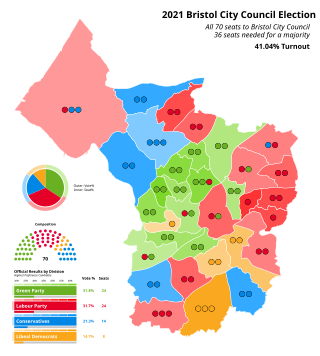
The 2021 Bristol City Council election took place on 6 May 2021 to elect members of Bristol City Council in England. It coincided with nationwide local elections. Voters in the city also voted for the mayor of Bristol, the mayor of West of England and for Avon and Somerset's police and crime commissioner. The election was originally due to take place in May 2020, but was postponed due to the COVID-19 pandemic.
The 2021 Cambridgeshire County Council election took place on 6 May 2021 as part of the 2021 local elections in the United Kingdom. All 61 councillors were elected from 59 electoral divisions, which returned either one or two county councillors each by first-past-the-post voting for a four-year term of office. The election was held alongside a full election for Cambridge City Council, the Cambridgeshire Police and Crime Commissioner, Mayor of Cambridgeshire and Peterborough and one-third of Peterborough City Council.