District result maps
 2010 results map
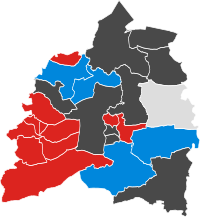 2011 results map
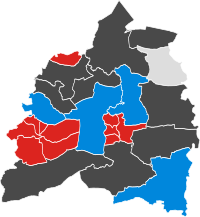 2012 results map
 2014 results map
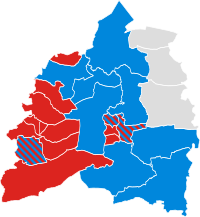 2015 results map
 2019 results map
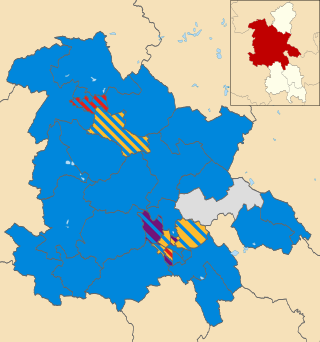
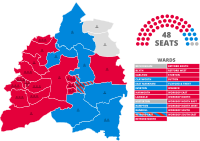 2023 results map
Bassetlaw District Council elections are held every four years. Prior to 2015, elections were generally held three years out of every four, with a third of the council being elected each time. Bassetlaw District Council is the local authority for the non-metropolitan district of Bassetlaw in Nottinghamshire, England. Since the last boundary changes in 2002, 48 councillors have been elected from 25 wards. [1]
| Year | Party in control | Turnout | SEATS | VOTE % | Notes | |||||||||
|---|---|---|---|---|---|---|---|---|---|---|---|---|---|---|
| Lab | Con | LD | Ind | Oth | Lab | Con | LD | Ind | Oth | |||||
| 1973 | Labour | 48.1% | 29 | 11 | 0 | 11 | 43.9% | 24.4% | 0.0% | 27.8% | 3.8% | |||
| 1976 | No overall control | 47.3% | 18 | 24 | 0 | 9 | 31.9% | 37.8% | 5.9% | 17.6% | 6.8% | |||
| 1979 | Labour | 76.9% | 29 | 17 | 0 | 4 | 46.6% | 37.3% | 5.5% | 8.5% | 2.1% | New ward boundaries | ||
| 1980 | Labour | 43.2% | 31 | 15 | 0 | 4 | 53.7% | 30.6% | 4.7% | 9.4% | 1.7% | |||
| 1982 | Labour | 40.5% | 28 | 14 | 1 | 7 | 37.1% | 34.9% | 23.9% | 4.0% | 0.0% | |||
| 1983 | Labour | 45.4% | 27 | 19 | 1 | 3 | 46.0% | 37.5% | 13.6% | 2.9% | 0.0% | |||
| 1984 | Labour | 46.3% | 26 | 17 | 0 | 7 | 52.3% | 36.6% | 9.8% | 0.9% | 0.4% | |||
| 1986 | Labour | 43.8% | 27 | 19 | 0 | 4 | 49.2% | 33.3% | 11.8% | 2.2% | 3.5% | |||
| 1987 | Labour | 48.1% | 27 | 18 | 0 | 1 | 45.8% | 33.2% | 14.4% | 3.7% | 2.9% | |||
| 1988 | Labour | 42.1% | 26 | 19 | 0 | 5 | 55.8% | 35.9% | 4.4% | 0.6% | 3.4% | |||
| 1990 | Labour | 50.2% | 29 | 15 | 1 | 5 | 61.6% | 27.3% | 6.8% | 3.4% | 0.9% | |||
| 1991 | Labour | 42.2% | 29 | 15 | 1 | 5 | 51.4% | 27.6% | 7.7% | 11.7% | 1.6% | |||
| 1992 | Labour | 36.6% | 30 | 17 | 1 | 2 | 44.9% | 43.3% | 6.6% | 5.2% | 0.0% | |||
| 1994 | Labour | 39.6% | 30 | 16 | 2 | 2 | 59.1% | 23.5% | 9.9% | 7.6% | 0.0% | |||
| 1995 | Labour | 35.2% | 33 | 12 | 2 | 3 | 62.1% | 25.1% | 6.4% | 3.4% | 3.0% | |||
| 1996 | Labour | 29.9% | 34 | 6 | 3 | 5 | 59.1% | 22.5% | 5.9% | 12.4% | 0.0% | |||
| 1998 | Labour | 25.7% | 35 | 8 | 3 | 4 | 54.1% | 35.4% | 8.6% | 0.0% | 2.0% | |||
| 1999 | Labour | 26.3% | 32 | 12 | 3 | 3 | 50.3% | 34.9% | 8.4% | 3.6% | 2.8% | |||
| 2000 | Labour | 25.8% | 31 | 14 | 3 | 2 | 44.6% | 41.8% | 10.1% | 2.5% | 1.0% | |||
| 2002 | Labour | 29.7% | 28 | 16 | 3 | 1 | 41.1% | 40.0% | 8.3% | 7.6% | 3.0% | New ward boundaries | ||
| 2003 | Labour | 27.3% | 25 | 19 | 2 | 2 | 38.3% | 40.1% | 6.9% | 11.8% | 2.9% | |||
| 2004 | No overall control | 42.1% | 18 | 24 | 1 | 5 | 42.2% | 40.9% | 4.5% | 12.4% | - | |||
| 2006 | Conservative | 40.4% | 14 | 28 | 1 | 5 | 46.3% | 46.4% | - | 6.5% | 0.8% | |||
| 2007 | Conservative | 32.1% | 16 | 27 | 0 | 5 | 45.9% | 46.8% | 0.7% | 6.6% | - | |||
| 2008 | Conservative | 32.3% | 16 | 30 | 0 | 2 | 39.9% | 47.9% | - | 11.1% | 1.2% | |||
| 2010 | Conservative | 62.1% | 25 | 20 | 0 | 3 | 55.4% | 36.5% | 2.1% | 5.3% | 0.7% | |||
| 2011 | Labour | 42.0% | 27 | 18 | 0 | 3 | 62.7% | 34.0% | 1.2% | 2.1% | - | |||
| 2012 | Labour | 32.2% | 34 | 11 | 0 | 3 | 65.8% | 29.1% | 1.3% | 3.7% | - | |||
| 2014 | Labour | 32.6% | 35 | 10 | 0 | 3 | 49.8% | 19.5% | 1.5% | 2.9% | 26.3% | |||
| 2015 | Labour | 63.7% | 33 | 12 | 0 | 3 | 0 | 41.1% | 33.8% | 1.4% | 4.0% | 19.7% | ||
| 2019 | Labour | 30.0% | 37 | 5 | 1 | 5 | 0 | 45.4% | 29.0% | 4.7% | 13.0% | 8.0% | ||
| 2023 | Labour | 31.5% | 38 | 8 | 0 | 2 | 0 | 47.1% | 35.5% | 4.0% | 9.5% | 3.9% | ||


| Party | Candidate | Votes | % | ±% | |
|---|---|---|---|---|---|
| Conservative | Mike Quigley | 788 | 54.6 | +5.1 | |
| Labour | Susan Shaw | 492 | 34.1 | −5.3 | |
| Liberal Democrats | Elizabeth Dobbie | 163 | 11.3 | +0.2 | |
| Majority | 296 | 20.5 | |||
| Turnout | 1,443 | 24.8 | |||
| Conservative gain from Labour | Swing | ||||
| Party | Candidate | Votes | % | ±% | |
|---|---|---|---|---|---|
| Conservative | 335 | 87.5 | +58.0 | ||
| Labour | 48 | 12.5 | +12.5 | ||
| Majority | 287 | 75.0 | |||
| Turnout | 383 | 24.0 | |||
| Conservative gain from Liberal Democrats | Swing | ||||
| Party | Candidate | Votes | % | ±% | |
|---|---|---|---|---|---|
| Labour | Sylvia May | 815 | 51.98 | +4.22 | |
| Conservative | Alec Thorpe | 669 | 42.67 | −10.59 | |
| Liberal Democrats | Leon Maurice Duveen | 84 | 5.36 | +5.36 | |
| Turnout | 1,568 | 28.5 | |||
| Party | Candidate | Votes | % | ±% | |
|---|---|---|---|---|---|
| Labour | Gloria June Evans | 1,345 | 82.31 | ||
| Conservative | Tracey Lee Taylor | 182 | 11.14 | ||
| Independent | Richard Vernon Bennett | 68 | 4.16 | ||
| Liberal Democrats | Mark Peter Hunter | 39 | 2.39 | ||
| Turnout | 1,634 | 27.53 | |||
| Party | Candidate | Votes | % | ±% | |
|---|---|---|---|---|---|
| Labour | John William Henry Anderton | 1,198 | 74.04 | ||
| Conservative | Barry Albert Bowles | 317 | 19.59 | ||
| Independent | Geoffrey Ernest Coe | 75 | 4.64 | ||
| Liberal Democrats | Mark Peter Hunter | 28 | 1.73 | ||
| Turnout | 1,618 | 32.09 | |||
| Party | Candidate | Votes | % | ±% | |
|---|---|---|---|---|---|
| Labour | Clayton Tindle | 1,004 | 77.3 | +21.1 | |
| Conservative | Lewis Antony Stanniland | 197 | 15.2 | +15.2 | |
| Liberal Democrats | Leon Maurice Duveen | 98 | 7.5 | +7.5 | |
| Turnout | 23.28 | ||||
| Conservative hold | Swing | ||||
| Party | Candidate | Votes | % | ±% | |
|---|---|---|---|---|---|
| Labour | Matthew Callingham | 441 | 49.9 | +12.6 | |
| Conservative | Emma Auckland | 296 | 33.5 | +4.8 | |
| Liberal Democrats | Helen Tamblyn-Saville | 146 | 16.5 | +3.7 | |
| Majority | 145 | 16.4 | |||
| Turnout | 883 | ||||
| Labour hold | Swing | ||||
| Party | Candidate | Votes | % | ±% | |
|---|---|---|---|---|---|
| Conservative | Gerald Bowers | 454 | 63.0 | +34.0 | |
| Independent | Michael Gray | 193 | 26.8 | +1.7 | |
| Liberal Democrats | Leon Duveen | 74 | 10.3 | +3.9 | |
| Majority | 261 | 36.2 | |||
| Turnout | 721 | ||||
| Conservative gain from Labour | Swing | ||||
| Party | Candidate | Votes | % | ±% | |
|---|---|---|---|---|---|
| Conservative | Denise Depledge | 422 | 63.7 | +37.3 | |
| Labour | Laura Sanders | 134 | 20.2 | +8.2 | |
| Liberal Democrats | Richard Harris | 107 | 16.1 | +16.1 | |
| Majority | 288 | 43.4 | |||
| Turnout | 663 | ||||
| Conservative gain from Independent | Swing | ||||
| Party | Candidate | Votes | % | ±% | |
|---|---|---|---|---|---|
| Conservative | Lewis Stanniland | 745 | 57.7 | +14.2 | |
| Labour | David Naylor | 472 | 36.5 | +16.9 | |
| Liberal Democrats | James Nixon | 75 | 5.8 | +5.8 | |
| Majority | 273 | 21.1 | |||
| Turnout | 1,292 | ||||
| Conservative hold | Swing | ||||
| Party | Candidate | Votes | % | ±% | |
|---|---|---|---|---|---|
| Conservative | Mike Introna | 493 | 40.1 | +22.5 | |
| Independent | Helen Richards | 488 | 39.7 | +39.7 | |
| Labour | James Napier | 247 | 20.1 | −42.0 | |
| Majority | 5 | 0.4 | |||
| Turnout | 1,288 | ||||
| Conservative gain from Labour | Swing | ||||
| Party | Candidate | Votes | % | ±% | |
|---|---|---|---|---|---|
| Labour | Darrell Pulk | 301 | 55.9 | +35.7 | |
| Conservative | Fraser McFarland | 224 | 41.6 | −22.1 | |
| Liberal Democrats | Phil Ray | 13 | 2.4 | −13.7 | |
| Majority | 77 | 14.3 | |||
| Turnout | 538 | ||||
| Labour gain from Conservative | Swing | ||||
| Party | Candidate | Votes | % | ±% | |
|---|---|---|---|---|---|
| Conservative | Simon Richardson | 652 | 59.2 | −11.4 | |
| Labour | Ray Fielding | 278 | 25.2 | −4.2 | |
| Liberal Democrats | Simon Russell | 172 | 15.6 | +15.6 | |
| Majority | 374 | 33.9 | |||
| Turnout | 1,102 | ||||
| Conservative hold | Swing | ||||

Bassetlaw is a local government district in north Nottinghamshire, England. Its council is based in the town of Worksop; the other towns in the district are Retford, Tuxford and Harworth Bircotes. The district also contains numerous villages and surrounding rural areas.

Bassetlaw is a parliamentary constituency in Nottinghamshire, represented in the House of Commons of the UK Parliament since the 2024 general election by Jo White, a Labour Party candidate. Before the 2019 general election, the seat had been part of the so-called "red wall", being held by the Labour Party since 1935 before falling to the Conservative Party.
Amber Valley Borough Council elections are held every four years to elect councillors to Amber Valley Borough Council, the local authority for the non-metropolitan district of Amber Valley in Derbyshire, England. Since the last boundary changes in 2023, 42 councillors have been elected to represent 18 wards. Prior to 2023 a third of the council was elected three years out of every four.
Broadland District Council in Norfolk, England is elected every four years. Up until 2004 one third of the Council was elected each year, followed by one year without election. Since the last boundary changes in 2004, 47 councillors have been elected from 27 wards.
Forest Heath District Council in Suffolk, England was elected every four years. between the last boundary changes in 2003 and the final elections in 2015, 27 councillors were elected from 14 wards. The council was abolished in 2019, with the area becoming part of West Suffolk.
Ashfield District Council elections are held every four years. Ashfield District Council is the local authority for the non-metropolitan district of Ashfield in Nottinghamshire, England. Since the last boundary changes in 2015, 35 councillors are elected from 23 wards.
Aylesbury Vale District Council was the council for the non-metropolitan district of Aylesbury Vale in Buckinghamshire, England, which existed as a local government area from 1974 to 2020. The council was elected every four years from 1973 until 2020. At the time of its abolition, the council had 59 councillors, elected from 33 wards.
Broxtowe Borough Council elections are held every four years. Broxtowe Borough Council is the local authority for the non-metropolitan district of Borough of Broxtowe in Nottinghamshire, England. Since the full review of boundaries in 2015, 44 councillors are elected from 20 wards.
Chelmsford City Council in Essex, England is elected every four years. Since the last boundary changes in 2003 the council has comprised 57 councillors elected from 24 wards.
Chichester District Council in West Sussex, England is elected every four years. Since the last boundary changes in 2019, 36 councillors have been elected from 21 wards.
Fenland District Council in Cambridgeshire, England is elected every four years. Since the last boundary changes in 2023, the council has comprised 43 councillors representing 18 wards, with each ward electing one, two or three councillors.
Durham County Council elections are held every four years. Durham County Council is the local authority for the unitary authority of County Durham. Since becoming a unitary authority, 126 councillors have been elected from 63 wards.
East Hampshire District Council elections are held every four years to elect councillors to East Hampshire District Council in Hampshire, England. Since the last boundary changes in 2019 the council has comprised 43 councillors representing 31 wards, with each ward electing one, two or three councillors.
East Lindsey District Council in Lincolnshire, England is elected every four years. The district is divided into 37 wards, electing 55 councillors. The last ward boundary changes came into effect in 2015.
Forest of Dean District Council is the local authority for the Forest of Dean in Gloucestershire, England. The council is elected every four years. Since the last boundary changes in 2019, 38 councillors are elected from 21 wards.
East Hertfordshire District Council is elected every four years.
Cheshire East Council elections are held every four years. Cheshire East Council is the local authority for the unitary authority of Cheshire East in Cheshire, England. Since the last boundary changes in 2011, 82 councillors have been elected from 52 wards.
East Northamptonshire District Council in Northamptonshire, England was elected every four years. After the last boundary changes in 2007, 40 councillors were elected from 22 wards. The district was abolished in 2021, with the area becoming part of North Northamptonshire.
Local elections were held in Waveney district every four years to elect councillors to Waveney District Council. In the past, one-third of councillors were elected each year, but in 2010 the council opted to change to a whole council election system. Since the last boundary changes in 2002, 48 councillors have been elected from 23 wards. The district was merged with Suffolk Coastal in April 2019 to form East Suffolk, meaning that the 2015 elections were the final Waveney elections to be held.
Milton Keynes City Council is the local authority for the City of Milton Keynes, a unitary authority in Buckinghamshire, England. Until 1 April 1997 it was a non-metropolitan district.