2017 Nottinghamshire County Council election

Last updated

2017 Nottinghamshire County Council election
County Flag of Nottinghamshire.svg
  2013 4 May 2017 2021  

All 66 seats to Nottinghamshire County Council
34 seats needed for a majority
Turnout36.2% (Increase2.svg+3.0)
 First partySecond partyThird party
 
Leader Kay Cutts Alan RhodesJason Zadrozny
Party Conservative Labour Ashfield Independents
Last election2134
Seats won31235
Seat changeIncrease2.svg10Decrease2.svg11Increase2.svg5
Popular vote88,09372,99710,554
Percentage39.4%32.7%4.7%
SwingIncrease2.svg+12.5Decrease2.svg-2.4-

Nottinghamshire County Council election, 2017.svg
Map showing the results of the 2017 Nottinghamshire County Council elections.

Council control before election

Labour

Council control after election

No overall control

The 2017 Nottinghamshire County Council election took place on 4 May 2017 as part of the 2017 local elections in the United Kingdom. [1] The whole council of 66 councillors was elected for a four-year term spanning 56 electoral divisions, a minority of which return two councillors. The voting system used is first-past-the-post.

Contents

The result was no overall party group of candidates formed a majority. Before the election the council, had a one-councillor Labour Party majority after the election the Labour Party formed the second-largest party group, with the Conservative party being the largest party. The Conservatives formed a coalition with the Mansfield Independent Forum which took control of the council, with the Conservative leader, Kay Cutts, being appointed leader of the council at the council's annual meeting following the election. [2]

A review by the Local Government Boundary Commission for England led to altered boundaries for this election. [3] [4]

Overall election results

Political composition of the council following the election 2017 Nottinghamshire County Council election composition.svg
Political composition of the council following the election
Overall Turnout
Registered electors608,282
Votes cast220,048
Turnout36.2% (Increase2.svg+3.0)
Within Nottinghamshire County 2017
PartyCandidatesVotes
StoodElectedGainedUnseatedNet % of total %No.Net %
  Conservative 573110Steady2.svgIncrease2.svg 1039.488,093Increase2.svg+12.5
  Labour 6423Steady2.svg11Decrease2.svg 1132.772,997Decrease2.svg-2.4
  Ashfield Ind. 555Steady2.svgIncrease2.svg 54.710,554NEW
  Mansfield Independent 442Steady2.svgIncrease2.svg 22.65,770Decrease2.svg-0.1
  Liberal Democrats 521Steady2.svg4Decrease2.svg 47.917,731Decrease2.svg-2.6
 Selston Parish Independents11Steady2.svgSteady2.svgSteady2.svg0.81,848
  UKIP 420Steady2.svgSteady2.svgSteady2.svg5.011,102Decrease2.svg-13.1
  Green 210Steady2.svgSteady2.svgSteady2.svg2.04,573Increase2.svg+0.2
  Independent 1114.49,767Decrease2.svg-0.2
 Hucknall First Community Forum30Steady2.svgSteady2.svgSteady2.svg0.3638
  TUSC 30Steady2.svgSteady2.svgSteady2.svg0.2422Steady2.svg

Results by electoral division

Ashfield District

(10 seats, 10 electoral divisions) [5]

Ashfield District
PartyCandidatesVotes
StoodElectedGainedUnseatedNet % of total %No.Net %
  Ashfield Ind. 555Steady2.svgIncrease2.svg 531.510,554Increase2.svg 31.5
  Conservative 733Steady2.svgIncrease2.svg 318.56,221Increase2.svg 1.6
  Labour 101Steady2.svg5Decrease2.svg 528.59,562Decrease2.svg 10.6
 Selston Parish Independents11Steady2.svgSteady2.svgSteady2.svg5.51,848
  UKIP 100Steady2.svgSteady2.svgSteady2.svg7.52,514Decrease2.svg 13.1
  Independent 20Steady2.svgSteady2.svgSteady2.svg5.51,833Increase2.svg 2.7
 Hucknall First Community Forum30Steady2.svgSteady2.svgSteady2.svg1.9638Steady2.svg
  Liberal Democrats 50Steady2.svg3Decrease2.svg 31.1383Decrease2.svg 13.4
Ashfield Turnout
Registered electors93,196
Votes cast33,553
Turnout36.0% (Increase2.svg+4.6)

Ashfields

Ashfields (1 seat)
PartyCandidateVotes%
Ashfield Ind. Jason Zadrozny (inc)* 1,524 50.1
Labour Linford Martyn Gibbons80026.3
Conservative Jade Melissa Ancliff50516.6
UKIP Ian William Wright2116.9
Turnout 3,04035.8
Registered electors 8,502
Ashfield Ind. win (new seat)

* Incumbent councillor for Sutton in Ashfield North division prior to boundary changes.

Hucknall North

Hucknall North (1 seat)
PartyCandidateVotes%
Conservative Ben Bradley 1,539 47.9
Labour Alice Elisabeth Grice1,14135.5
Hucknall First Community ForumJohn Morton Anthony Wilmott2828.8
UKIP Ray Young1615.0
Liberal Democrats James Alan Harvey892.8
Turnout 3,21239.1
Registered electors 8,231
Conservative win (new seat)

Hucknall South

Hucknall South (1 seat)
PartyCandidateVotes%
Conservative Phil Rostance 1,136 40.5
Labour John Hartley Wilkinson1,06237.9
UKIP Jack Holland31311.2
Hucknall First Community ForumTrevor Charles Locke1967.0
Liberal Democrats Alex Sjoberg-Weekes973.5
Turnout 2,80430.8
Registered electors 9,131
Conservative win (new seat)

Hucknall West

Hucknall West (1 seat)
PartyCandidateVotes%
Conservative Kevin Thomas Rostance 1,535 51.6
Labour Joe Watkinson98833.2
UKIP Stuart James Bestwick2398.0
Hucknall First Community ForumGeoff Ware1605.4
Liberal Democrats Robert Andrew Charlesworth541.8
Turnout 2,97635.5
Registered electors 8,391
Conservative win (new seat)

Kirkby North

Division boundaries underwent significant changes compared with the boundaries used at the previous election.

Kirkby North (1 seat)
PartyCandidateVotes%
Labour John Knight (inc) 1,211 45.3
Conservative Sam Ancliff95135.6
UKIP Janet Jeanes40015.0
Liberal Democrats John Timothy Ingram1114.2
Turnout 2,67329.0
Registered electors 9,255
Labour win (new boundaries)

Kirkby South

Division boundaries underwent significant changes compared with the boundaries used at the previous election.

Kirkby South (1 seat)
PartyCandidateVotes%
Ashfield Ind. Rachel Madden 2,364 61.8
Labour Donna Samantha Jane Gilbert98125.7
UKIP Gabriella Wright3659.5
Independent Mark John Harrison1143.0
Turnout 3,82439.7
Registered electors 9,682
Ashfield Ind. win (new boundaries)

Selston

There were minor changes to the boundaries of the division.

Selston
PartyCandidateVotes%±%
Selston Parish Independents David Martin 1,848 40.8 Decrease2.svg−31.0
Independent Sam Wilson1,71938.0NEW
Labour Ruth Stevens56712.5Decrease2.svg−11.0
Conservative Shanade Bradley2605.7NEW
UKIP Carole Terzza1002.2NEW
Liberal Democrats Josie Marsters320.7NEW
Turnout 4,52644.1Increase2.svg+10.3
Registered electors 10,271
Independent hold Swing

Sutton Central & East

Sutton Central & East (1 seat)
PartyCandidateVotes%
Ashfield Ind. Samantha Deakin 1,758 60.1
Labour Steve Carroll92531.6
UKIP Sally Cook2418.2
Turnout 2,92431.0
Registered electors 9,484
Ashfield Ind. win (new boundaries)

Sutton North

Division boundaries underwent significant changes compared with the boundaries used at the previous election.

Sutton North (1 seat)
PartyCandidateVotes%
Ashfield Ind. Helen-Ann Smith 2,370 65.2
Labour Helen Joy Hollis95126.1
UKIP Geoff Thorpe3168.7
Turnout 3,63735.9
Registered electors 10,176
Ashfield Ind. win (new boundaries)

Sutton West

Division boundaries underwent significant changes compared with the boundaries used at the previous election.

Sutton West (1 seat)
PartyCandidateVotes%
Ashfield Ind. Tom Hollis (inc) 2,538 64.5
Labour Glenys Christina Maxwell93623.8
Conservative John Matson Baker2957.5
UKIP Moira Jean Sansom1684.3
Turnout 3,93739.2
Registered electors 10,073
Ashfield Ind. win (new boundaries)

Bassetlaw District

(9 seats, 9 electoral divisions)

Bassetlaw District
PartyCandidatesVotes
StoodElectedGainedUnseatedNet % of total %No.Net %
  Labour 85Steady2.svg2Decrease2.svg 244.412,077Decrease2.svg 6.1
  Conservative 842Steady2.svgIncrease2.svg 236.19,827Increase2.svg 8.3
  UKIP 80Steady2.svgSteady2.svgSteady2.svg9.02,436Decrease2.svg 9.4
  Liberal Democrats 90Steady2.svgSteady2.svgSteady2.svg6.51,758Increase2.svg 4.1
  Independent 10Steady2.svgSteady2.svgSteady2.svg4.11,125Increase2.svg 3.1
Bassetlaw Turnout
Registered electors86,665
Votes cast27,223
Turnout31.4% (Increase2.svg+1.5)

Blyth & Harworth

There were minor changes to the boundaries of the division.

Blyth and Harworth
PartyCandidateVotes%±%
Labour Sheila Place (inc) 1,529 61.5 Decrease2.svg−3.6
Conservative Adam Gray44417.9Increase2.svg+3.7
UKIP John Hudson28911.6Decrease2.svg−5.8
Liberal Democrats Alex Cowan2249.0Increase2.svg+5.7
Turnout 2,48626.5Decrease2.svg−0.5
Registered electors 9,384
Labour hold Swing

Misterton

Division boundaries underwent significant changes compared with the boundaries used at the previous election.

Misterton (1 seat)
PartyCandidateVotes%
Conservative Tracey Lee Taylor 1,994 54.4
Independent Hazel Brand1,12530.7
Liberal Democrats Mark Peter Hunter2938.0
UKIP Dave Taylor2516.9
Turnout 3,66335.3
Registered electors 10,472
Conservative win (new boundaries)

Retford East

Retford East
PartyCandidateVotes%±%
Conservative Steve Vickers 1,328 44.8 Increase2.svg+11.3
Labour Pamela Skelding (inc)1,29143.6Decrease2.svg−3.2
UKIP Jon Wade1906.4Decrease2.svg−10.2
Liberal Democrats Stephen Ware1525.1Increase2.svg+2.0
Turnout 2,96132.9Steady2.svg
Registered electors 8,988
Conservative gain from Labour Swing

Retford West

Division boundaries underwent significant changes compared with the boundaries used at the previous election.

Retford West (1 seat)
PartyCandidateVotes%
Conservative Mike Quigley 1,411 46.4
Labour Darrell Eduard Pulk1,35744.6
Liberal Democrats Jennifer Anne Coggles2728.9
Turnout 3,04032.3
Registered electors 9,445
Conservative win (new boundaries)

Tuxford

Division boundaries underwent significant changes compared with the boundaries used at the previous election.

Tuxford (1 seat)
PartyCandidateVotes%
Conservative John Ogle (inc) 2,245 71.9
Labour Frederick Gallucci54417.4
UKIP Tony Clayton1765.6
Liberal Democrats Mat Duveen1595.1
Turnout 3,12435.3
Registered electors 8,885
Conservative win (new boundaries)

Worksop East

Division boundaries underwent significant changes compared with the boundaries used at the previous election.

Worksop East (1 seat)
PartyCandidateVotes%
Labour Glynn Gilfoyle (inc) 1,855 71.1
Conservative Michael Tom Gray37214.3
UKIP Andrew Airey27710.6
Liberal Democrats Connor Lewis Savage1054.0
Turnout 2,60926.4
Registered electors 9,890
Labour win (new boundaries)

Worksop North

Division boundaries underwent significant changes compared with the boundaries used at the previous election.

Worksop North (1 seat)
PartyCandidateVotes%
Labour Alan Rhodes (inc)* 2,000 60.5
Conservative Richard Barnes93328.2
UKIP Roger Martin Vernon2638.0
Liberal Democrats Adam Davies1103.3
Turnout 3,30633.3
Registered electors 9,953
Labour win (new boundaries)

* Incumbent councillor for Worksop North East & Carlton division prior to boundary changes.

Worksop South

Division boundaries underwent significant changes compared with the boundaries used at the previous election.

Worksop South (1 seat)
PartyCandidateVotes%
Labour Kevin Maurizio Greaves (inc)* 1,801 54.7
Conservative Emma Jane Auckland1,10033.4
UKIP Christopher Paul Barker2427.4
Liberal Democrats Leon Maurice Duveen1474.5
Turnout 3,29033.8
Registered electors 9,770
Labour win (new boundaries)

* Incumbent councillor for Worksop West division prior to boundary changes.

Worksop West

Division boundaries underwent significant changes compared with the boundaries used at the previous election.

Worksop West (1 seat)
PartyCandidateVotes%
Labour Sybil Jacqueline Fielding (inc)* 1,700 62.0
UKIP Rachel Elizabeth Briggs74827.3
Liberal Democrats Simon Andrew Russell29610.8
Turnout 2,74428.0
Registered electors 9,878
Labour win (new boundaries)

* Incumbent councillor for Worksop North division prior to boundary changes.

Broxtowe Borough

(9 seats, 7 electoral divisions)

Broxtowe Borough
PartyCandidatesVotes
StoodElectedGainedUnseatedNet % of total %No.Net %
  Conservative 973Steady2.svgIncrease2.svg 342.915,215Increase2.svg+17.0
  Labour 91Steady2.svgSteady2.svgSteady2.svg28.610,156Increase2.svg+0.6
  Liberal Democrats 71Steady2.svg4Decrease2.svg 414.95,286Decrease2.svg-6.9
  Independent 20Steady2.svgSteady2.svgSteady2.svg4.71,680Increase2.svg+1.7
  UKIP 80Steady2.svgSteady2.svgSteady2.svg4.61,617Decrease2.svg-12.7
  Green 60Steady2.svgSteady2.svgSteady2.svg4.21,506Increase2.svg+0.6
Broxtowe Turnout
Registered electors84,726
Votes cast33,851
Turnout40.0% (Increase2.svg+3.0)

Beeston Central & Rylands

Beeston Central & Rylands (1 seat)
PartyCandidateVotes%
Labour Kate Foale (inc)* 2,051 52.3
Conservative Trish Roberts-Thomson1,26932.3
Liberal Democrats Gav Slater3879.9
Green Sylvia Anne Rule2175.5
Turnout 3,92441.8
Registered electors 9,396
Labour win (new seat)

* Incumbent councillor for Beeston South and Attenborough division prior to boundary changes.

Bramcote & Beeston North

Bramcote & Beeston North (1 seat)
PartyCandidateVotes%
Liberal Democrats Steve Carr (inc)* 1,966 41.2
Conservative Tony Smith1,35528.4
Labour Ellie Winfield1,17824.7
Independent Paul Constantine Nathanail1503.1
UKIP Chris Cobb1192.5
Turnout 4,76848.2
Registered electors 9,905
Liberal Democrats win (new seat)

* Incumbent councillor for Beeston North division prior to boundary changes.

Eastwood

There were minor changes to the boundaries of the division.

Eastwood
PartyCandidateVotes%±%
Conservative Tony Harper 1,180 38.5 Increase2.svg+30.6
Liberal Democrats Keith Longdon (inc)86128.1Decrease2.svg−17.6
Labour David Griffiths72123.5Decrease2.svg−7.4
UKIP Paul Tordoff2197.1Decrease2.svg−6.2
Green Pat Morton842.7NEW
Turnout 3,06532.8Increase2.svg+0.4
Registered electors 9,358
Conservative gain from Liberal Democrats Swing

Greasley & Brinsley

Greasley & Brinsley (1 seat)
PartyCandidateVotes%
Conservative John William Handley (inc)* 2,159 61.0
Labour David Thomas Patrick77421.9
UKIP Tracey Ann Cahill35810.1
Green Bethan Hewis2487.0
Turnout 3,53937.5
Registered electors 9,446
Conservative win (new seat)

* Incumbent councillor for Beauvale division prior to boundary changes.

Nuthall & Kimberley

Nuthall & Kimberley (1 seat)
PartyCandidateVotes%
Conservative Philip John Owen (inc)* 2,132 56.0
Labour Teresa Ann Cullen1,01126.5
Green Kat Boettge39710.4
UKIP Graham Andrew Jones2687.0
Turnout 3,80837.4
Registered electors 10,192
Conservative win (new seat)

* Incumbent councillor for Nuthall division prior to boundary changes.

Stapleford & Broxtowe Central

Stapleford & Broxtowe Central (2 seat)
PartyCandidateVotes%
Conservative John Anthony Doddy (inc)* 2,692 39.3
Conservative William John Longdon 2,179 31.8
Labour John Liam Sean McGrath2,03429.7
Labour Lisa Marie Clarke1,90327.8
Independent Richard Danny MacRae1,53022.3
Liberal Democrats Jacky Williams1,14716.7
Liberal Democrats Tim Hallam1,10116.1
UKIP Nina Peterson-Tait2864.2
UKIP Daniel Roy Stowell2163.2
Turnout 6,85539.8
Registered electors 17,206
Conservative win (new seat)

* Incumbent councillor for Chilwell & Toton division prior to boundary changes.

Toton, Chilwell & Attenborough

Toton, Chilwell & Attenborough (2 seats)
PartyCandidateVotes%
Conservative Eric Kerry 3,817 48.5
Conservative Richard Ian Jackson (inc)* 3,811 48.4
Labour Dawn Angela Elliott2,38730.3
Labour Tom Roberts2,15427.4
Liberal Democrats Graham Heal92511.7
Liberal Democrats Si Frost7099.0
Green Richard David Eddleston5607.1
Green Mary Evelyn Venning4605.8
UKIP Mick Ashton3674.7
UKIP Tony Hall3023.8
Turnout 7,89241.1
Registered electors 19,223
Conservative win (new seat)

* Incumbent councillor for Chilwell & Toton division prior to boundary changes.

Gedling Borough

(9 seats, 6 electoral divisions)

Gedling Borough
PartyCandidatesVotes
StoodElectedGainedUnseatedNet % of total %No.Net %
  Labour 97Steady2.svgSteady2.svgSteady2.svg43.924,021Increase2.svg 2.7
  Conservative 92Steady2.svgSteady2.svgSteady2.svg42.423,184Increase2.svg 13.7
  Liberal Democrats 90Steady2.svgSteady2.svgSteady2.svg6.13,339Increase2.svg 0.2
  UKIP 90Steady2.svgSteady2.svgSteady2.svg5.22,859Decrease2.svg 17.1
  Green 60Steady2.svgSteady2.svgSteady2.svg2.31,239Increase2.svg 0.9
  Independent 10Steady2.svgSteady2.svgSteady2.svg0.282Decrease2.svg 0.3
Gedling Turnout
Registered electors88,096
Votes cast33,325
Turnout37.8% (Increase2.svg+3.7)

Arnold North

Division boundaries underwent significant changes compared with the boundaries used at the previous election.

Arnold North (2 seats)
PartyCandidateVotes%
Labour Pauline Annette Allan (inc) 3,377 45.5
Labour Michael Richard Payne (inc) 3,309 44.5
Conservative James Anthony Patrick Faulconbridge3,17142.7
Conservative Carol Pepper3,15742.5
UKIP George Eric Rose4265.7
UKIP David William Voce4005.4
Liberal Democrats Tad Jones2293.1
Liberal Democrats Andrew Julian Swift2263.0
Green Jeannie Thompson1692.3
Green Jim Norris1431.9
Turnout 7,43837.2
Registered electors 20,002
Labour win (new boundaries)

Arnold South

Division boundaries underwent significant changes compared with the boundaries used at the previous election.

Arnold South (2 seats)
PartyCandidateVotes%
Labour William John Clarke 3,842 47.4
Labour Muriel Weisz (inc) 3,787 46.7
Conservative Michael James Adams3,18439.2
Conservative Jane Maria Walker2,80434.6
Liberal Democrats Robert Andrew Swift5446.7
Liberal Democrats Jason Martin Stansfield4996.1
UKIP John Colin Hart4435.5
UKIP Jean Olive Truman3344.1
Green Margret Susan Barbara Vince2553.1
Green Jim Stuart2252.8
Turnout 8,12239.8
Registered electors 20,431
Labour win (new boundaries)

Calverton

Calverton
PartyCandidateVotes%±%
Conservative Boyd Elliott (inc) 2,492 61.3 Increase2.svg+21.8
Labour Mike Hope1,10427.2Decrease2.svg−0.6
Liberal Democrats Marguerite Wright2857.0Increase2.svg+4.8
UKIP Lee Waters1834.5Decrease2.svg−18.5
Turnout 4,06440.5Increase2.svg+4.5
Registered electors 10,026
Conservative hold Swing

Carlton East

Division boundaries underwent significant changes compared with the boundaries used at the previous election.

Carlton East (1 seat)
PartyCandidateVotes%
Labour Nicki Brooks (inc) 1,576 44.1
Conservative Kevin Backhouse Doyle1,54743.3
Liberal Democrats John Edward Flynn2296.4
UKIP Graham Kenneth Roebuck1403.9
Independent Ray Ellis822.3
Turnout 3,57437.4
Registered electors 9,588
Labour win (new boundaries)

Carlton West

Division boundaries underwent significant changes compared with the boundaries used at the previous election.

Carlton West (2 seats)
PartyCandidateVotes%
Labour Jim Creamer (inc) 3,213 47.8
Labour Errol George Henry 3,165 47.1
Conservative Robert James Dawson2,26033.6
Conservative Ged Clarke2,24333.4
Liberal Democrats Andrew Mark Ellwood6539.7
Liberal Democrats Paul Anthony Hughes5518.2
UKIP Piero Loi3875.8
UKIP Philip Anthony Pritchard3675.5
Green Laurence James Baldwin3324.9
Turnout 6,73633.8
Registered electors 19,927
Labour win (new boundaries)

Newstead

Newstead
PartyCandidateVotes%±%
Conservative Christopher Barnfather (inc) 2,326 68.6 Increase2.svg+18.0
Labour Michael Smith64819.1Decrease2.svg−2.5
UKIP Rhea Waters1795.3Decrease2.svg−19.4
Liberal Democrats David Watts1233.6Increase2.svg+0.5
Green Rebecca Connick1153.4NEW
Turnout 3,39141.8Increase2.svg+5.2
Registered electors 8,122
Conservative hold Swing

Mansfield District

(9 seats, 5 electoral divisions)

Mansfield District
PartyCandidatesVotes
StoodElectedGainedUnseatedNet % of total %No.Net %
  Labour 95Steady2.svg2Decrease2.svg 242.616,645Increase2.svg 0.8
  Mansfield Independent 442Steady2.svgIncrease2.svg 227.610,759Increase2.svg 4.2
  Conservative 40Steady2.svgSteady2.svgSteady2.svg13.15,107Increase2.svg 7.0
  Liberal Democrats 60Steady2.svgSteady2.svgSteady2.svg4.21,629Increase2.svg 3.1
  UKIP 50Steady2.svgSteady2.svgSteady2.svg10.34,010Decrease2.svg 8.7
  TUSC 30Steady2.svgSteady2.svgSteady2.svg1.1422Steady2.svg
  Independent 10Steady2.svgSteady2.svgSteady2.svg1.2461Increase2.svg 0.5
Mansfield Turnout
Registered electors81,008
Votes cast22,817
Turnout28.2% (Increase2.svg+0.6)

East Mansfield

East Mansfield (2 seats)
PartyCandidateVotes%±%
Mansfield Independent Martin Wright 2,695 53.9 Increase2.svg+23.9
Mansfield Independent Vaughan Hopewell 2,450 49.0 Increase2.svg+21.6
Labour Alan Bell (inc)1,79936.0Steady2.svg
Labour Colleen Harwood (inc)1,69934.0Increase2.svg+1.4
Liberal Democrats Christopher Morris3577.1NEW
TUSC Tom Hunt1122.2NEW
Turnout 4,99727.3Decrease2.svg−0.5
Registered electors 18,321
Mansfield Independent gain from Labour Swing

North Mansfield

There were minor changes to the boundaries of the division.

North Mansfield (2 seats)
PartyCandidateVotes%±%
Labour Joyce Bosnjak (inc) 2,557 49.7 Decrease2.svg−0.8
Labour Parry Tsimbiridis (inc) 2,143 41.7 Increase2.svg+0.2
Conservative Daniel Redfern1,92437.4Increase2.svg+25.3
UKIP Raymond Forster1,01919.8NEW
UKIP David Hamilton84816.5Decrease2.svg−16.2
Liberal Democrats Clive Trussel3867.5Increase2.svg+2.0
TUSC Karen Seymour1543.0Steady2.svg
Turnout 5,14228.6
Registered electors 18,003
Labour hold Swing
Labour hold Swing

South Mansfield

There were minor changes to the boundaries of the division.

South Mansfield (2 seats)
PartyCandidateVotes%±%
Mansfield Independent Stephen Garner (inc) 3,075 56.1 Increase2.svg+4.4
Mansfield Independent Andy Sissons (inc) 2,539 46.3 Increase2.svg+1.6
Labour Charles Hammersley1,28023.3Decrease2.svg−9.3
Labour Darren Hunt1,26823.1Decrease2.svg−7.9
Conservative Paul Saxelby1,14320.8NEW
Independent Philip Shields4618.4NEW
Liberal Democrats Dean Malpass2354.3NEW
Liberal Democrats Anita Prabhakar1663.0NEW
Turnout 5,48530.3
Registered electors 18,124
Mansfield Independent hold Swing

West Mansfield

There were minor changes to the boundaries of the division.

West Mansfield (2 seats)
PartyCandidateVotes%±%
Labour Paul Henshaw 2,124 46.1 Increase2.svg+3.7
Labour Diana Meale (inc) 2,110 45.8 Increase2.svg+5.0
Conservative Stephen Stewardson1,47432.0Increase2.svg+24.6
UKIP Stephen Crosby1,11624.2Increase2.svg+4.8
UKIP Fran Loi74516.2Decrease2.svg−1.0
Liberal Democrats Rebecca Buck4169.0NEW
TUSC Paul Tooley-Okonkwo1563.4NEW
Turnout 4,61127.1
Registered electors 17,037
Labour hold Swing
Labour hold Swing

Warsop

Warsop
PartyCandidateVotes%±%
Labour Andy Wetton 1,665 64.5 Increase2.svg+0.9
Conservative Don Brown56621.9Increase2.svg+14.9
UKIP Allan Dallman28210.9Decrease2.svg−5.6
Liberal Democrats Janette Smith692.7NEW
Turnout 2,58227.1
Registered electors 9,523
Labour hold Swing

Newark & Sherwood District

(10 seats, 10 electoral divisions)

Newark & Sherwood District
PartyCandidatesVotes
StoodElectedGainedUnseatedNet % of total %No.Net %
  Conservative 106Steady2.svgSteady2.svgSteady2.svg55.317,918Increase2.svg 19.2
  Labour 93Steady2.svgSteady2.svgSteady2.svg25.98,390Decrease2.svg 3.8
  Independent 31Steady2.svgSteady2.svgSteady2.svg9.43,047Increase2.svg 1.0
  Liberal Democrats 80Steady2.svgSteady2.svgSteady2.svg8.72,826Steady2.svg
  Green 10Steady2.svgSteady2.svgSteady2.svg0.8250Steady2.svg
Newark & Sherwood Turnout
Registered electors88,805
Votes cast32,431
Turnout36.5% (Increase2.svg+1.5)

Balderton

Division boundaries underwent significant changes compared with the boundaries used at the previous election.

Balderton (1 seat)
PartyCandidateVotes%
Conservative Keith Walker (inc) 1,467 70.2
Labour Vivienne Leach44521.3
Liberal Democrats Marylyn Rayner1788.5
Turnout 2,09028.4
Registered electors 7,379
Conservative win (new boundaries)

Blidworth

Blidworth
PartyCandidateVotes%±%
Labour Yvonne Woodhead (inc) 1,006 41.9 Decrease2.svg−12.6
Conservative Bill Turnbull90937.8NEW
Independent Chris Wharton41617.3NEW
Liberal Democrats Philip Smith713.0NEW
Turnout 2,40228.9
Registered electors 8,319
Labour hold Swing

Collingham

Division boundaries underwent significant changes compared with the boundaries used at the previous election.

Collingham (1 seat)
PartyCandidateVotes%
Independent Maureen Dobson (inc) 2,191 62.1
Conservative Johno Lee1,33937.9
Turnout 3,53036.8
Registered electors 9,666
Independent win (new boundaries)

Farndon & Trent

Farndon & Trent (1 seat)
PartyCandidateVotes%
Conservative Sue Saddington (inc) 2,008 64.3
Independent Declan Patrick Logue44014.1
Labour Mary Obodo37211.9
Liberal Democrats Chris Adams3039.7
Turnout 3,12342.5
Registered electors 7,366
Conservative win (new seat)

Muskham & Farnsfield

Muskham & Farnsfield (1 seat)
PartyCandidateVotes%
Conservative Bruce Laughton (inc)* 3,108 69.0
Labour Jeremy Paul Spry77017.1
Liberal Democrats Peter Harris3778.4
Green Richard Pain2505.5
Turnout 4,50543.4
Registered electors 10,385
Conservative win (new seat)

* Incumbent councillor for Southwell and Caunton division prior to boundary changes.

Newark East

Division boundaries underwent significant changes compared with the boundaries used at the previous election.

Newark East (1 seat)
PartyCandidateVotes%
Conservative Stuart Robert Wallace (inc) 1,586 64.0
Labour Paul Stephen Peacock67127.1
Liberal Democrats Vivien Helen Scorer2229.0
Turnout 2,47931.9
Registered electors 7,787
Conservative win (new boundaries)

Newark West

Division boundaries underwent significant changes compared with the boundaries used at the previous election.

Newark West (1 seat)
PartyCandidateVotes%
Conservative Keith Frank Girling 1,412 60.2
Labour Zena Sanigar93339.8
Turnout 2,34527.0
Registered electors 8,743
Conservative win (new boundaries)

Ollerton

Division boundaries underwent significant changes compared with the boundaries used at the previous election.

Ollerton (1 seat)
PartyCandidateVotes%
Labour Mike Pringle 1,940 54.6
Conservative Glenn John Alexander Bardill1,48441.8
Liberal Democrats Christopher Cooke1263.5
Turnout 3,55037.1
Registered electors 9,599
Labour win (new boundaries)

Sherwood Forest

Sherwood Forest (1 seat)
PartyCandidateVotes%
Labour John Malcolm Peck (inc)* 1,738 53.5
Conservative Michael Andrew Brown1,39743.0
Liberal Democrats Peter James Scorer1123.4
Turnout 3,24736.3
Registered electors 8,974
Labour win (new seat)

* Incumbent councillor for Rufford division prior to boundary changes.

Southwell

Southwell (1 seat)
PartyCandidateVotes%
Conservative Roger James Jackson (inc)* 3,208 62.2
Liberal Democrats Stuart Ross Thompstone1,43727.8
Labour Ed Lyons51510.0
Turnout 5,16048.9
Registered electors 10,587
Conservative win (new seat)

* Incumbent councillor for Farnsfield and Lowdham division prior to boundary changes.

Rushcliffe Borough

(10 seats, 9 electoral divisions)

Rushcliffe Borough
PartyCandidatesVotes
StoodElectedGainedUnseatedNet % of total %No.Net %
  Conservative 1092Steady2.svgIncrease2.svg 253.622,785Increase2.svg 11.8
  Labour 101Steady2.svg1Decrease2.svg 125.510,829Decrease2.svg 1.2
  Liberal Democrats 80Steady2.svgSteady2.svgSteady2.svg10.94,628Increase2.svg 1.4
  Green 80Steady2.svgSteady2.svgSteady2.svg5.62,393Decrease2.svg 1.5
  Independent 20Steady2.svgSteady2.svgSteady2.svg3.61,539Steady2.svg
  UKIP 20Steady2.svgSteady2.svgSteady2.svg0.9360Decrease2.svg 14.2
Rushcliffe Turnout
Registered electors85,786
Votes cast36,848
Turnout43.0% (Increase2.svg+5.6)

Bingham East

Bingham East (1 seat)
PartyCandidateVotes%
Conservative Francis Anthoney Purdue-Horan 2,294 54.9
Independent Tracey Lindsay Kerry92222.1
Labour Chris Grocock59514.3
Green Ian Richard Mumford1904.6
UKIP Brian Ralph Edward Weaver1744.2
Turnout 4,17545.2
Registered electors 9,246
Conservative win (new seat)

Bingham West

Bingham West (1 seat)
PartyCandidateVotes%
Conservative Jonathan Neil Clarke 1,390 55.3
Independent Alan Robert Harvey61724.6
Labour Tony Wallace50620.1
Turnout 2,51337.2
Registered electors 6,765
Conservative win (new seat)

Cotgrave

Division boundaries underwent significant changes compared with the boundaries used at the previous election.

Cotgrave (1 seat)
PartyCandidateVotes%
Conservative Richard Langton Butler (inc) 1,961 61.9
Labour Keri Tricia Howe89228.2
Liberal Democrats David John Allen3139.9
Turnout 3,16638.0
Registered electors 8,358
Conservative win (new boundaries)

Keyworth

Division boundaries underwent significant changes compared with the boundaries used at the previous election.

Keyworth (1 seat)
PartyCandidateVotes%
Conservative John Elliott Cottee (inc) 2,520 62.0
Liberal Democrats Linda Jane Abbey76018.7
Labour Kevin James Fitzgerald47311.6
UKIP David Alan King1864.6
Green David Anthony Nicholson-Cole1253.1
Turnout 4,06446.7
Registered electors 8,728
Conservative win (new boundaries)

Leake & Ruddington

Leake & Ruddington (2 seats)
PartyCandidateVotes%
Conservative Andy Brown (inc)* 3,433 55.4
Conservative Reg Adair (inc) 3,349 54.1
Labour Jill Maureen Reedman1,20619.5
Labour Yvonne Barbara Lishman1,20219.4
Liberal Democrats Jason Richard Billin1,03016.6
Liberal Democrats Debbie Boote67610.9
Green Stephen Richard Perriman5448.8
Green Ian Paul Wilson4477.2
Turnout 6,20139.3
Registered electors 15,772
Conservative win (new seat)

* Incumbent councillor for Soar Valley division prior to boundary changes.

Radcliffe On Trent

Division boundaries underwent significant changes compared with the boundaries used at the previous election.

Radcliffe On Trent (1 seat)
PartyCandidateVotes%
Conservative Kay Cutts (inc) 2,220 57.8
Labour Stuart James Brady1,15130.0
Liberal Democrats Juliette Khan2626.8
Green Darren James Wells2055.3
Turnout 3,83845.0
Registered electors 8,553
Conservative win (new boundaries)

West Bridgford North

West Bridgford North (1 seat)
PartyCandidateVotes%
Labour Liz Plant (inc)* 2,368 50.5
Conservative Mike Watkinson1,47431.5
Green Timothy Andrew Baker4419.4
Liberal Democrats Vicky Price4028.6
Turnout 4,68547.2
Registered electors 9,957
Labour win (new seat)

* Incumbent councillor for West Bridgford Central and South division prior to boundary changes.

West Bridgford South

West Bridgford South (1 seat)
PartyCandidateVotes%
Conservative Jonathan Wheeler 1,893 50.3
Labour Lizzie Edgerton1,04327.7
Liberal Democrats David Charles Turner59215.7
Green Ian James Whitehead2396.3
Turnout 3,76743.3
Registered electors 8,713
Conservative win (new seat)

West Bridgford West

Division boundaries underwent significant changes compared with the boundaries used at the previous election.

West Bridgford West (1 seat)
PartyCandidateVotes%
Conservative Gordon Wheeler (inc) 2,251 50.7
Labour Nadia Whittome 1,39331.4
Liberal Democrats Ian Munro59313.4
Green Will Richardson2024.6
Turnout 4,43945.9
Registered electors 9,694
Conservative win (new boundaries)

Related Research Articles

<span class="mw-page-title-main">Borough of Broxtowe</span> Non-metropolitan district and borough in England

Broxtowe is a local government district with borough status in Nottinghamshire, England. It lies immediately west of the city of Nottingham, and most of the built-up areas of the borough form part of the Nottingham Urban Area. The council is based in Beeston and the borough also includes the towns of Eastwood, Kimberley and Stapleford and surrounding villages and rural areas.

<span class="mw-page-title-main">Toton</span> Village in Nottinghamshire, England

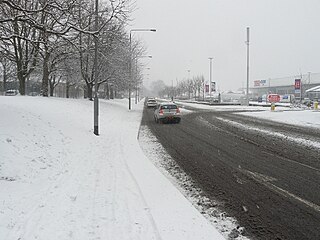
Toton is a large suburban village in the Borough of Broxtowe in Nottinghamshire, England. It forms part of the built-up area of Beeston, which in turn forms part of the wider Nottingham Urban Area. The population of the electoral ward of Toton and Chilwell Meadows was 7,298 in the 2001 census; it increased to 8,238 at the 2011 census.

<span class="mw-page-title-main">Chilwell</span> Village in Broxtowe, Nottinghamshire, England

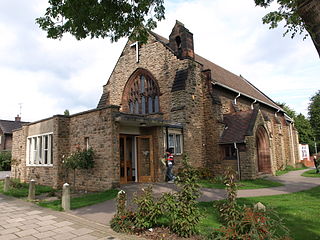
Chilwell is a suburban area in the borough of Broxtowe in Nottinghamshire, England. It lies on the west side of the town of Beeston and is 4 miles (6.4 km) south-west of the centre of Nottingham.

<span class="mw-page-title-main">Rushcliffe (UK Parliament constituency)</span> Parliamentary constituency in the United Kingdom, 1885 onwards

Rushcliffe is a constituency in Nottinghamshire represented in the House of Commons of the UK Parliament from 2024 by James Naish, a Labour MP.

<span class="mw-page-title-main">Bassetlaw (UK Parliament constituency)</span> Parliamentary constituency in the United Kingdom, 1885 onwards

Bassetlaw is a parliamentary constituency in Nottinghamshire, represented in the House of Commons of the UK Parliament since the 2024 general election by Jo White, a Labour Party candidate. Before the 2019 general election, the seat had been part of the so-called "red wall", being held by the Labour Party since 1935 before falling to the Conservative Party.

<span class="mw-page-title-main">Broxtowe (UK Parliament constituency)</span> Parliamentary constituency in the United Kingdom, 1983 onwards

Broxtowe is a parliamentary constituency in Nottinghamshire, England, represented in the House of Commons of the UK Parliament since 2024 by Juliet Campbell, from the Labour Party.

<span class="mw-page-title-main">Stapleford, Nottinghamshire</span> Town and civil parish in Nottinghamshire, England

Stapleford is a town and civil parish in the Borough of Broxtowe, Nottinghamshire, England, 6 miles (9.7 km) west of Nottingham. The population of the civil parish at the 2001 census was 14,991, at the 2011 census it was 15,241, and 15,453 at the 2021 census.

<span class="mw-page-title-main">Attenborough, Nottinghamshire</span> Village in Nottinghamshire, England

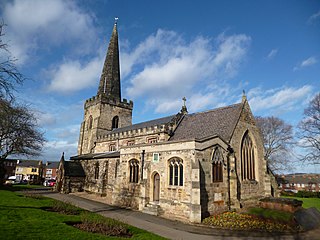
Attenborough is a village in the Borough of Broxtowe in Nottinghamshire, England. It forms part of the Greater Nottingham area and is 4+12 miles (7.2 km) to the south-west of the city of Nottingham, between Long Eaton and Beeston. It adjoins the suburbs of Toton to the west and Chilwell to the north. The population of the ward, as at the 2011 Census, was 2,328.

Broxtowe Borough Council elections are held every four years. Broxtowe Borough Council is the local authority for the non-metropolitan district of Borough of Broxtowe in Nottinghamshire, England. Since the full review of boundaries in 2015, 44 councillors are elected from 20 wards.

<span class="mw-page-title-main">2009 Nottinghamshire County Council election</span> Elections to Nottinghamshire County Council

Elections to Nottinghamshire County Council took place on 4 June 2009, having been delayed from 7 May, in order to coincide with elections to the European Parliament.

<span class="mw-page-title-main">2013 Nottinghamshire County Council election</span> 2013 UK local government election

The Nottinghamshire County Council Election took place on 2 May 2013 as part of the 2013 United Kingdom local elections.

<span class="mw-page-title-main">2013 Buckinghamshire County Council election</span> 2013 UK local government election

An election to Buckinghamshire County Council took place on 2 May 2013 as part of the 2013 United Kingdom local elections. 49 councillors were elected from electoral divisions which returned one county councillor each by first-past-the-post voting for a four-year term of office. Following a boundary review, the size of the council was reduced from 57 to 49 members for this election. No elections were held in Milton Keynes, which is a unitary authority outside the area covered by the County Council. The council continues to be administered on the Leader and Cabinet model. The Conservative Party won a reduced majority on the council.

<span class="mw-page-title-main">2017 Hampshire County Council election</span> 2017 UK local government election

The 2017 Hampshire County Council election took place on 4 May 2017 as part of the 2017 local elections in the United Kingdom. All councillors were elected from electoral divisions by first-past-the-post voting for a four-year term of office. The electoral divisions were somewhat changed from the previous election, with some being split, merged or with boundary changes. No elections were held in Portsmouth and Southampton, which are unitary authorities and hold their elections in other years. Similarly the districts within Hampshire did also not hold elections this year.

<span class="mw-page-title-main">2019 Bassetlaw District Council election</span> Local election in England

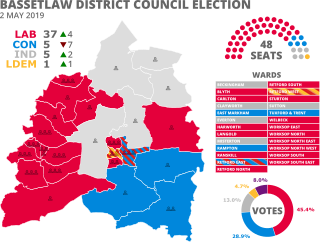
The 2019 Bassetlaw District Council election took place on 2 May 2019 to elect all 48 members of Bassetlaw District Council in England. This was on the same day as other local elections.

<span class="mw-page-title-main">2021 Nottinghamshire County Council election</span> 2021 election of all 66 councillors to Nottinghamshire County Council

The 2021 Nottinghamshire County Council election took place on 6 May 2021 as part of the 2021 local elections in the United Kingdom. All 66 councillors were elected from 56 electoral divisions, which returned either one or two county councillors each by first-past-the-post voting for a four-year term of office.

<span class="mw-page-title-main">Worksop East (Bassetlaw electoral ward)</span> Electoral ward in England

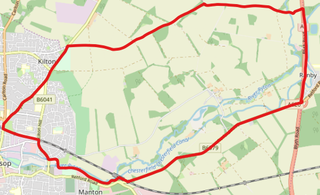
Worksop East is an electoral ward in the district of Bassetlaw. The ward elects 3 councillors to Bassetlaw District Council using the first past the post electoral system, with each councillor serving a four-year term in office. The number of registered voters in the ward is 5,014 as of 2019.

<span class="mw-page-title-main">Worksop North West (Bassetlaw electoral ward)</span> Electoral ward in England

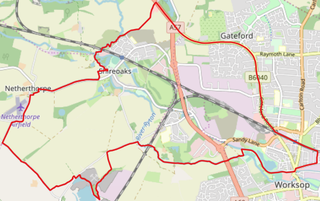
Worksop North West is an electoral ward in the district of Bassetlaw. The ward elects 3 councillors to Bassetlaw District Council using the first past the post electoral system, with each councillor serving a four-year term in office. The number of registered voters in the ward is 5,842 as of 2019.

<span class="mw-page-title-main">Worksop South East (Bassetlaw electoral ward)</span> Electoral ward in England

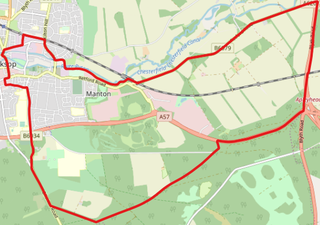
Worksop South East is an electoral ward in the district of Bassetlaw. The ward elects 3 councillors to Bassetlaw District Council using the first past the post electoral system, with each councillor serving a four-year term in office. The number of registered voters in the ward is 5,636 as of 2019.

<span class="mw-page-title-main">2023 Broxtowe Borough Council election</span> 2023 English local election

The 2023 Broxtowe Borough Council election took place on 4 May 2023, to elect all 44 members of Broxtowe Borough Council in England. This took place as part of the 2023 United Kingdom local elections.

References

  1. "Upcoming elections & referendums". Electoral Commission. Archived from the original on 5 May 2018. Retrieved 15 September 2016.
  2. "Council minutes, 25 May 2017". Nottinghamshire County Council. Retrieved 19 August 2022.
  3. "The Nottinghamshire (Electoral Changes) Order 2016". legislation.gov.uk. Retrieved 15 September 2016.
  4. "Nottinghamshire County Council". Local Government Boundary Commission for England. Archived from the original on 19 October 2016. Retrieved 15 September 2016.
  5. "Councillors Details" . Retrieved 18 February 2017.