| ||||||||||||||||||||||||||||||||||||||||
All 55 seats to Leicestershire County Council 28 seats needed for a majority | ||||||||||||||||||||||||||||||||||||||||
---|---|---|---|---|---|---|---|---|---|---|---|---|---|---|---|---|---|---|---|---|---|---|---|---|---|---|---|---|---|---|---|---|---|---|---|---|---|---|---|---|
| ||||||||||||||||||||||||||||||||||||||||
Map showing the results of the 2017 Leicestershire County Council elections. | ||||||||||||||||||||||||||||||||||||||||
|
The 2017 Leicestershire County Council election took place on 4 May 2017 as part of the 2017 local elections in the United Kingdom. [1] All councillors were elected from electoral divisions by first-past-the-post voting for a four-year term of office.
The Local Government Boundary Commission for England has undertaken a review of the county and has recommended a change to the boundaries of the electoral divisions. These changes took effect at this election. Leicestershire's 55 county councillors will represent 51 single-member electoral divisions and two two-member electoral divisions: Glenfields, Kirby Muxloe & Leicester Forests, and Oadby. [2]
There are 55 seats on the county council. The Conservatives and Labour fielded 55 candidates with the Liberal Democrats fielding 53, the UK Independence Party fielding 43 and the Green Party fielding 18. [3]
Party | Seats | Gains | Losses | Net gain/loss | Seats % | Votes % | Votes | +/− | |
---|---|---|---|---|---|---|---|---|---|
Conservative | 36 | 7 | 1 | 6 | 65 | 50.3 | 89780 | +10.5 | |
Green | 0 | 0 | 0 | 0 | 0 | 1.93 | 3446 | +1.93 | |
Labour | 6 | 0 | 3 | -3 | 11 | 20.5 | 36639 | -3.8 | |
Liberal Democrats | 13 | 1 | 1 | 0 | 24 | 21.0 | 37546 | +1.8 | |
UKIP | 0 | 0 | 2 | -2 | 0 | 5.8 | 10425 | -7.6 | |
British Democratic | 0 | 0 | 0 | 0 | 0 | 0.01 | 30 | -0.3 | |
Independent | 0 | 0 | 1 | -1 | 0 | 0.28 | 515 | -1.82 |
Results for individual divisions are shown below. [4] They have been divided into their respective districts or boroughs and listed alphabetically.
(8 seats, 7 Electoral Divisions)
Party | Seats | Gains | Losses | Net gain/loss | Seats % | Votes % | Votes | +/− | |
---|---|---|---|---|---|---|---|---|---|
Conservative | 6 | 0 | 0 | +1 | 75.0 | 54.6 | 14,681 | +7.0 | |
Labour | 1 | 0 | 0 | ±0 | 12.5 | 20.7 | 5,574 | –10.2 | |
Liberal Democrats | 1 | 0 | 0 | ±0 | 12.5 | 12.8 | 3,455 | –1.4 | |
UKIP | 0 | 0 | 0 | –1 | 0.0 | 8.5 | 2,293 | +4.4 | |
Party | Candidate | Votes | % | ±% | |
---|---|---|---|---|---|
Liberal Democrats | Geoff Welsh | 1,728 | 56.5 | –6.5 | |
Conservative | Marian Gail Broomhead | 906 | 29.6 | +4.5 | |
Labour | Shabbir Aslam | 299 | 9.8 | –2.1 | |
UKIP | Alfie Garner | 121 | 4.0 | N/A | |
Turnout | 3,054 | 32.5 | +4.8 | ||
Liberal Democrats hold | Swing | –5.5 | |||
Party | Candidate | Votes | % | ±% | |
---|---|---|---|---|---|
Labour | Amanda Jayne Hack | 1,330 | 46.7 | –14.4 | |
Conservative | Les Phillimore | 1,273 | 44.7 | +5.8 | |
UKIP | Rennee June Kent | 241 | 8.5 | N/A | |
Turnout | 2,844 | 29.1 | +3.1 | ||
Labour hold | Swing | –10.1 | |||
Party | Candidate | Votes | % | ±% | |
---|---|---|---|---|---|
Conservative | David Jennings | 2,041 | 63.8 | +8.3 | |
Labour | Michael George Howkins | 691 | 21.6 | –5.6 | |
Liberal Democrats | Beverley Jane Welsh | 247 | 7.7 | –9.6 | |
UKIP | Adrian Clive Langley | 216 | 6.8 | N/A | |
Turnout | 3,195 | 32.4 | +3.3 | ||
Conservative hold | Swing | +7.0 | |||
Party | Candidate | Votes | % | ||
---|---|---|---|---|---|
Conservative | Helen Louise Richardson | 1,140 | 55.9 | ||
Labour | Muhammad Shabbir Aslam | 563 | 27.6 | ||
Liberal Democrats | Mark Edward Widdop | 178 | 8.7 | ||
UKIP | Bill Piper | 157 | 7.7 | ||
Turnout | 2,038 | 26.7 | |||
Conservative win (new seat) |
Party | Candidate | Votes | % | ||
---|---|---|---|---|---|
Conservative | Lee Martin Breckon | 3,158 | 62.4 | ||
Conservative | Richard Blunt | 2,635 | 52.1 | ||
Labour | Dianne Patricia Esmond | 801 | 15.8 | ||
UKIP | Lynton Ellis Yates | 685 | 13.5 | ||
UKIP | Marc Wayne Preece | 662 | 13.1 | ||
Labour | Thomas Eynon Legrys | 640 | 12.6 | ||
Liberal Democrats | Kathryn Sansome | 553 | 10.9 | ||
Green | Nick Cox | 509 | 10.1 | ||
Liberal Democrats | Mark Jeremy Godfrey-Vallance | 474 | 9.4 | ||
Turnout | 10,117 | 28.8 | |||
Conservative win (new seat) | |||||
Conservative win (new seat) |
Party | Candidate | Votes | % | ±% | |
---|---|---|---|---|---|
Conservative | Terence John Richardson | 1,800 | 65.9 | +6.6 | |
Labour | Michael Robert Bounds | 717 | 26.2 | +4.1 | |
UKIP | Richard David Crouch | 211 | 7.7 | N/A | |
Turnout | 2,728 | 26.1 | +2.7 | ||
Conservative hold | Swing | +1.3 | |||
Party | Candidate | Votes | % | ||
---|---|---|---|---|---|
Conservative | Ernie White | 2,137 | 73.2 | ||
Labour | Neil Stuart Hallam | 507 | 17.3 | ||
Liberal Democrats | Christine Ann Merrill | 275 | 9.4 | ||
Turnout | 2,919 | 30.2 | |||
Conservative win (new seat) |
Party | Candidate | Votes | % | ±% | |
---|---|---|---|---|---|
Conservative | Iain Ewart George Bentley | 1,588 | 44.6 | ||
Liberal Democrats | Simon Sansome | 1,070 | 30.1 | ||
Labour | Sanjay Prem Gogia | 742 | 20.8 | ||
UKIP | Simon Andrew Murray | 154 | 4.3 | ||
Turnout | |||||
Conservative win (new seat) |
Party | Candidate | Votes | % | ±% | |
---|---|---|---|---|---|
Conservative | Deborah Taylor | 2,346 | 68.1 | ||
Labour | Glyn Stanley McAllister | 492 | 14.2 | ||
Liberal Democrats | Robert Simpson | 287 | 8.3 | ||
UKIP | Alan Spencer Jarvis | 170 | 4.9 | ||
Green | Katie Louise Walker | 146 | 4.2 | ||
Turnout | |||||
Conservative win (new seat) |
Party | Candidate | Votes | % | ±% | |
---|---|---|---|---|---|
Labour | Jewel Miah | 1,530 | 61.7 | ||
Conservative | Jane Marion Hunt | 582 | 23.4 | ||
UKIP | Christodoulos Peter Cooper | 151 | 6.1 | ||
Liberal Democrats | John Antony Elliot | 113 | 4.6 | ||
Green | Nigel James Feetham | 101 | 4.1 | ||
Turnout | |||||
Labour win (new seat) |
Party | Candidate | Votes | % | ±% | |
---|---|---|---|---|---|
Labour | Betty Newton | 1,335 | 49.3 | ||
Conservative | Salim Miah | 947 | 34.9 | ||
UKIP | Roger Howard Standing | 187 | 6.9 | ||
Green | Chris Hardisty | 138 | 5.1 | ||
Liberal Democrats | Philip Thornborow | 99 | 3.7 | ||
Turnout | |||||
Labour win (new seat) |
Party | Candidate | Votes | % | ±% | |
---|---|---|---|---|---|
Labour | Max Hunt | 1,118 | 48.7 | ||
Conservative | Renata Catherine Eleanor Louise Jones | 591 | 25.7 | ||
Independent | Roy Campsall | 372 | 16.2 | ||
UKIP | Mary Elizabeth Jane Walker | 92 | 4.0 | ||
Liberal Democrats | David Vaughan Scott | 66 | 2.9 | ||
Green | John Paul Barton | 53 | 2.3 | ||
Turnout | |||||
Labour win (new seat) |
Party | Candidate | Votes | % | ±% | |
---|---|---|---|---|---|
Conservative | Ted Parton | 1,329 | 48.0 | ||
Labour | William Robert Sharp | 1,107 | 40.0 | ||
Liberal Democrats | Alex Guerrero | 105 | 3.8 | ||
Green | Caroline Harman | 101 | 3.7 | ||
UKIP | Frederick Roger Wakeford | 93 | 3.4 | ||
British Democratic | Kevan Christopher Stafford | 30 | 1.1 | ||
Turnout | |||||
Conservative win (new seat) |
Party | Candidate | Votes | % | ±% | |
---|---|---|---|---|---|
Conservative | Jonathan Morgan | 2,011 | 52.8 | ||
Labour | Paul Emanuele Boldrin | 907 | 23.8 | ||
Liberal Democrats | David Robert Frank Walker | 444 | 11.6 | ||
Green | Paul Justin Goodman | 244 | 6.4 | ||
UKIP | Jim Foxall | 202 | 5.3 | ||
Turnout | |||||
Conservative win (new seat) |
Party | Candidate | Votes | % | ±% | |
---|---|---|---|---|---|
Conservative | Hilary Jean Fryer | 1,855 | 54.0 | ||
Labour | Alice Brennan | 757 | 22.0 | ||
Liberal Democrats | Carolyn Julia Thornborow | 396 | 11.5 | ||
UKIP | Andy McWilliam | 277 | 8.1 | ||
Green | Ben Woolley | 14 | 4.2 | ||
Turnout | |||||
Conservative win (new seat) |
Party | Candidate | Votes | % | ±% | |
---|---|---|---|---|---|
Conservative | Peter Charles Osborne | 1,735 | 63.6 | ||
Labour | Julie May Palmer | 450 | 16.5 | ||
Liberal Democrats | Marianne Gilbert | 305 | 11.1 | ||
UKIP | Jamie Bye | 236 | 8.7 | ||
Turnout | |||||
Conservative win (new seat) |
Party | Candidate | Votes | % | ±% | |
---|---|---|---|---|---|
Conservative | Christine Mary Radford | 1,836 | 51.0 | ||
Labour | Claire Marie Poole | 1,095 | 30.4 | ||
UKIP | Diane Jayne Horn | 364 | 10.1 | ||
Liberal Democrats | Donald Peter Cochrane | 213 | 5.9 | ||
Green | Mia Alexandra Woolley | 87 | 2.4 | ||
Turnout | |||||
Conservative win (new seat) |
Party | Candidate | Votes | % | ±% | |
---|---|---|---|---|---|
Conservative | Richard James Shepherd | 1,786 | 59.4 | ||
Labour | Valerie Susan Marriott | 621 | 20.6 | ||
Liberal Democrats | Nicky Ashby | 280 | 9.3 | ||
UKIP | Geoffrey Stanley | 160 | 5.3 | ||
Green | Billy Richards | 159 | 5.3 | ||
Turnout | |||||
Conservative win (new seat) |
Party | Candidate | Votes | % | ±% | |
---|---|---|---|---|---|
Conservative | James Mark Poland | 1,716 | 67.6 | ||
Labour | Janet Knaggs | 380 | 14.9 | ||
UKIP | Gregory James Hubbard | 188 | 7.4 | ||
Green | Laurie Needham | 132 | 5.2 | ||
Liberal Democrats | Mat Martel | 119 | 4.7 | ||
Turnout | |||||
Conservative win (new seat) |
Party | Candidate | Votes | % | ±% | |
---|---|---|---|---|---|
Conservative | David Paul Slater | 1,266 | 57.6 | ||
Labour | Michael Francis McLoughlin | 457 | 20.8 | ||
Green | Matthew Robert Wise | 185 | 8.4 | ||
UKIP | Martin William Brown | 156 | 7.1 | ||
Liberal Democrats | Ian Robert Sharpe | 131 | 6.0 | ||
Turnout | |||||
Conservative win (new seat) |
Party | Candidate | Votes | % | ±% | |
---|---|---|---|---|---|
Conservative | Brenda Seaton | 1,271 | 54.0 | ||
Labour | Kate Jane Knaggs | 786 | 33.4 | ||
UKIP | Ian Edward Hayes | 159 | 6.8 | ||
Liberal Democrats | Nitesh Pravin Dave | 136 | 5.8 | ||
Turnout | |||||
Conservative win (new seat) |
Party | Candidate | Votes | % | ±% | |
---|---|---|---|---|---|
Conservative | Bill Liquorish | 1,893 | 69.9 | ||
Labour | Sandra Parkinson | 414 | 15.2 | ||
Liberal Democrats | Colin Trevor Porter | 399 | 14.7 | ||
Turnout | |||||
Conservative win (new seat) |
Party | Candidate | Votes | % | ±% | |
---|---|---|---|---|---|
Conservative | Blake Pain | 2,460 | 67.9 | ||
Liberal Democrats | Peter St. Quintin Bridge | 605 | 16.7 | ||
Labour | Liz Marsh | 553 | 15.2 | ||
Turnout | |||||
Conservative win (new seat) |
Party | Candidate | Votes | % | ±% | |
---|---|---|---|---|---|
Conservative | Kevin Feltham | 2,354 | 67.5 | ||
Labour | Ruth Commons | 406 | 11.6 | ||
Liberal Democrats | James Francis Lindsay | 395 | 11.3 | ||
Green | David Green | 181 | 5.2 | ||
UKIP | Brett Lynes | 150 | 4.3 | ||
Turnout | |||||
Conservative win (new seat) |
Party | Candidate | Votes | % | ±% | |
---|---|---|---|---|---|
Liberal Democrats | Simon James Galton | 2,265 | 56.0 | ||
Conservative | Simon Christopher Whelband | 1,369 | 33.8 | ||
Labour | Paddy Casswell | 204 | 5.1 | ||
UKIP | Victor James Burbidge | 120 | 3.0 | ||
Green | Karon Christina Phillips | 81 | 2.0 | ||
Turnout | |||||
Liberal Democrats win (new seat) |
Party | Candidate | Votes | % | ±% | |
---|---|---|---|---|---|
Conservative | Rosita Page | 2,138 | 62.7 | ||
Liberal Democrats | Martin Sarfas | 710 | 20.8 | ||
Labour | David Robert Frazer Gair | 561 | 16.4 | ||
Turnout | |||||
Conservative win (new seat) |
Party | Candidate | Votes | % | ±% | |
---|---|---|---|---|---|
Liberal Democrats | Sarah Hill | 1,911 | 46.4 | ||
Conservative | Phil King | 1,662 | 40.4 | ||
Labour | Andy Thomas | 375 | 9.1 | ||
Green | Jamie Ackerley | 165 | 4.0 | ||
Turnout | |||||
Liberal Democrats win (new seat) |
Party | Candidate | Votes | % | ±% | |
---|---|---|---|---|---|
Conservative | Paul Bremner | 1,577 | 45.2 | ||
Liberal Democrats | Peter James | 1,265 | 36.2 | ||
Labour | Ian Snaith | 399 | 11.4 | ||
Green | Darren Neil Woodiwiss | 247 | 7.1 | ||
Turnout | |||||
Conservative win (new seat) |
Party | Candidate | Votes | % | ±% | |
---|---|---|---|---|---|
Conservative | Amanda Victoria Wright | 2,049 | 54.2 | ||
Liberal Democrats | Keith William Philip Lynch | 1,214 | 32.1 | ||
Labour | Marie Jeanette Mills | 345 | 9.1 | ||
UKIP | Neale Lee Smith | 167 | 4.4 | ||
Turnout | |||||
Conservative win (new seat) |
Party | Candidate | Votes | % | ±% | |
---|---|---|---|---|---|
Liberal Democrats | Michael Timothy Mullaney | 2,002 | 52.8 | ||
Conservative | Rosemary Wells Wright | 1,488 | 39.2 | ||
Labour | Roger Hill | 299 | 7.9 | ||
Turnout | |||||
Liberal Democrats win (new seat) |
Party | Candidate | Votes | % | ±% | |
---|---|---|---|---|---|
Conservative | Janice Richards | 1,644 | 59.4 | ||
Labour | Christine Dallas | 628 | 22.7 | ||
Liberal Democrats | Mathew Scott Hulbert | 266 | 9.6 | ||
UKIP | Keith Cowen | 226 | 8.2 | ||
Turnout | |||||
Conservative win (new seat) |
Party | Candidate | Votes | % | ±% | |
---|---|---|---|---|---|
Conservative | Ozzy O'Shea | 2,315 | 76.2 | ||
Labour | David Arthur Hutchins | 422 | 13.9 | ||
Liberal Democrats | Muriel Joyce Crooks | 173 | 5.7 | ||
UKIP | Rahaul Paul Sharma | 125 | 4.1 | ||
Turnout | |||||
Conservative win (new seat) |
Party | Candidate | Votes | % | ±% | |
---|---|---|---|---|---|
Liberal Democrats | David C Bill | 1,523 | 53.9 | ||
Conservative | Christopher Andrew Ashton | 838 | 29.7 | ||
Labour | Chris Kealey | 283 | 10.0 | ||
UKIP | Chris Simpson | 177 | 6.3 | ||
Turnout | |||||
Liberal Democrats win (new seat) |
Party | Candidate | Votes | % | ±% | |
---|---|---|---|---|---|
Liberal Democrats | Bill Crooks | 1,569 | 45.3 | ||
Conservative | Ruth Camamile | 1,189 | 34.3 | ||
Labour | Rick Middleton | 442 | 12.7 | ||
UKIP | Mark Thomas Farmer | 263 | 7.6 | ||
Turnout | |||||
Liberal Democrats win (new seat) |
Party | Candidate | Votes | % | ±% | |
---|---|---|---|---|---|
Conservative | Ivan Donald Ould | 2,574 | 71.1 | ||
Labour | Kate Anderton | 456 | 12.5 | ||
Liberal Democrats | Ann Clay | 406 | 11.2 | ||
UKIP | Alan Wood | 184 | 5.1 | ||
Turnout | |||||
Conservative win (new seat) |
Party | Candidate | Votes | % | ±% | |
---|---|---|---|---|---|
Conservative | Peter Alexander Bedford | 1,651 | 47.6 | ||
UKIP | David Anthony Sprason | 879 | 25.3 | ||
Labour | Lesley Diane Neville | 641 | 18.5 | ||
Liberal Democrats | Robin Webber-Jones | 292 | 8.4 | ||
Turnout | |||||
Conservative win (new seat) |
Party | Candidate | Votes | % | ±% | |
---|---|---|---|---|---|
Liberal Democrats | Stuart Lee Bray | 1,255 | 44.7 | ||
Conservative | Mike Hall | 935 | 33.3 | ||
Labour | Christine Emmett | 348 | 12.4 | ||
UKIP | Elaine Louise Simpson | 187 | 6.7 | ||
Independent | Benn Gerald Leslie Moore | 77 | 2.7 | ||
Turnout | |||||
Liberal Democrats win (new seat) |
Party | Candidate | Votes | % | ±% | |
---|---|---|---|---|---|
Conservative | Byron Rhodes | 2,216 | 66.0 | ||
Labour | Andre Wheeler | 348 | 10.3 | ||
Green | Colette Stein | 300 | 8.9 | ||
Liberal Democrats | Lily Kaufman | 266 | 7.9 | ||
UKIP | Graham Hall | 224 | 6.7 | ||
Turnout | |||||
Conservative win (new seat) |
Party | Candidate | Votes | % | ±% | |
---|---|---|---|---|---|
Conservative | Pam Posnett | 2,079 | 64.2 | ||
Labour | James Colin Ellis | 455 | 14.0 | ||
UKIP | John Frederick Charles Scutter | 286 | 8.8 | ||
Green | Alastair James McQuillan | 242 | 7.5 | ||
Liberal Democrats | Ian Keith Ridley | 173 | 5.3 | ||
Turnout | |||||
Conservative win (new seat) |
Party | Candidate | Votes | % | ±% | |
---|---|---|---|---|---|
Conservative | Alan Pearson | 1,471 | 60.6 | ||
Labour | Stef Blase | 724 | 29.8 | ||
Liberal Democrats | Sam Asplin | 232 | 9.6 | ||
Turnout | |||||
Conservative win (new seat) |
Party | Candidate | Votes | % | ±% | |
---|---|---|---|---|---|
Conservative | Joe Orson | 2,201 | 69.6 | ||
Labour | Marion Elaine Smith | 316 | 10.0 | ||
Liberal Democrats | Ian Lauder | 253 | 8.0 | ||
Green | Woody Kitson | 230 | 7.3 | ||
UKIP | Joy Elaine Sharman | 160 | 5.1 | ||
Turnout | |||||
Conservative win (new seat) |
Party | Candidate | Votes | % | ±% | |
---|---|---|---|---|---|
Conservative | John Geoffrey Coxon | 1,658 | 53.8 | ||
Labour | Doug Cooper | 950 | 30.8 | ||
Liberal Democrats | Vivienne Brooks | 253 | 8.2 | ||
UKIP | Simon Richard Aked | 218 | 7.1 | ||
Turnout | |||||
Conservative win (new seat) |
Party | Candidate | Votes | % | ±% | |
---|---|---|---|---|---|
Conservative | Trevor John Pendleton | 1,528 | 57.4 | ||
Labour | Michael David Hay | 680 | 25.5 | ||
UKIP | David Michael Outterside | 232 | 8.7 | ||
Liberal Democrats | Moira Lynch | 218 | 8.2 | ||
Turnout | |||||
Conservative win (new seat) |
Party | Candidate | Votes | % | ±% | |
---|---|---|---|---|---|
Labour | Terri Eynon | 1,158 | 41.1 | ||
Conservative | Annette Bridges | 816 | 28.9 | ||
Liberal Democrats | Barry Wyatt | 486 | 17.2 | ||
UKIP | George Norley | 288 | 10.2 | ||
Independent | Graham Ronald Partner | 66 | 2.3 | ||
Turnout | |||||
Labour win (new seat) |
Party | Candidate | Votes | % | ±% | |
---|---|---|---|---|---|
Liberal Democrats | Michael Barry Wyatt | 1,153 | 38.4 | ||
Conservative | John Cotterill | 836 | 27.8 | ||
Labour | Mark Burton | 774 | 25.8 | ||
UKIP | Mick Warren | 237 | 7.9 | ||
Turnout | |||||
Liberal Democrats win (new seat) |
Party | Candidate | Votes | % | ±% | |
---|---|---|---|---|---|
Labour | Sean David Sheahan | 1,125 | 44.5 | ||
Conservative | Gill Hoult | 1,087 | 43.0 | ||
UKIP | Martin Lee Green | 217 | 8.6 | ||
Liberal Democrats | Aaron Windram | 97 | 3.8 | ||
Turnout | |||||
Labour win (new seat) |
Party | Candidate | Votes | % | ±% | |
---|---|---|---|---|---|
Conservative | Dan Harrison | 1,500 | 52.5 | ||
Labour | Mary Draycott | 846 | 29.6 | ||
UKIP | Val Pulford | 302 | 10.5 | ||
Liberal Democrats | Lee James Windram | 207 | 7.3 | ||
Turnout | |||||
Conservative win (new seat) |
Party | Candidate | Votes | % | ±% | |
---|---|---|---|---|---|
Conservative | Nick Rushton | 2,425 | 63.2 | ||
Labour | Dominic McDevitt | 677 | 17.6 | ||
Liberal Democrats | Paul Andrew Tyler | 429 | 11.1 | ||
UKIP | Martin Peter Farrand | 305 | 8.0 | ||
Turnout | |||||
Conservative win (new seat) |
Party | Candidate | Votes | % | ±% | |
---|---|---|---|---|---|
Conservative | Tony Gillard | 1,805 | 54.1 | ||
Labour | Dave Everitt | 1,017 | 30.4 | ||
UKIP | Tim Pulford | 278 | 8.3 | ||
Liberal Democrats | Maureen Wyatt | 235 | 7.0 | ||
Turnout | |||||
Conservative win (new seat) |
Party | Candidate | Votes | % | ±% | |
---|---|---|---|---|---|
Liberal Democrats | Michael Henry Charlesworth | 1,888 | 60.2 | ||
Conservative | Rani Mahal | 905 | 28.8 | ||
Labour | Maureen Waugh | 343 | 10.9 | ||
Turnout | |||||
Liberal Democrats win (new seat) |
Party | Candidate | Votes | % | ±% | |
---|---|---|---|---|---|
Liberal Democrats | Linda Margaret Broadley | 1,506 | 51.6 | ||
Conservative | Liz Darling | 909 | 31.1 | ||
Labour | Jen Williams | 503 | 17.2 | ||
Turnout | |||||
Liberal Democrats win (new seat) |
Party | Candidate | Votes | % | ±% | |
---|---|---|---|---|---|
Liberal Democrats | Dean Adam Gamble | 2,718 | 44.8 | ||
Liberal Democrats | Jeffrey Kaufmann | 2,603 | 42.9 | ||
Conservative | Bhupen Dave | 1,912 | 31.5 | ||
Conservative | Stephen Alexander Bilbie | 1,782 | 29.4 | ||
Labour | Gurpal Singh Atwal | 1,230 | 20.3 | ||
Labour | Camille Lesley Ievers Naylor | 1,078 | 17.8 | ||
UKIP | Mark James Hunt | 318 | 5.2 | ||
Turnout | |||||
Liberal Democrats win (new seat) |
Party | Candidate | Votes | % | ±% | |
---|---|---|---|---|---|
Liberal Democrats | Bill Boulter | 1,360 | 60.7 | ||
Conservative | Anne Rosemary Bond | 565 | 25.2 | ||
Labour | Matthew William Luke | 314 | 14.0 | ||
Turnout | |||||
Liberal Democrats win (new seat) |
Leicestershire is a ceremonial county in the East Midlands of England. It is bordered by Derbyshire, Nottinghamshire, and Lincolnshire to the north, Rutland to the east, Northamptonshire to the south-east, Warwickshire to the south-west, and Staffordshire to the west. The city of Leicester is the largest settlement and the county town.
Kirby Muxloe is a large village and civil parish that forms part of the Blaby district of Leicestershire, England. Located to the west of Leicester, its proximity to the city has resulted in its inclusion in the Leicester Urban Area. The Leicester Forest East parish border runs along the Hinckley Road A47. According to the 2001 census, the parish had a population of 4,523, which had increased to 4,667 at the 2011 census.
Oadby and Wigston is a local government district with borough status in Leicestershire, England. It covers the two towns of Oadby, where the council is based, and Wigston, which is the larger town. Both form part of the Leicester urban area, lying south-east of the city.
Blaby is a local government district in Leicestershire, England. The district is named after the village of Blaby, although the council is based in Narborough. The district covers an area lying south-west of the city of Leicester. Several of the district's settlements form part of the wider Leicester Urban Area, including Glenfield, where Leicestershire County Council has its headquarters at County Hall, and the town of Braunstone.
Harborough is a local government district in Leicestershire, England. It is named after its main town, Market Harborough, which is where the council is based. The district also includes the town of Lutterworth and numerous villages and surrounding rural areas. In the north of the district it includes parts of the Leicester Urban Area, notably at Thurnby, Bushby and Scraptoft. Covering 230 square miles (600 km2), the district is the largest by area of the eight districts in Leicestershire and covers almost a quarter of the county.
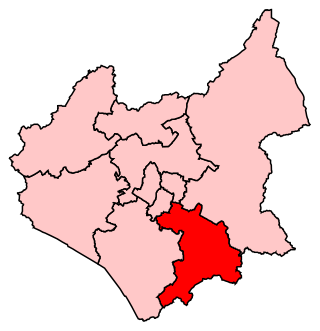
Harborough is a constituency covering the south east of Leicestershire represented in the House of Commons of the UK Parliament since 2017 by Neil O'Brien of the Conservative Party.
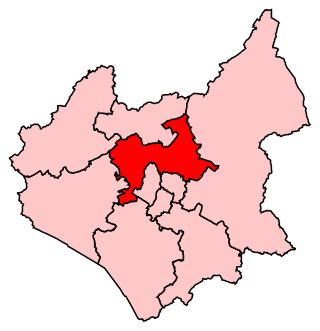
Charnwood is a constituency in Leicestershire represented in the House of Commons of the UK Parliament since 2015 by Edward Argar, a Conservative.
Leicester City Council is a unitary authority responsible for local government in the city of Leicester, England. It consists of 54 councillors, representing 22 wards in the city, overseen by a directly elected mayor. It is currently controlled by the Labour Party and has been led by mayor Sir Peter Soulsby since 2011. The council also appoints a ceremonial Lord Mayor who chairs council meetings; the directly elected mayor is termed the City Mayor to distinguish the post from the Lord Mayor.
Leicestershire County Council is the county council for the English non-metropolitan county of Leicestershire. It was originally formed in 1889 by the Local Government Act 1888. The county is divided into 53 electoral divisions, which return a total of 55 councillors. The council is controlled by the Conservative Party. The leader of the county council is currently Nick Rushton, who was elected to the post in September 2012. The headquarters of the council is County Hall beside the A50 at Glenfield, just outside the city of Leicester in Blaby district.
Leicester City Council elections are held every four years. Leicester City Council is the local authority for the unitary authority of Leicester in Leicestershire, England. Until 1 April 1997 it was a non-metropolitan district. Since 2011 it has also had a directly elected mayor. Since the last boundary changes in 2015, 54 councillors have been elected from 21 wards.
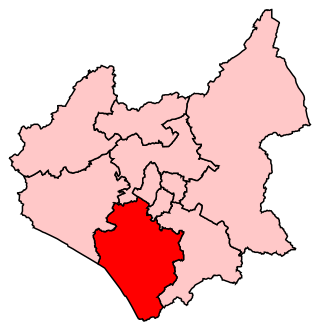
South Leicestershire is a constituency represented in the House of Commons of the UK Parliament since 2015 by Alberto Costa, a member of the Conservative Party.
The Leicestershire Senior League is a football competition based in Leicestershire, England.
Kirby Muxloe Football Club is a football club based in Kirby Muxloe, Leicestershire, England. They are currently members of the United Counties League Division One and play at Ratby Lane.
Leicestershire County Council elections are held every four years. Leicestershire County Council is the upper-tier authority for the non-metropolitan county of Leicestershire in England. Since the last boundary changes in 2017, 55 county councillors have been elected from 53 electoral divisions.
Oadby and Wigston Borough Council elections are held every four years. Oadby and Wigston Borough Council is the local authority for the non-metropolitan district of Oadby and Wigston in Leicestershire, England. Since the last boundary changes in 2003, 26 councillors have been elected from 10 wards.
An election to Leicestershire County Council took place on 2 May 2013 as part of the 2013 United Kingdom local elections. 55 councillors were elected from 52 electoral divisions, which returned either one or two county councillors each by first-past-the-post voting for a four-year term of office. The Conservatives held control of the council with a reduced majority of 5 seats. Despite a strong challenge from UKIP, the party only gained 2 seats whilst the Liberal Democrats lost one seat and Labour recouped some of their 2009 losses, gaining 6 seats.
The 2023 Blaby District Council election took place on 4 May 2023 to elect members of the Blaby District Council in England. They were held on the same day as other local elections.