Result maps
 2003 results map
 2007 results map
 2011 results map
 2015 results map
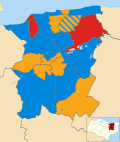
 2019 results map
 2023 results map
Canterbury City Council is the local authority for the City of Canterbury. The council is elected every four years.
| Year | Conservative | Labour | Liberal Democrats [a] | Green | UKIP | Independents & Others | Council control after election | |
|---|---|---|---|---|---|---|---|---|
| Local government reorganisation; council established (51 seats) | ||||||||
| 1973 | 34 | 7 | 1 | – | – | 9 | Conservative | |
| 1976 | 46 | 1 | 0 | 0 | – | 4 | Conservative | |
| New ward boundaries (49 seats) | ||||||||
| 1979 | 37 | 6 | 0 | 0 | – | 6 | Conservative | |
| 1983 | 37 | 7 | 3 | 0 | – | 2 | Conservative | |
| 1987 | 33 | 5 | 11 | 0 | – | 0 | Conservative | |
| 1991 | 19 | 7 | 23 | 0 | – | 0 | No overall control | |
| 1995 | 10 | 15 | 24 | 0 | 0 | 0 | No overall control | |
| 1999 | 18 | 14 | 17 | 0 | 0 | 0 | No overall control | |
| New ward boundaries (50 seats) | ||||||||
| 2003 | 24 | 7 | 19 | 0 | 0 | 0 | No overall control | |
| 2007 | 29 | 2 | 19 | 0 | 0 | 0 | Conservative | |
| 2011 | 36 | 3 | 11 | 0 | 0 | 0 | Conservative | |
| New ward boundaries (39 seats) | ||||||||
| 2015 | 31 | 3 | 3 | 0 | 2 | 0 | Conservative | |
| 2019 | 23 | 10 | 6 | 0 | 0 | 0 | Conservative | |
| 2023 | 8 | 18 | 9 | 4 | 0 | 0 | No overall control | |


| Party | Candidate | Votes | % | ±% | |
|---|---|---|---|---|---|
| Conservative | Ian Thomas | 564 | 35.1 | ||
| Liberal Democrats | 552 | 34.4 | |||
| Labour | 490 | 30.5 | |||
| Majority | 12 | 0.7 | |||
| Turnout | 1,606 | 51.0 | |||
| Conservative gain from Liberal Democrats | Swing | ||||
| Party | Candidate | Votes | % | ±% | |
|---|---|---|---|---|---|
| Labour | 577 | 44.1 | −12.1 | ||
| Conservative | 567 | 43.3 | +11.3 | ||
| Liberal Democrats | 151 | 11.5 | −0.4 | ||
| UKIP | 14 | 1.1 | +1.1 | ||
| Majority | 10 | 0.8 | |||
| Turnout | 1,309 | ||||
| Labour hold | Swing | ||||
| Party | Candidate | Votes | % | ±% | |
|---|---|---|---|---|---|
| Labour | 313 | 49.8 | −13.2 | ||
| Conservative | 183 | 29.1 | +2.0 | ||
| Liberal Democrats | 133 | 21.1 | +13.8 | ||
| Majority | 130 | 20.7 | |||
| Turnout | 629 | ||||
| Labour hold | Swing | ||||
| Party | Candidate | Votes | % | ±% | |
|---|---|---|---|---|---|
| Liberal Democrats | Heather Lloyd | 329 | 38.3 | +21.6 | |
| Conservative | Elizabeth Taylor | 289 | 33.7 | −0.6 | |
| Labour | Alan Thomas | 241 | 28.1 | −21.0 | |
| Majority | 40 | 4.6 | |||
| Turnout | 859 | 44.3 | |||
| Liberal Democrats gain from Labour | Swing | ||||
| Party | Candidate | Votes | % | ±% | |
|---|---|---|---|---|---|
| Liberal Democrats | Nigel Oakes | 867 | 37.6 | +5.2 | |
| Conservative | Alan White | 797 | 34.5 | +9.0 | |
| Labour | David Hornsby | 344 | 14.9 | −2.6 | |
| Green | Carol Davis | 187 | 8.1 | −3.0 | |
| UKIP | John Moore | 112 | 4.9 | +4.9 | |
| Majority | 70 | 3.1 | |||
| Turnout | 2,307 | 26.8 | |||
| Liberal Democrats hold | Swing | ||||
| Party | Candidate | Votes | % | ±% | |
|---|---|---|---|---|---|
| Conservative | Michael Northey | 1,184 | 35.4 | −2.3 | |
| Liberal Democrats | Valerie Ainscough | 1,177 | 35.2 | −11.6 | |
| Labour | Theresa Mawson | 824 | 24.6 | +9.0 | |
| Green | Steven Dawe | 163 | 4.9 | +4.9 | |
| Majority | 7 | 0.2 | |||
| Turnout | 3,348 | 62.4 | |||
| Conservative gain from Liberal Democrats | Swing | ||||
| Party | Candidate | Votes | % | ±% | |
|---|---|---|---|---|---|
| Conservative | John Anderson | 544 | 50.9 | −5.3 | |
| Liberal Democrats | Janet Horsley | 478 | 44.7 | +0.9 | |
| UKIP | John Moore | 26 | 2.4 | +2.4 | |
| Labour | Paul Todd | 21 | 2.0 | +2.0 | |
| Majority | 66 | 6.2 | |||
| Turnout | 1,069 | 53.0 | |||
| Conservative hold | Swing | ||||
| Party | Candidate | Votes | % | ±% | |
|---|---|---|---|---|---|
| Conservative | Michael Northey | 820 | 44.8 | +10.4 | |
| Liberal Democrats | James Flanagan | 697 | 38.0 | −4.3 | |
| Green | Keith Bothwell | 145 | 7.9 | +0.9 | |
| Labour | Laurence Ward | 100 | 5.5 | −5.1 | |
| Council Tax Payers Party | James Cooper | 70 | 3.8 | −2.0 | |
| Majority | 123 | 6.8 | |||
| Turnout | 1,832 | 31.8 | |||
| Conservative gain from Liberal Democrats | Swing | ||||
| Party | Candidate | Votes | % | ±% | |
|---|---|---|---|---|---|
| Conservative | Vincent McMahan | 1,177 | 37.6 | −13.2 | |
| Liberal Democrats | Kevin Sims | 992 | 31.7 | +13.5 | |
| Labour | Brian Hunter | 754 | 24.1 | −6.9 | |
| UKIP | John Moore | 205 | 6.6 | +6.6 | |
| Majority | 185 | 5.9 | |||
| Turnout | 3,128 | 67.5 | |||
| Conservative hold | Swing | ||||
| Party | Candidate | Votes | % | ±% | |
|---|---|---|---|---|---|
| Conservative | Heather Taylor | 474 | 52.4 | −23.1 | |
| Liberal Democrats | David Mummery | 318 | 35.1 | +23.3 | |
| Labour | Andrew Fenyo | 89 | 9.8 | −2.8 | |
| Independent | John Moore | 24 | 2.6 | +2.6 | |
| Majority | 156 | 17.3 | |||
| Turnout | 905 | 41.3 | |||
| Conservative hold | Swing | ||||
| Party | Candidate | Votes | % | ±% | |
|---|---|---|---|---|---|
| Liberal Democrats | Michael Steed | 993 | 51.8 | +9.3 | |
| Conservative | Mark Evans | 701 | 36.6 | +2.7 | |
| Green | Keith Bothwell | 121 | 6.3 | +6.3 | |
| Independent | Blue Cooper | 102 | 5.3 | −0.7 | |
| Majority | 292 | 15.2 | |||
| Turnout | 1,917 | 33.1 | |||
| Liberal Democrats hold | Swing | ||||
| Party | Candidate | Votes | % | ±% | |
|---|---|---|---|---|---|
| Conservative | Ben Fitter | 342 | 44.2 | −7.5 | |
| Labour | Carol Goldstein | 185 | 23.9 | +23.9 | |
| Liberal Democrats | Dan Smith | 121 | 15.6 | +0.4 | |
| Green | Russell Page | 64 | 8.3 | −24.8 | |
| UKIP | Howard Farmer | 38 | 4.9 | +4.9 | |
| Independent | John Hippisley | 24 | 3.1 | +3.1 | |
| Majority | 157 | 20.3 | |||
| Turnout | 774 | ||||
| Conservative hold | Swing | ||||
| Party | Candidate | Votes | % | ±% | |
|---|---|---|---|---|---|
| Conservative | Louise Morgan | 789 | 38.4 | −21.5 | |
| UKIP | Howard Farmer | 706 | 34.3 | +34.3 | |
| Labour | Rachel Goodwin | 427 | 20.8 | −6.7 | |
| Liberal Democrats | Debra Enever | 93 | 4.5 | −8.1 | |
| TUSC | Eriks Puce | 41 | 2.0 | +2.0 | |
| Majority | 83 | 4.0 | |||
| Turnout | 2,056 | ||||
| Conservative hold | Swing | ||||
| Party | Candidate | Votes | % | ±% | |
|---|---|---|---|---|---|
| UKIP | Mike Bull | 644 | 38.5 | +38.5 | |
| Conservative | Annette Stein | 522 | 31.2 | −28.7 | |
| Labour | Rachel Goodwin | 307 | 18.3 | −9.2 | |
| Liberal Democrats | Keith Hooker | 147 | 8.8 | −3.8 | |
| Green | Russell Page | 54 | 3.2 | +3.2 | |
| Majority | 122 | 7.3 | |||
| Turnout | 1,674 | ||||
| UKIP gain from Conservative | Swing | ||||
| Party | Candidate | Votes | % | ±% | |
|---|---|---|---|---|---|
| Liberal Democrats | Michael Sole | 337 | 37.3 | −3.4 | |
| Conservative | Stuart Walker | 285 | 31.5 | −11.4 | |
| UKIP | Dave de Boick | 164 | 18.1 | +18.1 | |
| Labour | David Wilson | 78 | 8.6 | +8.6 | |
| Green | Pat Marsh | 40 | 4.4 | −12.0 | |
| Majority | 52 | 5.8 | |||
| Turnout | 904 | ||||
| Liberal Democrats gain from Conservative | Swing | ||||
| Party | Candidate | Votes | % | ±% | |
|---|---|---|---|---|---|
| Conservative | Ann Taylor | 421 | 39.3 | −31.7 | |
| UKIP | Mick O'Brien | 306 | 28.6 | +28.6 | |
| Labour | Simon Warley | 251 | 23.4 | −5.6 | |
| Liberal Democrats | Ann Anderson | 93 | 8.7 | +8.7 | |
| Majority | 115 | 10.7 | |||
| Turnout | 1,071 | ||||
| Conservative hold | Swing | ||||
| Party | Candidate | Votes | % | ±% | |
|---|---|---|---|---|---|
| Labour | Simon Warley | 1,761 | 43.4 | +24.1 | |
| Liberal Democrats | Daniel Prevett | 978 | 24.1 | +0.7 | |
| Conservative | Luke Whiddett | 929 | 22.9 | −3.8 | |
| Green | Henry Stanton | 389 | 9.6 | −9.8 | |
| Majority | 783 | 19.3 | |||
| Turnout | 4,057 | ||||
| Labour gain from Conservative | Swing | ||||
| Party | Candidate | Votes | % | ±% | |
|---|---|---|---|---|---|
| Conservative | Ben Fitter-Harding | 728 | 46.0 | −6.5 | |
| Liberal Democrats | Peter Old | 562 | 35.5 | +18.9 | |
| Labour | Morag Warren | 140 | 8.8 | −6.9 | |
| Independent | Joe Egerton | 84 | 5.3 | +5.3 | |
| Green | Nicole David | 68 | 4.3 | −10.9 | |
| Majority | 166 | 10.5 | |||
| Turnout | 1,582 | ||||
| Conservative hold | Swing | ||||
| Party | Candidate | Votes | % | ±% | |
|---|---|---|---|---|---|
| Conservative | Mark Dance | 616 | 42.6 | −3.7 | |
| Green | Keith Bothwell | 527 | 36.5 | +20.6 | |
| Labour | Craig Potter | 278 | 19.2 | −11.6 | |
| Independent | Joe Egerton | 24 | 1.7 | +1.7 | |
| Majority | 89 | 6.2 | |||
| Turnout | 1,445 | ||||
| Conservative hold | Swing | ||||
| Party | Candidate | Votes | % | ±% | |
|---|---|---|---|---|---|
| Labour | Pip Hazelton | 842 | 39.2 | +5.4 | |
| Liberal Democrats | Alex Lister | 661 | 30.8 | −6.5 | |
| Conservative | Jake Warman | 404 | 18.8 | +9.2 | |
| Green | Terry Thompson | 242 | 11.3 | +2.0 | |
| Majority | 181 | 8.4 | |||
| Turnout | 2,149 | ||||
| Labour hold | Swing | ||||
| Party | Candidate | Votes | % | ±% | |
|---|---|---|---|---|---|
| Green | Clare Turnbull | 1,149 | 43.9 | +10.3 | |
| Labour | Dane Buckman | 803 | 30.7 | −6.0 | |
| Conservative | Stephen Spencer | 608 | 23.2 | +0.2 | |
| Workers Party | Colin Gardner | 58 | 2.2 | +2.2 | |
| Majority | 346 | 13.2 | |||
| Turnout | 2,618 | ||||
| Green gain from Labour | Swing | ||||
| Party | Candidate | Votes | % | ±% | |
|---|---|---|---|---|---|
| Green | Stuart Heaver | 1,210 | 49.5 | ||
| Labour | Valerie Kenny | 570 | 23.3 | ||
| Reform | Babychan Thomas | 423 | 17.3 | ||
| Conservative | Janet Newcombe | 179 | 7.3 | ||
| Liberal Democrats | Nick Parry | 64 | 2.6 | ||
| Majority | 640 | 26.2 | |||
| Turnout | 2,446 | ||||
| Green hold | Swing | ||||
| Party | Candidate | Votes | % | ±% | |
|---|---|---|---|---|---|
| Conservative | Grace Paget | 557 | 40.7 | ||
| Reform | Mark Mulvihill | 473 | 34.6 | ||
| Labour | Lawrence Coomber | 196 | 14.3 | ||
| Liberal Democrats | Derek Maslin | 102 | 7.5 | ||
| Green | Peter Campbell | 41 | 3.0 | ||
| Majority | 84 | 6.1 | |||
| Turnout | 1,369 | ||||
| Conservative hold | Swing | ||||
| Party | Candidate | Votes | % | ±% | |
|---|---|---|---|---|---|
| Labour | Beth Forrester | 628 | 47.0 | ||
| Reform | Colin Spooner | 245 | 18.3 | ||
| Liberal Democrats | Christopher Palmer | 220 | 16.5 | ||
| Conservative | Arjan Taylor | 128 | 9.6 | ||
| Green | Jessie Millner | 116 | 8.7 | ||
| Majority | 383 | 28.6 | |||
| Turnout | 1,337 | ||||
| Labour hold | Swing | ||||
| Party | Candidate | Votes | % | ±% | |
|---|---|---|---|---|---|
| Green | Peter Campbell | 842 | 39.1 | +24.0 | |
| Liberal Democrats | Guy Meurice | 518 | 24.1 | −12.2 | |
| Reform | Colin Spooner | 351 | 16.3 | +16.3 | |
| Labour | Jasmin Dallos-Foreman | 276 | 12.8 | −25.6 | |
| Conservative | Elliot Curryer | 166 | 7.7 | −2.6 | |
| Majority | 324 | 15.0 | |||
| Turnout | 2,153 | ||||
| Green gain from Liberal Democrats | Swing | ||||