Borough result maps
 2003 results map
 2007 results map
 2011 results map
 2015 results map
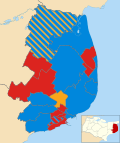
 2019 results map
 2023 results map
Dover District Council is the local authority for the Dover District in Kent, England. The council is elected every four years.
| Year | Conservative | Labour | Liberal Democrats [a] | UKIP | Independents & Others | Council control after election | ||
|---|---|---|---|---|---|---|---|---|
| Local government reorganisation; council established (55 seats) | ||||||||
| 1973 | 29 | 21 | 0 | – | 5 | Conservative | ||
| 1976 | 35 | 17 | 0 | – | 3 | Conservative | ||
| New ward boundaries (56 seats) | ||||||||
| 1979 | 35 | 19 | 1 | – | 1 | Conservative | ||
| 1983 | 39 | 17 | 0 | – | 0 | Conservative | ||
| 1987 | 33 | 19 | 4 | – | 0 | Conservative | ||
| 1991 | 28 | 21 | 6 | – | 1 | No overall control | ||
| 1995 | 13 | 39 | 4 | 0 | 0 | Labour | ||
| 1999 | 26 | 28 | 1 | 0 | 1 | No overall control | ||
| New ward boundaries (45 seats) | ||||||||
| 2003 | 22 | 20 | 3 | 0 | 0 | No overall control | ||
| 2007 | 28 | 15 | 2 | 0 | 0 | Conservative | ||
| 2011 | 26 | 19 | 0 | 0 | 0 | Conservative | ||
| 2015 | 25 | 17 | 0 | 3 | 0 | Conservative | ||
| New ward boundaries (32 seats) | ||||||||
| 2019 | 19 | 12 | 0 | 0 | 1 | Conservative | ||
| 2023 | 14 | 17 | 0 | 0 | 1 | Labour | ||


| Party | Candidate | Votes | % | ±% | |
|---|---|---|---|---|---|
| Labour | 755 | 50.3 | −16.0 | ||
| Conservative | 665 | 44.3 | +10.6 | ||
| Liberal Democrats | 81 | 5.4 | +5.4 | ||
| Majority | 90 | 6.0 | |||
| Turnout | 1,501 | 30.2 | |||
| Labour hold | Swing | ||||
| Party | Candidate | Votes | % | ±% | |
|---|---|---|---|---|---|
| Conservative | 558 | 69.2 | +7.4 | ||
| Labour | 248 | 30.8 | −7.4 | ||
| Majority | 310 | 38.4 | |||
| Turnout | 806 | 34.1 | |||
| Conservative hold | Swing | ||||
| Party | Candidate | Votes | % | ±% | |
|---|---|---|---|---|---|
| Conservative | 619 | 71.2 | +1.6 | ||
| Labour | 158 | 18.2 | −13.0 | ||
| Liberal Democrats | 92 | 10.6 | +1.6 | ||
| Majority | 461 | 53.0 | |||
| Turnout | 869 | 35.2 | |||
| Conservative hold | Swing | ||||
| Party | Candidate | Votes | % | ±% | |
|---|---|---|---|---|---|
| Conservative | 245 | 59.5 | −7.1 | ||
| Labour | 99 | 24.0 | −9.4 | ||
| Liberal Democrats | 68 | 16.5 | +16.5 | ||
| Majority | 146 | 35.5 | |||
| Turnout | 412 | 35.2 | |||
| Conservative hold | Swing | ||||
| Party | Candidate | Votes | % | ±% | |
|---|---|---|---|---|---|
| Conservative | Margaret Philpott | 749 | 60.5 | −0.3 | |
| Liberal Democrats | Patrick Acarnley | 234 | 18.9 | +18.9 | |
| Labour | John Adams | 214 | 17.2 | −4.9 | |
| Independent | Stewart Dimmock | 43 | 3.5 | +0.0 | |
| Majority | 515 | 41.6 | |||
| Turnout | 1,239 | 34.5 | |||
| Conservative hold | Swing | ||||
| Party | Candidate | Votes | % | ±% | |
|---|---|---|---|---|---|
| Conservative | Christopher Smith | 1,031 | 61.0 | +0.2 | |
| Labour | Ernest Brimmell | 449 | 26.5 | −12.7 | |
| Liberal Democrats | John Featherstone | 211 | 12.5 | +12.5 | |
| Majority | 582 | 34.5 | |||
| Turnout | 1,691 | 29.2 | |||
| Conservative hold | Swing | ||||
| Party | Candidate | Votes | % | ±% | |
|---|---|---|---|---|---|
| Conservative | Susan Chandler | 892 | |||
| Conservative | Jane Sheridan | 748 | |||
| Liberal Democrats | Bryan Curtis | 336 | |||
| Liberal Democrats | Sheila Smith | 254 | |||
| Labour | Benet Bano | 111 | |||
| Labour | Ernest Brimmel | 110 | |||
| Turnout | 2,451 | 24.3 | |||
| Conservative hold | Swing | ||||
| Conservative gain from Liberal Democrats | Swing | ||||
| Party | Candidate | Votes | % | ±% | |
|---|---|---|---|---|---|
| Labour | Robert Thompson | 661 | 79.7 | +11.4 | |
| Conservative | Marianne Ford | 108 | 13.0 | −12.6 | |
| Independent | Reginald Hansell | 59 | 7.1 | +0.9 | |
| Independent | Edward Lee-Delisle | 1 | 0.1 | +0.1 | |
| Majority | 553 | 66.7 | |||
| Turnout | 829 | 23.7 | |||
| Labour hold | Swing | ||||
| Party | Candidate | Votes | % | ±% | |
|---|---|---|---|---|---|
| Labour | Viviane Revell | 365 | 33.7 | −3.3 | |
| Liberal Democrats | John Mackie | 274 | 25.3 | +6.1 | |
| Conservative | Jennifer Morgan | 252 | 23.3 | −8.2 | |
| Independent | Graham Wanstall | 70 | 6.5 | −5.8 | |
| UKIP | Peter Campbell-Marshall | 65 | 6.0 | +6.0 | |
| Independent | Victor Morgan | 56 | 5.2 | +5.2 | |
| Majority | 91 | 8.4 | |||
| Turnout | 1,082 | 20.2 | |||
| Labour hold | Swing | ||||
| Party | Candidate | Votes | % | ±% | |
|---|---|---|---|---|---|
| Conservative | Mike Conolly | 1,109 | 66.0 | −1.9 | |
| Liberal Democrats | Bryan Curtis | 459 | 27.3 | +5.4 | |
| Labour | John Bird | 113 | 6.7 | −3.5 | |
| Majority | 650 | 38.7 | |||
| Turnout | 1,681 | 31.2 | |||
| Conservative hold | Swing | ||||
| Party | Candidate | Votes | % | ±% | |
|---|---|---|---|---|---|
| Labour | Viv REVELL | 244 | 32.7 | ||
| Conservative | Mandy Marie SEHMBI | 219 | 29.4 | ||
| Liberal Democrats | Dean STILES | 93 | 12.5 | ||
| Dover Alliance | Raymond John WHITE | 86 | 11.5 | ||
| English Democrat | Tony OVENDEN | 72 | 9.7 | ||
| UKIP | Vic MATCHAM | 32 | 4.3 | ||
| Majority | 25 | ||||
| Turnout | 20.86 | ||||
| Labour gain from Independent | Swing | ||||
| Party | Candidate | Votes | % | ±% | |
|---|---|---|---|---|---|
| Conservative | Geoffrey LYMER | 239 | 62.2 | −5.3 | |
| Labour | Peter WALKER | 90 | 23.4 | +0.7 | |
| UKIP | Victor Peter MATCHAM | 55 | 14.3 | +4.7 | |
| Majority | 149 | ||||
| Turnout | 20.3 | ||||
| Conservative hold | Swing | ||||
| Party | Candidate | Votes | % | ±% | |
|---|---|---|---|---|---|
| Labour | Peter Michael WALLACE | 744 | 53.7 | +3.5 | |
| Conservative | Deborah Nicholson BOULARES | 642 | 46.3 | −3.5 | |
| Majority | 102 | ||||
| Turnout | 26.58 | ||||
| Labour hold | Swing | ||||
| Party | Candidate | Votes | % | ±% | |
|---|---|---|---|---|---|
| Labour | Gordon Cowan | 460 | 61.9 | −6.5 | |
| Conservative | Pauline Catterall | 283 | 38.1 | +38.1 | |
| Majority | 177 | 23.8 | |||
| Turnout | 743 | ||||
| Labour hold | Swing | ||||
| Party | Candidate | Votes | % | ±% | |
|---|---|---|---|---|---|
| Labour | Nathaniel Richards | 573 | 43.1 | +2.6 | |
| Conservative | Callum Warriner | 566 | 42.5 | +13.6 | |
| UKIP | Timothy Turner | 192 | 14.4 | −16.2 | |
| Majority | 7 | 0.5 | |||
| Turnout | 1,331 | ||||
| Labour hold | Swing | ||||
| Party | Candidate | Votes | % | ±% | |
|---|---|---|---|---|---|
| Labour | Ann Napier | 647 | 43.6 | +7.5 | |
| Conservative | Roger Walkden | 567 | 38.2 | +8.0 | |
| UKIP | Peter McDermott | 159 | 10.7 | −22.9 | |
| Independent | Graham Wanstall | 110 | 7.4 | +7.4 | |
| Majority | 80 | 5.4 | |||
| Turnout | 1,483 | ||||
| Labour gain from UKIP | Swing | ||||
| Party | Candidate | Votes | % | ±% | |
|---|---|---|---|---|---|
| Conservative | Peter Jull | 750 | 70.5 | +17.7 | |
| Labour | Charles Woodgate | 314 | 29.5 | +7.6 | |
| Majority | 436 | 41.0 | |||
| Turnout | 1,064 | ||||
| Conservative hold | Swing | ||||
| Party | Candidate | Votes | % | ±% | |
|---|---|---|---|---|---|
| Conservative | Martin Bates | 2,523 | 59.1 | +16.5 | |
| Labour | Eileen Rowbotham | 902 | 21.1 | +5.3 | |
| Green | Sarah White-Gleave | 461 | 10.8 | −8.7 | |
| Liberal Democrats | Roben Franklin | 382 | 9.0 | +9.0 | |
| Majority | 1,621 | 38.0 | |||
| Turnout | 4,268 | ||||
| Conservative hold | Swing | ||||
| Party | Candidate | Votes | % | ±% | |
|---|---|---|---|---|---|
| Conservative | David Hawkes | 716 | 40.3 | +10.0 | |
| Labour | Jeffrey Loffman | 608 | 34.2 | −6.4 | |
| Green | Mike Eddy | 292 | 16.4 | −12.7 | |
| Independent | Chris Tough | 103 | 5.8 | +5.8 | |
| Liberal Democrats | Rick Blackwell | 59 | 3.3 | +3.3 | |
| Majority | 108 | 6.1 | |||
| Turnout | 1,778 | ||||
| Conservative gain from Labour | Swing | ||||
| Party | Candidate | Votes | % | ±% | |
|---|---|---|---|---|---|
| Conservative | Dan Friend | 721 | 51.6 | +17.3 | |
| Liberal Democrats | Anne Fox | 676 | 48.4 | +34.0 | |
| Majority | 45 | 3.2 | |||
| Turnout | 1,397 | ||||
| Conservative hold | Swing | ||||