![]() | ||||||||||||||||||||||
| ||||||||||||||||||||||
All 33 seats to City of Lincoln Council 17 seats needed for a majority | ||||||||||||||||||||||
---|---|---|---|---|---|---|---|---|---|---|---|---|---|---|---|---|---|---|---|---|---|---|
Turnout | 31.27% [3] | |||||||||||||||||||||
| ||||||||||||||||||||||
![]() Map showing the results of the 2016 Lincoln City Council elections by ward. Red shows Labour seats and blue shows the Conservatives. Striped wards indicate wards with mixed representation. | ||||||||||||||||||||||
|
The 2016 City of Lincoln Council election took place on 5 May 2016 to elect members of City of Lincoln Council in England. [4] This was held on the same day as other local elections. All 33 seats were up for election, with 3 councillors in each of the 11 wards being elected following a boundary review.
Party | Seats | Gains | Losses | Net gain/loss | Seats % | Votes % | Votes | +/− | |
---|---|---|---|---|---|---|---|---|---|
Labour | 27 | 1 | 0 | ![]() | 81.8 | 50.2 | 26,399 | ||
Conservative | 6 | 0 | 1 | ![]() | 18.2 | 31.2 | 16,386 | ||
UKIP | 0 | 0 | 0 | ![]() | 0.0 | 8.0 | 4,210 | ||
Green | 0 | 0 | 0 | ![]() | 0.0 | 5.1 | 2,700 | ||
Liberal Democrats | 0 | 0 | 0 | ![]() | 0.0 | 5.0 | 2,628 | ||
TUSC | 0 | 0 | 0 | ![]() | 0.0 | 0.5 | 254 |
Party | Candidate | Votes | % | |
---|---|---|---|---|
Labour | Kathleen Brothwell | 877 | 19.3% | |
Labour | Fay Smith | 833 | 18.3% | |
Labour | Peter West | 790 | 17.4% | |
Conservative | Graham Bratby | 381 | 8.4% | |
Conservative | Douglas Collison | 303 | 6.7% | |
Conservative | Caleb Harris | 286 | 6.3% | |
UKIP | Chris Butler | 271 | 6.0% | |
Green | Kenneth Yates | 247 | 5.4% | |
Liberal Democrats | Clare Smalley | 191 | 4.2% | |
Liberal Democrats | Michael Brown | 188 | 4.1% | |
TUSC | Nick Parker | 64 | 1.4% | |
TUSC | Gavyn Graham | 61 | 1.3% | |
TUSC | Jac Green | 54 | 1.2% | |
Turnout | 4,546 | |||
Labour win (new seat) | ||||
Labour win (new seat) |
Party | Candidate | Votes | % | |
---|---|---|---|---|
Conservative | Edmund Strengiel | 703 | 14.5% | |
Labour | Rosanne Kirk | 682 | 14.1% | |
Labour | Paul Gowen | 647 | 13.4% | |
Conservative | David Denman | 644 | 13.3% | |
Labour | Tony Gray | 618 | 12.8% | |
Conservative | Jenine Butroid | 498 | 10.3% | |
UKIP | Elaine Warde | 397 | 8.2% | |
UKIP | Tony Wells | 383 | 7.9% | |
Green | John Radford | 167 | 3.4% | |
Liberal Democrats | Morgan Aran | 107 | 2.2% | |
Turnout | 4,846 | |||
Conservative win (new seat) | ||||
Labour win (new seat) | ||||
Labour win (new seat) |
Party | Candidate | Votes | % | |
---|---|---|---|---|
Labour | Ralph Toofany | 778 | 20.5% | |
Labour | Gill Clayton-Hewson | 764 | 20.1% | |
Labour | Gary Hewson | 760 | 20.0% | |
Conservative | Alan Briggs | 393 | 10.3% | |
Conservative | Caroline Wilson | 312 | 8.2% | |
Conservative | Roger Hansard | 297 | 7.8% | |
UKIP | Hannah Smith | 243 | 6.4% | |
Liberal Democrats | Heather Cullen | 146 | 3.8% | |
Liberal Democrats | Ryan Cullen | 107 | 2.8% | |
Turnout | 3,800 | |||
Labour win (new seat) | ||||
Labour win (new seat) |
Party | Candidate | Votes | % | |
---|---|---|---|---|
Labour | Karen Lee | 1,176 | 22.5% | |
Labour | Neil Murray | 1,076 | 20.6% | |
Labour | Tony Speakman | 1,029 | 19.7% | |
Conservative | Matthew Fido | 414 | 7.9% | |
Conservative | David Smith | 341 | 6.5% | |
Conservative | Katya Roures Salvador | 311 | 6.0% | |
Green | Nicola Watson | 293 | 5.6% | |
Green | Benjamin Loryman | 223 | 4.3% | |
Green | Christopher Padley | 180 | 3.4% | |
Liberal Democrats | Charles Shaw | 176 | 3.4% | |
Turnout | 5,219 | |||
Labour win (new seat) | ||||
Labour win (new seat) |
Party | Candidate | Votes | % | |
---|---|---|---|---|
Labour | Jim Hanrahan | 867 | 21.0% | |
Labour | Donald Nannestad | 867 | 21.0% | |
Labour | Loraine Woolley | 853 | 20.7% | |
Conservative | Rod Archer | 378 | 9.2% | |
Conservative | David Wright | 370 | 9.0% | |
Conservative | Malcolm Barham | 318 | 7.7% | |
UKIP | David Warde | 297 | 7.2% | |
Liberal Democrats | Daphne Shaw | 179 | 4.3% | |
Turnout | 4,129 | |||
Labour win (new seat) | ||||
Labour win (new seat) |
Party | Candidate | Votes | % | |
---|---|---|---|---|
Labour | Ric Metcalfe | 841 | 18.2% | |
Labour | Jackie Kirk | 778 | 16.9% | |
Labour | Pat Vaughan | 740 | 16.0% | |
Conservative | Andrew Bradley | 528 | 11.4% | |
Conservative | Jamie Bartch | 510 | 11.1% | |
Conservative | Peter McNeil | 484 | 10.5% | |
Green | Fiona McKenna | 207 | 4.5% | |
Green | Norman Haigh | 194 | 4.2% | |
Green | Adam Holman | 155 | 3.4% | |
Liberal Democrats | Stephen Lonsdale | 101 | 2.2% | |
TUSC | Keri Lowe | 75 | 1.6% | |
Turnout | 4,613 | |||
Labour win (new seat) | ||||
Labour win (new seat) |
Party | Candidate | Votes | % | |
---|---|---|---|---|
Conservative | Ronald Hills | 887 | 14.5% | |
Labour | Biff Bean | 860 | 14.0% | |
Conservative | Andrew Kerry | 707 | 11.5% | |
Conservative | Marika Riddick | 702 | 11.5% | |
Labour | Adelle Ellis | 687 | 11.2% | |
Labour | Liz Massey | 663 | 10.8% | |
UKIP | Nick Smith | 403 | 6.6% | |
UKIP | Jeff McGeachie | 396 | 6.5% | |
UKIP | Nicola Smith | 389 | 6.3% | |
Green | Angela Porter | 132 | 2.2% | |
Liberal Democrats | Mervyn Hobden | 109 | 1.8% | |
Liberal Democrats | Tony Gaskell | 106 | 1.7% | |
Green | Peaceful Warrior | 90 | 1.5% | |
Turnout | 6,131 | |||
Conservative win (new seat) | ||||
Labour win (new seat) | ||||
Conservative win (new seat) |
Party | Candidate | Votes | % | |
---|---|---|---|---|
Conservative | Yvonne Bodger | 843 | 16.4% | |
Labour | Naomi Tweddle | 824 | 16.1% | |
Labour | Liz Maxwell | 820 | 16.0% | |
Labour | Dave Callow | 783 | 15.3% | |
Conservative | Tony Higgs | 757 | 14.8% | |
Conservative | Christopher Reid | 705 | 13.8% | |
Liberal Democrats | James Easter | 204 | 4.0% | |
Liberal Democrats | Nicole Pouncey | 191 | 3.7% | |
Turnout | 5,127 | |||
Conservative win (new seat) | ||||
Labour win (new seat) | ||||
Labour win (new seat) |
Party | Candidate | Votes | % | |
---|---|---|---|---|
Labour | Geoff Ellis | 905 | 20% | |
Labour | Bob Bushell | 857 | 18.9% | |
Labour | Adrianna McNulty | 759 | 16.8% | |
Conservative | David Kerry | 557 | 12.3% | |
Conservative | Sharon Longthorne | 494 | 10.9% | |
Conservative | Vasos Melides | 366 | 8.1% | |
UKIP | Kevin Harrington | 340 | 7.5% | |
Liberal Democrats | Lynn Pepper | 136 | 3.0% | |
Liberal Democrats | Ross Pepper | 111 | 2.5% | |
Turnout | 4,525 | |||
Labour win (new seat) | ||||
Labour win (new seat) |
Party | Candidate | Votes | % | |
---|---|---|---|---|
Labour | Chris Burke | 799 | 19.3% | |
Labour | Sue Burke | 735 | 17.8% | |
Labour | Helena Mair | 677 | 16.4% | |
UKIP | Roly Bunce | 280 | 6.8% | |
Conservative | Liam Sperrin | 245 | 5.9% | |
Conservative | Richard Butroid | 221 | 5.3% | |
Green | Sally Horscroft | 213 | 5.1% | |
Green | Allegra Wild | 211 | 5.1% | |
Conservative | Janusz Kala | 210 | 5.1% | |
Green | Lauren Finka | 189 | 4.6% | |
Liberal Democrats | Natasha Chapman | 159 | 3.8% | |
Liberal Democrats | Sean Oxspring | 108 | 2.6% | |
Liberal Democrats | Aarron Smith | 92 | 2.2% | |
Turnout | 4,139 | |||
Labour win (new seat) | ||||
Labour win (new seat) |
Party | Candidate | Votes | % | |
---|---|---|---|---|
Conservative | Keith Weaver | 790 | 14.4% | |
Conservative | Thomas Dyer | 756 | 13.7% | |
Labour | Jane Loffhagen | 724 | 13.2% | |
Labour | Bill Bilton | 710 | 12.9% | |
Conservative | Matthew Wilson | 675 | 12.3% | |
Labour | Funmi Adeyemi | 620 | 11.3% | |
UKIP | Tim Richens | 442 | 8.0% | |
UKIP | Barry Stonham | 369 | 6.7% | |
Liberal Democrats | Andrew Byrne | 217 | 3.9% | |
Green | Elizabeth Bathory-Porther | 199 | 3.6% | |
Turnout | 5,502 | |||
Conservative win (new seat) | ||||
Labour win (new seat) |
Party | Candidate | Votes | % | ±% | |
---|---|---|---|---|---|
Labour | Lucinda Preston | 922 | 63.4% | ![]() | |
Conservative | Kateryna R Salvador | 368 | 25.3% | ![]() | |
Green | Benjamin Loryman | 83 | 5.7% | ![]() | |
Liberal Democrats | James R. Brown | 82 | 5.6 | ![]() | |
Majority | 554 | 38.1 | |||
Turnout | 1,455 | ||||
Labour hold | Swing | ||||
Lancaster City Council elections are held every four years. Lancaster City Council is the local authority for the non-metropolitan district of Lancaster in Lancashire, England. Since the last boundary changes in 2015, 60 councillors have been elected from 27 wards.
Torbay Council is the local authority for the unitary authority of Torbay in Devon, England. Until 1 April 1998 it was a non-metropolitan district. From 2005 to 2019 it had a directly elected mayor. The council is elected every four years.
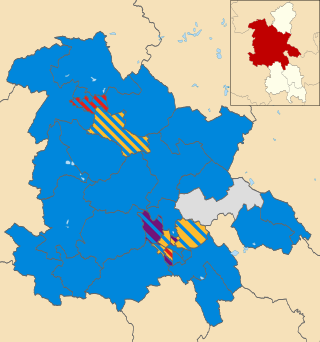
Aylesbury Vale District Council was the council for the non-metropolitan district of Aylesbury Vale in Buckinghamshire, England, which existed as a local government area from 1974 to 2020. The council was elected every four years from 1973 until 2020. At the time of its abolition, the council had 59 councillors, elected from 33 wards.
Bath and North East Somerset Council is the local council for the district of Bath and North East Somerset in Somerset, England.
One third of the City of Lincoln Council in Lincolnshire, England is elected each year, followed by one year when there is an election to Lincolnshire County Council instead. The council is divided up into 11 wards, electing 33 councillors, since the last boundary changes in 2007.
The 1998 City of Lincoln Council election took place on 7 May 1998 to elect members of Lincoln District Council in Lincolnshire, England. One third of the council was up for election and the Labour party stayed in overall control of the Council.
Cardiff Council elections take place for the whole council every five years, to Cardiff Council in south Wales. It came into being as a unitary authority on 1 April 1996, after the passing of the Local Government (Wales) Act 1994. In 2014 the National Assembly for Wales deferred all local elections in Wales to 2017. The council is composed of 75 councillors.
The mayor of Liverpool was the executive mayor of the city of Liverpool in England. The office was abolished in 2023 and its functions were replaced with the leader of Liverpool City Council.
The 2012 City of Lincoln Council election took place on 3 May 2012 to elect one-third of the members of City of Lincoln Council in Lincolnshire, England, for a 4-year term of office. This was on the same day as other 2012 United Kingdom local elections.
Wirral Council is the local authority of the Metropolitan Borough of Wirral in Merseyside, England. Wirral is a metropolitan borough, one of five in Merseyside, and provides the majority of local government services in Wirral. The council is a constituent member of the Liverpool City Region Combined Authority.
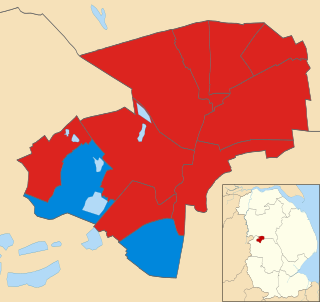
The 2014 City of Lincoln Council election took place on 22 May 2014 to elect members of City of Lincoln Council in England. This was on the same day as other local elections. The Labour Party increased its majority on the council by gaining three seats, leaving them with 27 seats to the Conservatives 6.
The 2017 United Kingdom local elections were held on Thursday 4 May 2017. Local elections were held across Great Britain, with elections to 35 English local authorities and all councils in Scotland and Wales.
Chorlton is an electoral ward of Manchester, England. Different parts of this ward are represented by different MPs following boundary changes in 2018; the majority of the ward is part of the Manchester Withington constituency but a portion is part of the Manchester Gorton constituency. The 2011 Census recorded a population of 14,138.
Didsbury West is a suburb and electoral ward of Manchester, England. It is represented in Westminster by Jeff Smith MP for Manchester Withington. The 2011 Census recorded a population of 12,455.
The 2017 Cardiff Council election was held on 4 May 2017 as part of the national 2017 Welsh local elections. The elections were preceded by the 2012 elections and were followed by the 2022 elections.
The 2018 City of Lincoln Council election took place on 3 May 2018 to elect members of City of Lincoln Council in England. This was held on the same day as other local elections. One third 33 seats were up for election, with one councillors in each of the 11 wards being elected. As the previous election in 2016 had been an all-out election with new ward boundaries, the seats of the candidates that had finished third in each ward in 2016 were up for election.
The 2019 City of Lincoln Council election took place on 3 May 2019 to elect members of City of Lincoln Council in Lincolnshire, England. This was held on the same day as other local elections. One third 33 seats were up for election, with one councillors in each of the 11 wards being elected. As the election in 2016 had been an all-out election with new ward boundaries, the seats of the candidates that had finished second in each ward in the all-out 2016 election were now up for election.
The 2021 City of Lincoln Council election took place on 6 May 2021 to elect members of City of Lincoln Council in Lincolnshire, England. This was held on the same day as other local elections. One third 33 seats were up for election, with one councillors in each of the 11 wards being elected. As the election in 2016 had been an all-out election with new ward boundaries, the seats of the candidates that had finished first in each ward in the all-out 2016 election were now up for election.
The 2022 Cardiff Council election took place on 5 May 2022 to elect 79 members to Cardiff Council. On the same day, elections were held to the other 21 local authorities and to community councils in Wales as part of the 2022 Welsh local elections.
The 2023 Liverpool City Council election took place on 4 May 2023 to elect members of Liverpool City Council. Following a Boundary Review by The Local Government Boundary Commission for England, the size of the council was reduced from 90 to 85 seats with a change from three-member seats, elected in thirds, three years out of every four, following the British Government instigated Best Value Inspection Report which led to the appointment by the government of Commissioners and the subsequent boundary review for Council Wards in Liverpool which the government initiated with the proviso that the number of councillors be reduced and the predominant number of wards be reduced to single members with all-up elections every four years. The election also marked the end of Liverpool's directly-elected mayoralty. After the election the council reverted to having a leader of the council chosen from amongst the councillors instead. Labour retained control of the council and their group leader Liam Robinson became leader of the council after the election.