District result maps
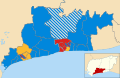 2003 results map
 2007 results map
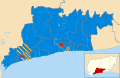 2011 results map
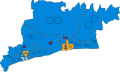 2015 results map
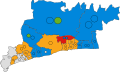 2019 results map
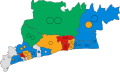 2023 results map
Arun District Council in West Sussex, England is elected every four years. Since the last boundary changes in 2015, 54 councillors have been elected from 23 wards.
| Year | Conservative | Liberal Democrats [a] | Labour | Green | UKIP | Independents & Others | Council control after election | |
|---|---|---|---|---|---|---|---|---|
| Local government reorganisation; council established (60 seats) | ||||||||
| 1973 | 39 | 4 | 4 | – | – | 13 | Conservative | |
| 1976 | 50 | 5 | 1 | 0 | – | 4 | Conservative | |
| 1979 | 50 | 9 | 1 | 0 | – | 0 | Conservative | |
| New ward boundaries (56 seats) | ||||||||
| 1983 | 51 | 4 | 1 | 0 | – | 0 | Conservative | |
| 1987 | 51 | 4 | 1 | 0 | – | 0 | Conservative | |
| 1991 | 36 | 11 | 7 | 0 | – | 2 | Conservative | |
| 1995 | 29 | 14 | 10 | 0 | 0 | 3 | Conservative | |
| 1999 | 36 | 10 | 8 | 0 | 0 | 2 | Conservative | |
| New ward boundaries (56 seats) | ||||||||
| 2003 | 36 | 11 | 8 | 0 | 0 | 1 | Conservative | |
| 2007 | 42 | 9 | 3 | 0 | 0 | 2 | Conservative | |
| 2011 | 48 | 4 | 3 | 0 | 0 | 2 | Conservative | |
| New ward boundaries (54 seats) | ||||||||
| 2015 | 42 | 5 | 1 | 0 | 4 | 2 | Conservative | |
| 2019 | 21 | 22 | 1 | 2 | 0 | 8 | No overall control | |
| 2023 | 20 | 14 | 8 | 6 | 0 | 6 | No overall control | |


| By-election | Date | Incumbent party | Result | ||
|---|---|---|---|---|---|
| Rustington South | 26 March 1998 | Conservative | Conservative | ||
| Felpham | 3 December 1998 | Independent | Conservative | ||
| Rustington South | 15 July 1999 | Conservative | Conservative | ||
| Hotham | 27 July 2000 | Conservative | Conservative | ||
| Yapton | 5 May 2005 | Conservative | Liberal Democrats | ||
| Felpham East | 22 September 2005 | Conservative | Conservative | ||
| Angmering | 10 November 2005 | Conservative | Conservative | ||
| Rustington West | 20 April 2006 | Conservative | Conservative | ||
| Angmering | 1 June 2006 | Conservative | Conservative | ||
| Yapton | 1 June 2006 | Liberal Democrats | Conservative | ||
| Yapton | 20 March 2008 | Conservative | Conservative | ||
| Felpham West | 2 April 2009 | Conservative | Conservative | ||
| Aldwick East | 14 March 2013 | Conservative | Liberal Democrats | ||
| Angmering | 18 April 2013 | Conservative | Conservative | ||
| Aldwick West | 2 November 2017 | Conservative | Liberal Democrats | ||
| Marine | 22 February 2018 | Conservative | Liberal Democrats | ||
| Brookfield | 6 May 2021 | Liberal Democrats | Conservative | ||
| Pevensey | 6 May 2021 | Liberal Democrats | Conservative | ||
| Barnham | 8 September 2022 | Conservative | Green | ||
| Arundel and Walberton | 1 December 2022 | Green | Green | ||
| Party | Candidate | Votes | % | ±% | |
|---|---|---|---|---|---|
| Conservative | 594 | 60.4 | |||
| Liberal Democrats | 374 | 38.6 | |||
| Majority | 220 | 22.8 | |||
| Turnout | 968 | 31.0 | |||
| Conservative hold | Swing | ||||
| Party | Candidate | Votes | % | ±% | |
|---|---|---|---|---|---|
| Conservative | 393 | 40.1 | +9.6 | ||
| Independent | 294 | 30.0 | +8.8 | ||
| Liberal Democrats | 167 | 17.0 | +9.4 | ||
| Independent | 102 | 10.4 | +10.4 | ||
| Labour | 24 | 2.5 | −6.4 | ||
| Majority | 99 | 10.1 | |||
| Turnout | 980 | 27.4 | |||
| Conservative gain from Independent | Swing | ||||
| Party | Candidate | Votes | % | ±% | |
|---|---|---|---|---|---|
| Conservative | Florence Harrison | 604 | 64.1 | ||
| Liberal Democrats | Richard James | 208 | 22.1 | ||
| Labour | Moira Rice | 130 | 13.8 | ||
| Majority | 396 | 42.0 | |||
| Turnout | 942 | 30.0 | |||
| Conservative hold | Swing | ||||
| Party | Candidate | Votes | % | ±% | |
|---|---|---|---|---|---|
| Conservative | Andrew Evans | 429 | 38.7 | −2.7 | |
| Labour | Pauline Nash | 388 | 35.0 | +5.6 | |
| Liberal Democrats | Sylvia Olliver | 292 | 26.3 | −3.0 | |
| Majority | 41 | 3.7 | |||
| Turnout | 1,109 | 24.4 | |||
| Conservative hold | Swing | ||||
| Party | Candidate | Votes | % | ±% | |
|---|---|---|---|---|---|
| Liberal Democrats | Ian Menzies | 1,213 | 50.7 | +24.3 | |
| Conservative | Richard Taft | 1,179 | 49.3 | −24.3 | |
| Majority | 34 | 1.4 | |||
| Turnout | 2,392 | 60.5 | |||
| Liberal Democrats gain from Conservative | Swing | ||||
| Party | Candidate | Votes | % | ±% | |
|---|---|---|---|---|---|
| Conservative | Paul English | 492 | 58.2 | +9.3 | |
| Liberal Democrats | Michael Harvey | 267 | 31.6 | +31.6 | |
| Labour | Simon Holland | 86 | 10.2 | −1.6 | |
| Majority | 225 | 26.6 | |||
| Turnout | 845 | 22.6 | |||
| Conservative hold | Swing | ||||
| Party | Candidate | Votes | % | ±% | |
|---|---|---|---|---|---|
| Conservative | Paul Bicknell | 846 | 66.8 | +3.4 | |
| Liberal Democrats | Trevor Richards | 421 | 33.2 | −3.4 | |
| Majority | 425 | 33.6 | |||
| Turnout | 1,267 | 22.8 | |||
| Conservative hold | Swing | ||||
| Party | Candidate | Votes | % | ±% | |
|---|---|---|---|---|---|
| Conservative | Florence Harrison | 769 | 44.1 | +1.8 | |
| Liberal Democrats | Andrew Lauretani | 581 | 33.4 | +3.0 | |
| UKIP | 277 | 15.9 | −2.1 | ||
| Labour | 115 | 6.6 | −2.7 | ||
| Majority | 188 | 10.7 | |||
| Turnout | 1,742 | 26.8 | |||
| Conservative hold | Swing | ||||
| Party | Candidate | Votes | % | ±% | |
|---|---|---|---|---|---|
| Conservative | Dudley Wensley | 1,052 | 73.6 | +6.8 | |
| Liberal Democrats | Trevor Richards | 254 | 17.8 | −15.4 | |
| Labour | 123 | 8.6 | +8.6 | ||
| Majority | 798 | 55.8 | +22.2 | ||
| Turnout | 1,429 | 24.7 | +1.9 | ||
| Conservative hold | Swing | ||||
| Party | Candidate | Votes | % | ±% | |
|---|---|---|---|---|---|
| Conservative | Michael Taft | 699 | 70.5 | +21.2 | |
| Liberal Democrats | Roslyn Kissell | 205 | 20.7 | −30.0 | |
| Labour | 87 | 8.8 | +8.8 | ||
| Majority | 494 | 49.8 | |||
| Turnout | 991 | 24.0 | −36.5 | ||
| Conservative gain from Liberal Democrats | Swing | ||||
| Party | Candidate | Votes | % | ±% | |
|---|---|---|---|---|---|
| Conservative | Emma Neno | 620 | 59.8 | −4.8 | |
| Liberal Democrats | David Jones | 212 | 20.4 | −2.4 | |
| BNP | Albert Bodle | 205 | 19.8 | +19.8 | |
| Majority | 408 | 39.4 | |||
| Turnout | 1,037 | 25.4 | |||
| Conservative hold | Swing | -1.2 | |||
| Party | Candidate | Votes | % | ±% | |
|---|---|---|---|---|---|
| Conservative | Gillian Madeley | 630 | 52.1 | −3.1 | |
| Liberal Democrats | Martin Lury | 269 | 22.2 | +10.3 | |
| BNP | Michael Witchell | 165 | 13.6 | +13.6 | |
| UKIP | Joan Phillips | 89 | 7.4 | −4.6 | |
| Labour | Michelle White | 56 | 4.6 | +4.6 | |
| Majority | 361 | 29.9 | N/A | ||
| Turnout | 1,209 | 30.2 | −8.5 | ||
| Conservative hold | Swing | ||||
| Party | Candidate | Votes | % | ±% | |
|---|---|---|---|---|---|
| Liberal Democrats | Paul Wells | 383 | 33.6 | +17.9 | |
| Conservative | Bill Smee | 357 | 31.3 | −32.6 | |
| UKIP | Janet Taylor | 339 | 29.7 | +22.6 | |
| Labour | Richard Dawson | 61 | 5.3 | −1.3 | |
| Majority | 26 | 2.3 | |||
| Turnout | 1,141 | 26.8 | −26.2 | ||
| Liberal Democrats gain from Conservative | Swing | 25.3 | |||
| Party | Candidate | Votes | % | ±% | |
|---|---|---|---|---|---|
| Conservative | Andy Cooper | 878 | 63.9 | +22.3 | |
| Labour | Carly Godwin | 268 | 19.5 | +1.5 | |
| Liberal Democrats | Jamie Bennett | 228 | 16.6 | +4.8 | |
| Majority | 610 | 34.4 | |||
| Turnout | 1,141 | 23.4 | −21.4 | ||
| Conservative hold | Swing | 10.4 | |||
| Party | Candidate | Votes | % | ±% | |
|---|---|---|---|---|---|
| Liberal Democrats | Martin Smith | 719 | 52.7 | +17.9 | |
| Conservative | Guy Purser | 480 | 36.2 | −32.6 | |
| Labour | Ian Manion | 112 | 8.2 | New | |
| Green | Carol Birch | 54 | 4.0 | New | |
| Majority | 239 | 17.5 | |||
| Turnout | 1,369 | 26.3 | −26.2 | ||
| Liberal Democrats gain from Conservative | Swing | 25.5 | |||
| Party | Candidate | Votes | % | ±% | |
|---|---|---|---|---|---|
| Liberal Democrats | Matt Stanley | 309 | 32.7 | New | |
| Labour | Alison Sharples | 252 | 26.7 | +7.3 | |
| Conservative | Katherine Eccles | 242 | 25.6 | −0.7 | |
| Independent | Steve Goodheart | 141 | 14.9 | New | |
| Majority | 57 | 6.0 | |||
| Turnout | 950 | 20.1 | −30.7 | ||
| Liberal Democrats gain from Conservative | Swing | 16.7 | |||
| Party | Candidate | Votes | % | ±% | |
|---|---|---|---|---|---|
| Conservative | David Chace | 680 | 48.5 | +17.7 | |
| Liberal Democrats | Roberta Woodman | 526 | 37.5 | −21.0 | |
| Labour | Freddie Tandy | 152 | 10.8 | +0.1 | |
| Workers Party | Jonathan Maxted | 45 | 3.2 | +3.2 | |
| Majority | 154 | 11.0 | |||
| Turnout | 1,411 | 29.6 | +1.1 | ||
| Conservative gain from Liberal Democrats | Swing | 19.4 | |||
| Party | Candidate | Votes | % | ±% | |
|---|---|---|---|---|---|
| Conservative | Joan English | 357 | 38.3 | +16.4 | |
| Liberal Democrats | John Barrett | 210 | 22.5 | −6.9 | |
| Labour | Simon McDougall | 140 | 15.0 | −0.6 | |
| Independent | Jan Cosgrove | 132 | 14.2 | New | |
| Green | Carol Birch | 93 | 10.0 | New | |
| Majority | 147 | 15.8 | |||
| Turnout | 947 | 22.4 | −3.3 | ||
| Conservative gain from Liberal Democrats | Swing | 11.7 | |||
| Party | Candidate | Votes | % | ±% | |
|---|---|---|---|---|---|
| Green | Sue Wallsgrove | 786 | 50.9 | +6.8 | |
| Conservative | Graham Jones | 641 | 41.5 | −8.6 | |
| Labour | Alan Butcher | 116 | 7.5 | −14.0 | |
| Majority | 145 | 9.4 | |||
| Turnout | 1,547 | 21.3 | −7.6 | ||
| Green gain from Conservative | Swing | ||||
| Party | Candidate | Votes | % | ±% | |
|---|---|---|---|---|---|
| Green | Stephen McAuliffe | 873 | 47.7 | +21.9 | |
| Conservative | Mario Trabucco | 549 | 30.0 | −1.8 | |
| Labour | Michael Ward | 407 | 22.3 | +9.9 | |
| Majority | 324 | 17.7 | |||
| Turnout | 1,829 | ||||
| Green hold | Swing | ||||
| Party | Candidate | Votes | % | ±% | |
|---|---|---|---|---|---|
| Reform UK | Giuliano Pinnelli | 306 | 26.0 | ||
| Liberal Democrats | Paul Wells | 296 | 25.2 | ||
| Labour | Alison Terry | 236 | 20.1 | ||
| Conservative | Diana Thas | 192 | 16.3 | ||
| Green | John Erskine | 115 | 9.8 | ||
| Independent | Phil Woodall | 31 | 2.6 | ||
| Majority | 10 | 0.9 | |||
| Turnout | 1,176 | ||||
| Reform UK gain from Independent | Swing | ||||
| West Sussex CC | |
|---|---|
| Adur | |
| Arun | |
| Chichester | |
| Crawley | |
| Horsham | |
| Mid Sussex | |
| Worthing | |
| |