District result maps
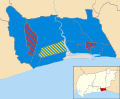 2004 results map
 2006 results map
 2008 results map
 2010 results map
 2012 results map
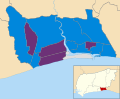 2014 results map
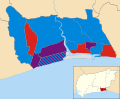 2016 results map
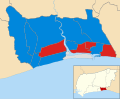 2018 results map
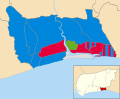 2021 results map
 2022 results map
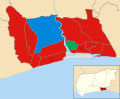 2024 results map
Half of Adur District Council in West Sussex, England is elected every two years. Until 2003, the council was elected by thirds. Since the last boundary changes in 2004, 29 councillors have been elected from 14 wards. [1]
| Year | Conservative | Labour | Liberal Democrats [a] | Green [b] | UKIP | Independents & Others | Council control after election | |
|---|---|---|---|---|---|---|---|---|
| Local government reorganisation; council established (37 seats) | ||||||||
| 1973 | 13 | 6 | 16 | – | – | 2 | No overall control | |
| 1976 | 16 | 2 | 17 | 0 | – | 2 | No overall control | |
| New ward boundaries (39 seats) | ||||||||
| 1979 | 20 | 0 | 17 | 0 | – | 2 | Conservative | |
| 1980 | 16 | 1 | 20 | 0 | – | 2 | Liberal | |
| 1982 | 15 | 1 | 21 | 0 | – | 2 | Alliance | |
| 1983 | 17 | 1 | 19 | 0 | – | 2 | No overall control | |
| 1984 | 19 | 0 | 18 | 0 | – | 2 | No overall control | |
| 1986 | 15 | 0 | 22 | 0 | – | 2 | Alliance | |
| 1987 | 15 | 0 | 22 | 0 | – | 2 | Alliance | |
| 1988 | 15 | 0 | 22 | 0 | – | 2 | SLD | |
| 1990 | 14 | 1 | 22 | 0 | – | 2 | Liberal Democrats | |
| 1991 | 14 | 1 | 22 | 0 | – | 2 | Liberal Democrats | |
| 1992 | 14 | 1 | 22 | 0 | – | 2 | Liberal Democrats | |
| 1994 | 11 | 1 | 25 | 0 | 0 | 2 | Liberal Democrats | |
| 1995 | 5 | 3 | 29 | 0 | 0 | 2 | Liberal Democrats | |
| 1996 | 2 | 6 | 29 | 0 | 0 | 2 | Liberal Democrats | |
| 1998 | 5 | 10 | 22 | 0 | 0 | 2 | Liberal Democrats | |
| 1999 | 8 | 15 | 13 | 0 | 0 | 3 [c] | No overall control | |
| 2000 | 15 | 13 | 9 | 0 | 0 | 2 | No overall control | |
| 2002 | 23 | 11 | 1 | 0 | – | 4 | Conservative | |
| 2003 | 27 | 8 | 0 | 0 | 0 | 4 | Conservative | |
| New ward boundaries (39 seats) [d] | ||||||||
| 2004 | 24 | 2 | 1 | 0 | 0 | 2 | Conservative | |
| 2006 | 26 | 0 | 1 | 0 | 0 | 2 | Conservative | |
| 2008 | 26 | 0 | 1 | 0 | 0 | 2 | Conservative | |
| 2010 | 25 | 0 | 2 | 0 | 0 | 2 | Conservative | |
| 2012 | 25 | 1 | 1 | 0 | 0 | 2 | Conservative | |
| 2014 | 20 | 1 | 0 | 0 | 5 | 3 | Conservative | |
| 2016 | 16 | 3 | 0 | 0 | 8 | 2 | Conservative | |
| 2018 | 16 | 7 | 0 | 0 | 3 | 2 | Conservative | |
| 2021 | 19 | 7 | 0 | 1 | 0 | 2 | Conservative | |
| 2022 | 16 | 9 | 0 | 2 | 0 | 2 | Conservative | |
| 2024 | 8 | 17 | 0 | 2 | 0 | 2 | Labour | |


| Party | Candidate | Votes | % | ±% | |
|---|---|---|---|---|---|
| Liberal Democrats | 967 | 37.5 | −2.4 | ||
| Labour | 821 | 31.8 | −14.9 | ||
| Conservative | 790 | 30.6 | +17.2 | ||
| Majority | 146 | 5.7 | |||
| Turnout | 2,578 | ||||
| Liberal Democrats hold | Swing | ||||
| Party | Candidate | Votes | % | ±% | |
|---|---|---|---|---|---|
| Liberal Democrats | 1,066 | 38.3 | −20.5 | ||
| Conservative | 1,062 | 38.2 | +15.5 | ||
| Labour | 652 | 23.5 | +4.9 | ||
| Majority | 4 | 0.1 | |||
| Turnout | 2,780 | ||||
| Liberal Democrats hold | Swing | ||||
| Party | Candidate | Votes | % | ±% | |
|---|---|---|---|---|---|
| Conservative | 1,192 | 39.3 | +7.6 | ||
| Liberal Democrats | 924 | 30.5 | −7.2 | ||
| Labour | 916 | 30.2 | −0.4 | ||
| Majority | 268 | 8.8 | |||
| Turnout | 3,032 | ||||
| Conservative gain from Liberal Democrats | Swing | ||||
| Party | Candidate | Votes | % | ±% | |
|---|---|---|---|---|---|
| Conservative | 425 | 35.6 | −4.5 | ||
| Liberal Democrats | 423 | 35.4 | −10.1 | ||
| Labour | 346 | 29.0 | +14.7 | ||
| Majority | 2 | 0.2 | |||
| Turnout | 1,194 | ||||
| Conservative gain from Liberal Democrats | Swing | ||||
| Party | Candidate | Votes | % | ±% | |
|---|---|---|---|---|---|
| Conservative | 738 | 50.3 | +10.4 | ||
| Labour | 589 | 40.2 | −4.7 | ||
| Liberal Democrats | 139 | 9.5 | −5.7 | ||
| Majority | 149 | 10.1 | |||
| Turnout | 1,466 | 34.6 | |||
| Conservative gain from Labour | Swing | ||||
| Party | Candidate | Votes | % | ±% | |
|---|---|---|---|---|---|
| Conservative | Angela Mills | 886 | 41.9 | +3.1 | |
| Liberal Democrats | Shirely Rance | 802 | 38.0 | −10.9 | |
| Labour | Ronald Horne | 425 | 21.1 | −7.8 | |
| Majority | 84 | 3.9 | |||
| Turnout | 2,113 | 64.0 | |||
| Conservative gain from Liberal Democrats | Swing | ||||
| Party | Candidate | Votes | % | ±% | |
|---|---|---|---|---|---|
| Conservative | Andrew McGregor | 761 | 40.0 | −1.5 | |
| Liberal Democrats | Barrie Marler | 617 | 32.4 | +2.7 | |
| Labour | Jeanette White | 525 | 27.6 | −1.2 | |
| Majority | 144 | 7.6 | |||
| Turnout | 1,903 | 60.7 | |||
| Conservative gain from Liberal Democrats | Swing | ||||
| Party | Candidate | Votes | % | ±% | |
|---|---|---|---|---|---|
| Conservative | Iris Hayward | 895 | 38.9 | −0.6 | |
| Liberal Democrats | Anthony Stuart | 720 | 31.3 | −1.3 | |
| Labour | Teana Ashley | 686 | 29.8 | +2.0 | |
| Majority | 175 | 7.6 | |||
| Turnout | 2,301 | 61.1 | |||
| Conservative gain from Labour | Swing | ||||
| Party | Candidate | Votes | % | ±% | |
|---|---|---|---|---|---|
| Conservative | Sara Hall | 368 | 50.5 | −5.9 | |
| Liberal Democrats | Roy Gibson | 213 | 29.2 | +29.2 | |
| Labour | Ann Bridges | 148 | 20.3 | −12.4 | |
| Majority | 155 | 21.3 | |||
| Turnout | 729 | 18.8 | |||
| Conservative hold | Swing | ||||
| Party | Candidate | Votes | % | ±% | |
|---|---|---|---|---|---|
| Independent | Keith Fayers-Morrisey | 1,190 | 62.3 | ||
| Liberal Democrats | Doris Martin | 404 | 21.2 | ||
| Labour | Daniel Yates | 316 | 16.5 | ||
| Majority | 786 | 41.1 | |||
| Turnout | 1,910 | 64.0 | |||
| Independent hold | Swing | ||||
| Party | Candidate | Votes | % | ±% | |
|---|---|---|---|---|---|
| Conservative | Angus Dunn | 445 | 59.1 | −0.2 | |
| Liberal Democrats | Clive Connor | 184 | 24.4 | +2.7 | |
| Labour | Barry Thompson | 124 | 16.5 | −2.5 | |
| Majority | 261 | 34.7 | |||
| Turnout | 753 | 22.0 | |||
| Conservative hold | Swing | ||||
| Party | Candidate | Votes | % | ±% | |
|---|---|---|---|---|---|
| Conservative | Nicholas Pigott | 288 | 39.6 | −15.6 | |
| Labour | Barry Mear | 282 | 38.8 | +13.6 | |
| UKIP | David Bamber | 91 | 12.5 | +12.5 | |
| Green | Jennie Tindall | 35 | 4.8 | +4.8 | |
| Liberal Democrats | Cyril Cannings | 31 | 4.3 | −15.3 | |
| Majority | 6 | 0.8 | −29.2 | ||
| Turnout | 730 | 21.4 | −9.6 | ||
| Conservative hold | Swing | -14.6 | |||
| Party | Candidate | Votes | % | ±% | |
|---|---|---|---|---|---|
| UKIP | Paul Graysmark | 354 | 39.9 | +24.8 | |
| Labour | Andy Bray | 254 | 28.6 | −8.5 | |
| Conservative | Vicky Parkin | 228 | 25.7 | −12.3 | |
| Liberal Democrats | Cyril Cannings | 51 | 5.7 | −4.1 | |
| Majority | 100 | 11.3 | |||
| Turnout | 887 | ||||
| UKIP gain from Conservative | Swing | ||||
Paul Graysmark was elected in 2012 for the Conservatives; he resigned to seek re-election as a UKIP candidate.
| Party | Candidate | Votes | % | ±% | |
|---|---|---|---|---|---|
| Conservative | Stephen Chipp | 340 | 38.4 | +1.3 | |
| Labour | Irene Reed | 223 | 25.2 | +2.6 | |
| UKIP | Jenny Greig | 216 | 24.4 | +3.3 | |
| Green | Jennie Tindall | 106 | 12.0 | −0.7 | |
| Majority | 117 | 13.2 | |||
| Turnout | 885 | ||||
| Conservative hold | Swing | ||||
| Party | Candidate | Votes | % | ±% | |
|---|---|---|---|---|---|
| Labour | Lee Cowen | 490 | 49.3 | +29.7 | |
| Conservative | Jack Howard | 384 | 38.6 | +16.0 | |
| Liberal Democrats | Doris Martin | 89 | 9.0 | −6.5 | |
| Green | Paul Hendy | 31 | 3.1 | +3.1 | |
| Majority | 106 | 10.7 | |||
| Turnout | 994 | ||||
| Labour gain from UKIP | Swing | ||||
| Party | Candidate | Votes | % | ±% | |
|---|---|---|---|---|---|
| Labour | Debs Stainforth | 448 | 45.9 | +4.1 | |
| Green | Andrew Bradbury | 395 | 40.5 | +34.9 | |
| Conservative | Tony Nicklen | 132 | 13.5 | −27.2 | |
| Majority | 53 | 5.4 | |||
| Turnout | 975 | ||||
| Labour gain from UKIP | Swing | ||||
| Party | Candidate | Votes | % | ±% | |
|---|---|---|---|---|---|
| Conservative | Leila Williams | 414 | 56.2 | ||
| Green | Russell Whiting | 175 | 23.7 | ||
| Labour | Rebecca Allinson | 148 | 20.1 | ||
| Majority | 239 | 32.4 | |||
| Turnout | 737 | ||||
| Conservative hold | Swing | ||||
| Party | Candidate | Votes | % | ±% | |
|---|---|---|---|---|---|
| Labour | Kate Davis | 609 | 43.6 | −7.3 | |
| Reform UK | Mike Mendoza | 311 | 22.3 | +22.3 | |
| Conservative | Leila Williams | 301 | 21.6 | −10.1 | |
| Liberal Democrats | Ian Jones | 153 | 11.0 | −1.3 | |
| Britain First | David Bamber | 22 | 1.6 | +1.6 | |
| Majority | 298 | 21.3 | |||
| Turnout | 1,396 | ||||
| Labour hold | Swing | ||||
| West Sussex CC | |
|---|---|
| Adur | |
| Arun | |
| Chichester | |
| Crawley | |
| Horsham | |
| Mid Sussex | |
| Worthing | |
| |