Croydon South | |
---|---|
Borough constituency for the House of Commons | |
![]() Interactive map of boundaries from 2024 | |
![]() Boundary within Greater London | |
County | Greater London |
Electorate | 71,541 (2023) [1] |
Major settlements | Coulsdon, Purley, South Croydon |
Current constituency | |
Created | 1974 |
Member of Parliament | Chris Philp (Conservative) |
Seats | One |
Created from | East Surrey |
Croydon South is a constituency [n 1] recreated in 1974 and represented in the House of Commons of the UK Parliament since 2015 by Chris Philp, a Conservative. [n 2] Croydon South was originally created in 1918.
It was created for the 1918 general election when the County Borough of Croydon had grown so the Croydon seat was split into two seats. The first MP was Ian Malcolm, who had been the MP for all of Croydon. H.T. Muggeridge, father of Malcolm Muggeridge, fought the seat for Labour four times from 1918, later becoming MP for Romford. The seat saw a by-election in 1932, won by Herbert Williams.
From 1950 until 1955 the seat was divided into east and west, represented by Conservatives Herbert Williams and Richard Thompson respectively.
Croydon South had twice seen Croydon's only Labour MPs before the 1990s. David Rees-Williams held the seat from the 1945 Labour landslide until unfavourable boundary changes in 1950. David Winnick won the seat in 1966 before losing in 1970. Otherwise the seat, and indeed the rest of Croydon, had always been firm Conservative territory.
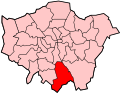
In 1974 a fresh seat of Croydon South was created to the south predominantly from the northwestern part of East Surrey, covering Purley and Coulsdon, which had become parts of Greater London in 1965, rather than from the historic Croydon South.
Since its recreation, the constituency has been represented by three Conservative MPs. Sir William Clark, who had represented East Surrey since 1970, won the new seat in February 1974, and held it until his retirement in 1992. His successor, Sir Richard Ottaway, then held the seat until 2015, when he stood down and was succeeded by Chris Philp. [2] [3] Boundary changes have been minor and the 2015 result made the seat the 145th safest of the Conservative Party's 331 seats by percentage of majority. [4] At the 2015 general election, it was one of the Conservatives' safest seats in Greater London. [5] Philp held the seat at the 2024 general election on a substantially reduced majority of just over 2,000, the lowest majority since the seat was created.
Croydon South consists of affluent suburbia, including a significant minority of large houses with gardens on the North Downs escarpment. It has many well-to-do commuters taking advantage of the fast trains to the City and Gatwick Airport, plus a significant proportion of retired people. Included are the suburbs of Purley and Kenley, home to the Kenley Aerodrome
The village-like Selsdon – one of the few places in the seat where transport links are poor – has a place on the political map having spawned the phrase 'Selsdon Man',[ citation needed ] its swing and voters first seen as an ideal bellwether for the national swing by the Conservative Party. The Purley Way, which runs mainly through Waddon, has become home to large retail estates for out-of-town shopping and leisure. Prior to 2018 Waddon was the sole Labour ward in the constituency – one of its councillors, Andrew Pelling, the former Conservative MP for Croydon Central, defected to the Labour Party.
Boundary changes before the 2024 election removed both Selsdon and Waddon from the seat and added the Park Hill & Whitgift ward, close to Croydon Town centre.
At the southern end of the constituency, Coulsdon has much in common with the residual county of Surrey of which it was a more intrinsically associated part until 1965 as it was excluded from Croydon County Borough on the county borough's creation in 1889.
Pre-1974:
Dates | Local authority | Maps | Wards |
---|---|---|---|
1918-1950 | County Borough of Croydon | ![]() | Central, East, South, and West. |
1955-1974 | ![]() | Addington, Broad Green, Central, Shirley, South, and Waddon. |
In 1965, local government in Greater London was re-organised. This constituency was contained entirely within the new London Borough of Croydon from 1965, but new Constituency Boundaries would not take effect until 1974.
Post-1974:
Dates | Local authority | Maps | Wards |
---|---|---|---|
1974–1983 | London Borough of Croydon | ![]() | Coulsdon East, Purley, Sanderstead and Selsdon, Sanderstead North, Woodcote and Coulsdon West |
1983–1997 | Coulsdon East, Croham, Kenley, Purley, Sanderstead, Selsdon, Woodcote and Coulsdon West | ||
1997–2010 | ![]() | Coulsdon East, Croham, Kenley, Purley, Sanderstead, Selsdon, Waddon, Woodcote and Coulsdon West | |
2010–2024 | ![]() | Coulsdon East, Coulsdon West, Croham, Kenley, Purley, Sanderstead, Selsdon and Ballards, Waddon | |
2024–present | ![]() | Coulsdon Town, Kenley, Old Coulsdon, Park Hill & Whitgift, Purley & Woodcote, Purley Oaks & Riddlesdown, Sanderstead, South Croydon [6] |
Election | Name | Party | Notes | |
---|---|---|---|---|
1918 | Ian Malcolm | Conservative | previously MP for Croydon | |
1919 by-election | Allan Smith | Conservative | ||
1923 | William Mitchell-Thomson | Conservative | ||
1932 by-election | Herbert Williams | Conservative | ||
1945 | David Rees-Williams | Labour | ||
1950 | constituency abolished |
From 1950 to 1955 the seat was divided into Croydon East and Croydon West.
Election | Name | Party | |
---|---|---|---|
1955 | Richard Thompson | Conservative | |
1966 | David Winnick | Labour | |
1970 | Richard Thompson | Conservative | |
Feb 1974 | constituency abolished |
Election | Member | Party | |
---|---|---|---|
February 1974 | Sir William Clark | Conservative | |
1992 | Sir Richard Ottaway | Conservative | |
2015 | Chris Philp | Conservative |
Party | Candidate | Votes | % | ±% | |
---|---|---|---|---|---|
Conservative | Chris Philp | 19,757 | 40.0 | −14.5 | |
Labour | Ben Taylor | 17,444 | 35.3 | +7.2 | |
Liberal Democrats | Richard Howard | 4,384 | 8.9 | −4.6 | |
Reform UK | Bob Bromley | 4,149 | 8.4 | +8.3 | |
Green | Elaine Garrod | 2,859 | 5.8 | +2.9 | |
Workers Party | Kulsum Hussin | 612 | 1.2 | New | |
Independent | Mark Samuel | 173 | 0.4 | New | |
Majority | 2,313 | 4.7 | −21.7 | ||
Turnout | 49,378 | 65.9 | −5.2 | ||
Registered electors | 74,968 | ||||
Conservative hold | Swing | −10.9 |
2019 notional result [8] | |||
---|---|---|---|
Party | Vote | % | |
Conservative | 27,725 | 54.5 | |
Labour | 14,317 | 28.1 | |
Liberal Democrats | 6,885 | 13.5 | |
Green | 1,466 | 2.9 | |
Others | 442 | 0.9 | |
Brexit Party | 59 | 0.1 | |
Turnout | 50,894 | 71.1 | |
Electorate | 71,541 |
Party | Candidate | Votes | % | ±% | |
---|---|---|---|---|---|
Conservative | Chris Philp | 30,985 | 52.2 | −2.2 | |
Labour | Olga FitzRoy | 18,646 | 31.4 | −4.4 | |
Liberal Democrats | Anna Jones | 7,503 | 12.6 | +6.8 | |
Green | Peter Underwood | 1,782 | 3.0 | +1.2 | |
UKIP | Kathleen Garner | 442 | 0.7 | −1.1 | |
Majority | 12,339 | 20.8 | +2.2 | ||
Turnout | 59,358 | 70.7 | −2.6 | ||
Registered electors | 83,977 | ||||
Conservative hold | Swing | +1.1 |
Party | Candidate | Votes | % | ±% | |
---|---|---|---|---|---|
Conservative | Chris Philp | 33,334 | 54.4 | −0.1 | |
Labour | Jennifer Brathwaite | 21,928 | 35.8 | +11.0 | |
Liberal Democrats | Anna Jones | 3,541 | 5.8 | −0.2 | |
Green | Catherine Shelley | 1,125 | 1.8 | −1.9 | |
UKIP | Kathleen Garner | 1,116 | 1.8 | −8.7 | |
CPA | David Omamogho | 213 | 0.3 | New | |
Majority | 11,406 | 18.6 | −11.1 | ||
Turnout | 61,247 | 73.3 | +2.9 | ||
Registered electors | 83,518 | ||||
Conservative hold | Swing | −5.5 |
Party | Candidate | Votes | % | ±% | |
---|---|---|---|---|---|
Conservative | Chris Philp | 31,448 | 54.5 | +3.6 | |
Labour | Emily Benn | 14,308 | 24.8 | +4.8 | |
UKIP | Kathleen Garner | 6,068 | 10.5 | +6.1 | |
Liberal Democrats | Gill Hickson | 3,448 | 6.0 | −16.8 | |
Green | Peter Underwood | 2,154 | 3.7 | +2.0 | |
Independent | Mark Samuel | 221 | 0.4 | New | |
Class War | Jon Bigger [15] | 65 | 0.1 | New | |
Majority | 17,140 | 29.7 | +1.6 | ||
Turnout | 57,712 | 70.4 | +1.1 | ||
Registered electors | 82,010 | ||||
Conservative hold | Swing | −0.6 |
Party | Candidate | Votes | % | ±% | |
---|---|---|---|---|---|
Conservative | Richard Ottaway | 28,684 | 50.9 | −0.9 | |
Liberal Democrats | Simon Rix | 12,866 | 22.8 | +2.3 | |
Labour | Jane Avis | 11,287 | 20.0 | −4.1 | |
UKIP | Jeffrey Bolter | 2,504 | 4.4 | +2.3 | |
Green | Gordon Ross | 981 | 1.7 | New | |
Majority | 15,818 | 28.1 | +1.4 | ||
Turnout | 56,322 | 69.3 | +5.8 | ||
Registered electors | 81,303 | ||||
Conservative hold | Swing | +1.6 |
2005 notional result | |||
---|---|---|---|
Party | Vote | % | |
Conservative | 26,355 | 51.8 | |
Labour | 12,274 | 24.1 | |
Liberal Democrats | 10,458 | 20.6 | |
Others | 1,795 | 3.5 | |
Turnout | 50,882 | 63.5 | |
Electorate | 80,151 |
Party | Candidate | Votes | % | ±% | |
---|---|---|---|---|---|
Conservative | Richard Ottaway | 25,320 | 51.8 | +2.6 | |
Labour | Paul Smith | 11,792 | 24.1 | −5.8 | |
Liberal Democrats | Sandra Lawman | 10,049 | 20.6 | +2.3 | |
UKIP | James Feisenberger | 1,054 | 2.2 | 0.0 | |
Veritas | Graham Dare | 497 | 1.0 | New | |
Independent | Mark Samuel | 185 | 0.4 | 0.0 | |
Majority | 13,528 | 27.7 | +8.4 | ||
Turnout | 48,897 | 63.6 | +2.2 | ||
Registered electors | 75,812 | ||||
Conservative hold | Swing | +4.2 |
Party | Candidate | Votes | % | ±% | |
---|---|---|---|---|---|
Conservative | Richard Ottaway | 22,169 | 49.2 | +1.9 | |
Labour | Gerry Ryan | 13,472 | 29.9 | +4.6 | |
Liberal Democrats | Anna-Nicolett Gallop | 8,226 | 18.3 | −2.8 | |
UKIP | Kathleen Garner | 998 | 2.2 | New | |
Independent | Mark Samuel | 195 | 0.4 | +0.2 | |
Majority | 8,697 | 19.3 | −2.7 | ||
Turnout | 45,060 | 61.4 | −12.1 | ||
Registered electors | 73,372 | ||||
Conservative hold | Swing | −1.3 |
Party | Candidate | Votes | % | ±% | |
---|---|---|---|---|---|
Conservative | Richard Ottaway | 25,649 | 47.3 | −14.3 | |
Labour | Charlie Burling | 13,719 | 25.3 | +9.0 | |
Liberal Democrats | Steven Gauge | 11,441 | 21.1 | −0.5 | |
Referendum | Tony Barber | 2,631 | 4.9 | New | |
BNP | Paul Ferguson | 354 | 0.7 | New | |
Independent | A.G. Harker | 309 | 0.6 | New | |
Independent | Mark Samuel | 96 | 0.2 | −0.3 | |
Majority | 11,930 | 22.0 | −18.7 | ||
Turnout | 54,199 | 73.5 | −4.1 | ||
Registered electors | 73,787 | ||||
Conservative hold | Swing | −11.7 |
1992 notional result | |||
---|---|---|---|
Party | Vote | % | |
Conservative | 35,937 | 61.7 | |
Liberal Democrats | 12,599 | 21.6 | |
Labour | 9,513 | 16.3 | |
Others | 242 | 0.4 | |
Turnout | 58,291 | 78.0 | |
Electorate | 74,777 |
Party | Candidate | Votes | % | ±% | |
---|---|---|---|---|---|
Conservative | Richard Ottaway | 31,993 | 63.7 | −0.4 | |
Liberal Democrats | Peter Billenness | 11,568 | 23.0 | −1.3 | |
Labour | Helen Salmon | 6,444 | 12.8 | +3.0 | |
Independent | Mark Samuel | 239 | 0.5 | New | |
Majority | 20,425 | 40.7 | +0.9 | ||
Turnout | 50,244 | 77.6 | +3.9 | ||
Registered electors | 64,768 | ||||
Conservative hold | Swing | +0.5 |
Party | Candidate | Votes | % | ±% | |
---|---|---|---|---|---|
Conservative | William Clark | 30,732 | 64.1 | −1.0 | |
Liberal | George Morrison | 11,669 | 24.3 | −2.8 | |
Labour | Geraint Davies | 4,679 | 9.8 | +2.0 | |
Green | Paul Baldwin | 900 | 1.9 | New | |
Majority | 19,063 | 39.8 | +1.8 | ||
Turnout | 47,980 | 73.7 | +2.6 | ||
Registered electors | 65,085 | ||||
Conservative hold | Swing | +0.9 |
Party | Candidate | Votes | % | ±% | |
---|---|---|---|---|---|
Conservative | William Clark | 29,842 | 65.1 | +0.3 | |
Liberal | James Forrest [18] | 12,402 | 27.1 | +6.2 | |
Labour | Robert C E Brooks [18] | 3,568 | 7.8 | −5.5 | |
Majority | 17,440 | 38.0 | −5.9 | ||
Turnout | 46,702 | 71.1 | −5.7 | ||
Registered electors | 64,482 | ||||
Conservative hold | Swing | −2.9 |
1979 notional result [19] | |||
---|---|---|---|
Party | Vote | % | |
Conservative | 31,559 | 64.9 | |
Liberal | 10,168 | 20.9 | |
Labour | 6,450 | 13.3 | |
Others | 476 | 1.0 | |
Turnout | 48,653 | ||
Electorate |
Party | Candidate | Votes | % | ±% | |
---|---|---|---|---|---|
Conservative | William Clark [20] | 30,874 | 64.9 | +7.0 | |
Liberal | Peter Billenness [20] | 10,006 | 21.0 | −4.9 | |
Labour | John Bloom [20] | 6,249 | 13.1 | −3.1 | |
National Front | Roland Dummer [20] | 469 | 1.0 | New | |
Majority | 20,868 | 43.9 | +11.9 | ||
Turnout | 47,598 | 76.7 | +2.8 | ||
Registered electors | 62,022 | ||||
Conservative hold | Swing | +5.9 |
Party | Candidate | Votes | % | ±% | |
---|---|---|---|---|---|
Conservative | William Clark | 25,703 | 57.9 | −1.2 | |
Liberal | D Nunneley | 11,514 | 25.9 | −0.8 | |
Labour | DW Keene | 7,203 | 16.2 | +2.0 | |
Majority | 14,189 | 32.0 | −0.4 | ||
Turnout | 44,420 | 73.9 | −8.4 | ||
Registered electors | 60,090 | ||||
Conservative hold | Swing | −0.2 |
Party | Candidate | Votes | % | ±% | |
---|---|---|---|---|---|
Conservative | William Clark | 28,915 | 59.1 | −5.5 | |
Liberal | Jean Coleman | 13,048 | 26.7 | +7.8 | |
Labour | Henry Hodge | 6,965 | 14.2 | −2.3 | |
Majority | 15,867 | 32.4 | |||
Turnout | 48,928 | 82.3 | +10.0 | ||
Registered electors | 59,447 | ||||
Conservative hold | Swing | −6.7 |
1970 notional result [21] | |||
---|---|---|---|
Party | Vote | % | |
Conservative | 28,500 | 64.6 | |
Liberal | 8,300 | 18.8 | |
Labour | 7,300 | 16.6 | |
Turnout | 44,100 | 72.4 | |
Electorate | 60,952 |
Party | Candidate | Votes | % | ±% | |
---|---|---|---|---|---|
Conservative | Richard Thompson | 25,986 | 49.74 | +5.18 | |
Labour | David Winnick | 22,283 | 42.65 | −2.08 | |
Liberal | Michael R Lane | 3,673 | 7.03 | −3.68 | |
Independent | C Thornton | 303 | 0.58 | New | |
Majority | 3,703 | 7.09 | N/A | ||
Turnout | 52,245 | 71.29 | −4.81 | ||
Conservative gain from Labour | Swing | +3.63 |
Party | Candidate | Votes | % | ±% | |
---|---|---|---|---|---|
Labour | David Winnick | 21,496 | 44.73 | −2.52 | |
Conservative | Richard Thompson | 21,415 | 44.56 | −8.19 | |
Liberal | W Edward P Babbs | 5,146 | 10.71 | New | |
Majority | 81 | 0.17 | N/A | ||
Turnout | 48,057 | 76.10 | +1.83 | ||
Labour gain from Conservative | Swing | +2.84 |
Party | Candidate | Votes | % | ±% | |
---|---|---|---|---|---|
Conservative | Richard Thompson | 24,854 | 52.75 | −5.41 | |
Labour | Tyrell Burgess | 22,265 | 47.25 | +5.41 | |
Majority | 2,589 | 5.50 | −10.82 | ||
Turnout | 47,119 | 74.27 | −4.86 | ||
Conservative hold | Swing | −5.41 |
Party | Candidate | Votes | % | ±% | |
---|---|---|---|---|---|
Conservative | Richard Thompson | 29,284 | 58.16 | +1.18 | |
Labour | Frederic A Messer | 22,069 | 41.84 | −1.18 | |
Majority | 8,215 | 16.32 | +2.36 | ||
Turnout | 51,353 | 79.13 | +1.90 | ||
Conservative hold | Swing | +1.18 |
Party | Candidate | Votes | % | ±% | |
---|---|---|---|---|---|
Conservative | Richard Thompson | 27,359 | 56.98 | ||
Labour | Arthur Carr | 20,659 | 43.02 | ||
Majority | 6,700 | 13.96 | |||
Turnout | 48,018 | 77.23 | |||
Conservative hold | Swing |
Party | Candidate | Votes | % | ±% | |
---|---|---|---|---|---|
Labour | David Rees-Williams | 27,650 | 53.4 | +24.4 | |
Conservative | Herbert Williams | 24,147 | 46.6 | −15.7 | |
Majority | 3,503 | 6.8 | N/A | ||
Turnout | 51,797 | 70.1 | +4.9 | ||
Labour gain from Conservative | Swing | +20.1 |
Party | Candidate | Votes | % | ±% | |
---|---|---|---|---|---|
Conservative | Herbert Williams | 31,971 | 62.3 | −18.0 | |
Labour | T Crawford | 14,900 | 29.0 | +9.3 | |
Liberal | David William Alun Llewellyn | 4,440 | 8.7 | New | |
Majority | 17,071 | 33.3 | −27.6 | ||
Turnout | 45,860 | 65.2 | −3.1 | ||
Conservative hold | Swing |
Party | Candidate | Votes | % | ±% | |
---|---|---|---|---|---|
Conservative | Herbert Williams | 19,126 | 67.5 | −12.8 | |
Labour | Rudolph Putnam Messel | 9,189 | 32.5 | +12.8 | |
Majority | 9,937 | 35.0 | −25.7 | ||
Turnout | 28,315 | 38.2 | −30.1 | ||
Conservative hold | Swing | −12.8 |
Party | Candidate | Votes | % | ±% | |
---|---|---|---|---|---|
Conservative | William Mitchell-Thomson | 40,672 | 80.34 | +31.14 | |
Labour | T. Crawford | 9,950 | 19.66 | −9.52 | |
Majority | 30,722 | 60.69 | +40.67 | ||
Turnout | 50,622 | 68.33 | +0.91 | ||
Conservative hold | Swing | +20.33 |
Party | Candidate | Votes | % | ±% | |
---|---|---|---|---|---|
Unionist | William Mitchell-Thomson | 23,258 | 49.2 | −15.4 | |
Labour | E.W. Wilton | 13,793 | 29.2 | −6.2 | |
Liberal | Albert Sigismund Elwell-Sutton | 10,218 | 21.6 | New | |
Majority | 9,465 | 20.0 | −9.2 | ||
Turnout | 47,269 | 67.4 | −4.6 | ||
Registered electors | 70,107 | ||||
Unionist hold | Swing | −4.6 |
Party | Candidate | Votes | % | ±% | |
---|---|---|---|---|---|
Unionist | William Mitchell-Thomson | 23,734 | 64.6 | +19.1 | |
Labour | H.T. Muggeridge | 12,979 | 35.4 | +3.8 | |
Majority | 10,755 | 29.2 | +15.3 | ||
Turnout | 36,713 | 72.0 | +8.6 | ||
Registered electors | 50,964 | ||||
Unionist hold | Swing | +7.7 |
Party | Candidate | Votes | % | ±% | |
---|---|---|---|---|---|
Unionist | William Mitchell-Thomson | 14,310 | 45.5 | −1.8 | |
Labour | H.T. Muggeridge | 9,926 | 31.6 | +4.1 | |
Liberal | Wynne Cemlyn-Jones | 7,208 | 22.9 | −2.3 | |
Majority | 4,384 | 13.9 | −5.9 | ||
Turnout | 31,444 | 63.4 | −3.0 | ||
Registered electors | 49,634 | ||||
Unionist hold | Swing | −3.0 |
Party | Candidate | Votes | % | ±% | |
---|---|---|---|---|---|
Unionist | Allan Smith | 15,356 | 47.3 | −24.5 | |
Labour | H.T. Muggeridge | 8,942 | 27.5 | −0.7 | |
Liberal | Thomas Dobson | 8,183 | 25.2 | N/A | |
Majority | 6,414 | 19.8 | −23.8 | ||
Turnout | 32,481 | 66.4 | +11.4 | ||
Registered electors | 48,904 | ||||
Unionist hold | Swing | −11.9 |
Party | Candidate | Votes | % | ±% | |
---|---|---|---|---|---|
C | Unionist | Allan Smith | 11,777 | 55.2 | −16.6 |
Liberal | Howard Houlder | 9,573 | 44.8 | New | |
Majority | 2,204 | 10.4 | −33.2 | ||
Turnout | 21,350 | 45.5 | −9.5 | ||
Registered electors | 46,900 | ||||
Unionist hold | Swing | N/A | |||
Cindicates candidate endorsed by the coalition government. |
Party | Candidate | Votes | % | ±% | |
---|---|---|---|---|---|
C | Unionist | Ian Malcolm | 17,813 | 71.8 | |
Labour | H.T. Muggeridge [29] | 7,006 | 28.2 | ||
Majority | 10,807 | 43.6 | |||
Turnout | 24,819 | 55.0 | |||
Registered electors | 45,115 | ||||
Unionist win (new seat) | |||||
Cindicates candidate endorsed by the coalition government. |