Constituency profile
East Ham is an urban and suburban constituency located in the Borough of Newham in the east of London. It covers the neighbourhoods of East Ham and Little Ilford. Most of the constituency is made up of dense Victorian and Edwardian terraced housing and the population has grown rapidly during the 21st century. [3] The constituency has very high levels of deprivation and house prices are considerably lower than the London average. [4] [5]
In general, residents of the constituency are young and have low levels of education and homeownership. Household income is lower than the London average and residents are considerably less likely to work in professional occupations. [5] A majority of the population (59%) were of Asian background at the 2021 census with Bangladeshis forming the largest individual ethnic group. White people were 20% of the population, less than half of whom were of White British background, and Black people were 13%. [6] At the local council, all wards covered by the constituency are represented by Labour Party councillors. In the 2016 Brexit referendum, an estimated 53% of residents voted to remain in the European Union, higher than the nationwide figure but lower than the London average. [5]
Boundaries

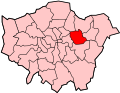
Map of boundaries 2010–2024
The constituency covers north-eastern parts of Newham, including East Ham, Little Ilford, Manor Park and Plashet.
1997–2010: The London Borough of Newham wards of Castle, Central, Greatfield, Kensington, Little Ilford, Manor Park, Monega, St Stephen's, South, and Wall End.
2010–2024: The London Borough of Newham wards of Beckton, Boleyn, East Ham Central, East Ham North, East Ham South, Green Street East, Little Ilford, Manor Park, Royal Docks, and Wall End.
2024–present: The London Borough of Newham wards of Boleyn, East Ham, East Ham South, Green Street East, Little Ilford, Manor Park, Plashet, Wall End, and small parts of Forest Gate South and Plaistow North. [8]
This page is based on this
Wikipedia article Text is available under the
CC BY-SA 4.0 license; additional terms may apply.
Images, videos and audio are available under their respective licenses.