Croydon North | |
---|---|
Former borough constituency for the House of Commons | |
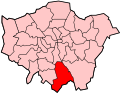
![]() Boundary of Croydon North in Greater Londonfor the 2019 general election | |
County | Greater London |
Electorate | 85,107 (December 2010) [1] |
Major settlements | Thornton Heath, Norbury, Selhurst, South Norwood, Upper Norwood |
1997–2024 | |
Seats | One |
Created from | Croydon North East and Croydon North West |
Replaced by | Streatham and Croydon North and Croydon West |
1918–1955 | |
Seats | One |
Created from | Croydon |
Replaced by | Croydon North East and Croydon North West |
Croydon North was a constituency [n 1] represented in the House of Commons of the UK Parliament from 2012 until its abolition for the 2024 general election by Steve Reed of Labour Co-op. [n 2] The seat was created in 1918 and split in two in 1955 (taking in neighbouring areas) and re-devised in a wholly different form in 1997.
Under the 2023 Periodic Review of Westminster constituencies, the majority of the constituency was incorporated into the re-established seat of Croydon West, with northern parts, including the areas of Norbury, Thornton Heath and Upper Norwood, forming part of the newly created constituency of Streatham and Croydon North. [2]
The seat was created from the former Croydon North West and part of the former North East constituencies. In its previous form it existed from 1918 until 1955.
On re-creation at the 1997 general election the MP for the seat became Malcolm Wicks of the Labour Party with the fourth largest Labour majority in Greater London. Wicks was victorious at the next two general elections and died on 29 September 2012, prompting a by-election which was won by Steve Reed of the same party. The 2015 result made the seat the 31st safest of Labour's 232 seats by percentage of majority. [3]
Croydon North is the most densely populated of Croydon's three seats, regarded as a safe Labour seat with all wards controlled by them at local level, consisting for the most part of rows of modest terraced houses, interspersed with tower blocks, much of it social and ex-social housing and with recreational areas. [4]
Passing through the constituency are London Overground and Southern services to London Victoria and Croydon — the seat is well connected by several stations to rail services. There has been some regeneration since 2000 with new-build developments for affluent commuters. [5]
The seat includes Crystal Palace FC's ground at Selhurst Park and the northeastern end of the seat is near the site of the former Crystal Palace itself.
Dates | Local authority | Maps | Wards |
---|---|---|---|
1918-1950 | County Borough of Croydon | ![]() | North, South Norwood and Upper Norwood. |
1950–1955 | ![]() | Bensham Manor, Norbury, Thornton Heath, Upper Norwood and West Thornton. | |
1997–2010 | London Borough of Croydon | ![]() | Bensham Manor, Beulah, Broad Green, Norbury, South Norwood, Thornton Heath, Upper Norwood, West Thornton and Whitehorse Manor. |
2010–2024 | ![]() | Bensham Manor, Broad Green, Norbury, Selhurst, South Norwood, Thornton Heath, Upper Norwood and West Thornton. |
Election | Member | Party | |
---|---|---|---|
1918 | George Borwick | Conservative | |
1922 | Glyn Mason | Conservative | |
1940 by-election | Henry Willink | Conservative | |
1948 by-election | Fred Harris | Conservative | |
1955 | constituency abolished |
Election | Member | Party | |
---|---|---|---|
1997 | Malcolm Wicks | Labour | |
2012 by-election | Steve Reed | Labour Co-op |
Party | Candidate | Votes | % | ±% | |
---|---|---|---|---|---|
Labour Co-op | Steve Reed | 36,495 | 65.6 | −8.6 | |
Conservative | Donald Ekekhomen | 11,822 | 21.3 | +1.4 | |
Liberal Democrats | Claire Bonham | 4,476 | 8.0 | +5.2 | |
Green | Rachel Chance | 1,629 | 2.9 | +1.3 | |
Brexit Party | Chidi Ngwaba | 839 | 1.5 | New | |
CPA | Candace Mitchell | 348 | 0.6 | New | |
Majority | 24,673 | 44.4 | −10.0 | ||
Turnout | 55,609 | 62.9 | −5.3 | ||
Registered electors | 88,466 | ||||
Labour Co-op hold | Swing | -5.0 |
Party | Candidate | Votes | % | ±% | |
---|---|---|---|---|---|
Labour Co-op | Steve Reed | 44,213 | 74.2 | +11.6 | |
Conservative | Samuel Kasumu | 11,848 | 19.9 | −2.8 | |
Liberal Democrats | Maltby Pindar | 1,656 | 2.8 | −0.8 | |
Green | Peter Underwood | 983 | 1.6 | −3.1 | |
UKIP | Michael Swadling | 753 | 1.3 | −4.1 | |
Independent | Lee Berks | 170 | 0.3 | 0.0 | |
Majority | 32,365 | 54.3 | +14.4 | ||
Turnout | 59,623 | 68.2 | +5.9 | ||
Registered electors | 87,461 | ||||
Labour Co-op hold | Swing | +7.2 |
Party | Candidate | Votes | % | ±% | |
---|---|---|---|---|---|
Labour Co-op | Steve Reed | 33,513 | 62.6 | +6.6 | |
Conservative | Vidhi Mohan | 12,149 | 22.7 | −1.4 | |
UKIP | Winston McKenzie | 2,899 | 5.4 | +3.7 | |
Green | Shasha Khan | 2,515 | 4.7 | +2.7 | |
Liberal Democrats | Joanna Corbin | 1,919 | 3.6 | −10.4 | |
TUSC | Glen Hart | 261 | 0.5 | New | |
Independent | Lee Berks | 141 | 0.3 | New | |
Communist | Ben Stevenson | 125 | 0.2 | −0.1 | |
Majority | 21,364 | 39.9 | −8.0 | ||
Turnout | 53,522 | 62.3 | +1.7 | ||
Registered electors | 85,941 | ||||
Labour Co-op hold | Swing | +4.0 |
Party | Candidate | Votes | % | ±% | |
---|---|---|---|---|---|
Labour Co-op | Steve Reed | 15,892 | 64.7 | +8.7 | |
Conservative | Andrew Stranack | 4,137 | 16.8 | −7.3 | |
UKIP | Winston McKenzie | 1,400 | 5.7 | +4.0 | |
Liberal Democrats | Marisha Ray | 860 | 3.5 | −10.5 | |
Green | Shasha Khan | 855 | 3.5 | +1.5 | |
Respect | Lee Jasper | 707 | 2.9 | +2.4 | |
CPA | Stephen Hammond | 192 | 0.8 | New | |
National Front | Richard Edmonds | 161 | 0.7 | New | |
Communist | Ben Stevenson | 119 | 0.5 | +0.2 | |
Monster Raving Loony | John Cartwright | 110 | 0.4 | New | |
Nine Eleven Was An Inside Job | Simon Lane | 66 | 0.3 | New | |
Young People's | Robin Smith | 63 | 0.3 | New | |
Majority | 11,755 | 47.9 | +16.0 | ||
Turnout | 24,562 | 26.5 | −34.1 | ||
Rejected ballots | 112 | 0.1 | |||
Registered electors | 93,036 | ||||
Labour Co-op hold | Swing | +8.0 |
Party | Candidate | Votes | % | ±% | |
---|---|---|---|---|---|
Labour | Malcolm Wicks | 28,947 | 56.0 | +2.4 | |
Conservative | Jason Hadden | 12,466 | 24.1 | +1.9 | |
Liberal Democrats | Gerry Jerome | 7,226 | 14.0 | −3.2 | |
Green | Shasha Khan | 1,017 | 2.0 | −0.9 | |
UKIP | Jonathan Serter | 891 | 1.7 | 0.0 | |
Christian | Novlette Williams | 586 | 1.1 | New | |
Respect | Mohommad Shaikh | 272 | 0.5 | New | |
Communist | Ben Stevenson | 160 | 0.3 | New | |
Independent | Mohamed Seyed | 111 | 0.2 | New | |
Majority | 16,481 | 31.9 | +0.5 | ||
Turnout | 51,676 | 60.6 | +8.0 | ||
Registered electors | 85,216 | ||||
Labour hold | Swing | +0.3 |
Party | Candidate | Votes | % | ±% | |
---|---|---|---|---|---|
Labour | Malcolm Wicks | 23,555 | 53.7 | −9.8 | |
Conservative | Tariq Ahmad | 9,667 | 22.0 | −1.3 | |
Liberal Democrats | Adrian Gee-Turner | 7,590 | 17.2 | +6.8 | |
Green | Shasha Khan | 1,248 | 2.8 | New | |
UKIP | Henry Pearce | 770 | 1.8 | +0.4 | |
Croydon Pensions Alliance | Peter Gibson | 394 | 0.9 | New | |
Veritas | Winston McKenzie | 324 | 0.7 | New | |
Independent | Farhan Rasheed | 197 | 0.4 | New | |
The People's Choice! Exclusively For All | Michelle Chambers | 132 | 0.3 | New | |
Majority | 13,888 | 31.7 | −8.5 | ||
Turnout | 43,877 | 52.3 | −0.9 | ||
Registered electors | 83,629 | ||||
Labour hold | Swing | -4.3 |
Party | Candidate | Votes | % | ±% | |
---|---|---|---|---|---|
Labour | Malcolm Wicks | 26,610 | 63.5 | +1.3 | |
Conservative | Simon Allison | 9,752 | 23.3 | −3.9 | |
Liberal Democrats | Sandra Lawman | 4,375 | 10.4 | +2.7 | |
UKIP | Alan Smith | 606 | 1.4 | +0.6 | |
Socialist Alliance | Don Madgwick | 539 | 1.3 | New | |
Majority | 16,858 | 40.2 | +5.2 | ||
Turnout | 41,882 | 53.2 | −15.0 | ||
Registered electors | 78,675 | ||||
Labour hold | Swing | -2.6 |
Party | Candidate | Votes | % | ±% | |
---|---|---|---|---|---|
Labour | Malcolm Wicks | 32,672 | 62.2 | ||
Conservative | Ian Martin | 14,274 | 27.2 | ||
Liberal Democrats | Martin Morris | 4,066 | 7.7 | ||
Referendum | Roger Billis | 1,155 | 2.2 | ||
UKIP | James R. Feisenberger | 396 | 0.8 | ||
Majority | 18,398 | 35.0 | |||
Turnout | 52,563 | 68.2 | |||
Registered electors | 77,063 | ||||
Labour win (new seat) |
Party | Candidate | Votes | % | ±% | |
---|---|---|---|---|---|
Conservative | Fred Harris | 29,984 | 55.5 | +2.1 | |
Labour | Reg Prentice | 19,738 | 36.6 | +0.1 | |
Liberal | Brian Dudley Collins | 4,272 | 7.9 | −2.3 | |
Majority | 10,246 | 18.9 | +2.0 | ||
Turnout | 53,994 | 83.7 | −3.1 | ||
Registered electors | 64,522 | ||||
Conservative hold | Swing | +1.0 |
Party | Candidate | Votes | % | ±% | |
---|---|---|---|---|---|
Conservative | Fred Harris | 29,420 | 53.4 | +12.3 | |
Labour | Reg Prentice | 20,116 | 36.5 | −3.6 | |
Liberal | Frederick Owen Halsall Rowlands | 5,600 | 10.2 | +0.8 | |
Majority | 9,304 | 16.9 | −0.5 | ||
Turnout | 55,136 | 86.8 | +13.4 | ||
Registered electors | 63,537 | ||||
Conservative hold | Swing |
Party | Candidate | Votes | % | ±% | |
---|---|---|---|---|---|
Conservative | Fred Harris | 36,200 | 54.0 | +13.9 | |
Labour | Harold Nicolson | 24,536 | 36.6 | −3.5 | |
Liberal | Don Bennett | 6,321 | 9.4 | −9.4 | |
Majority | 11,664 | 17.4 | +16.4 | ||
Turnout | 67,057 | 74.8 | +1.4 | ||
Registered electors | |||||
Conservative hold | Swing | +8.7 |
Party | Candidate | Votes | % | ±% | |
---|---|---|---|---|---|
Conservative | Henry Willink | 23,417 | 41.1 | −26.0 | |
Labour | Marion Billson | 22,810 | 40.1 | +7.2 | |
Liberal | John Howard | 10,714 | 18.8 | New | |
Majority | 607 | 1.0 | −33.2 | ||
Turnout | 56,941 | 73.4 | +8.8 | ||
Registered electors | 77,594 | ||||
Conservative hold | Swing | -16.6 |
Party | Candidate | Votes | % | ±% | |
---|---|---|---|---|---|
Conservative | Henry Willink | 14,163 | 90.7 | +23.6 | |
Independent | Arthur Lascelles Lucas | 1,445 | 9.3 | New | |
Majority | 12,718 | 81.4 | +47.2 | ||
Turnout | 15,608 | 18.3 | −46.3 | ||
Registered electors | |||||
Conservative hold | Swing |
Party | Candidate | Votes | % | ±% | |
---|---|---|---|---|---|
Conservative | Glyn Mason | 36,383 | 67.1 | −13.8 | |
Labour | Frank Mitchell | 17,872 | 32.9 | +13.8 | |
Majority | 18,511 | 34.2 | −27.6 | ||
Turnout | 54,255 | 64.6 | −4.8 | ||
Registered electors | 83,986 | ||||
Conservative hold | Swing | -13.8 |
Party | Candidate | Votes | % | ±% | |
---|---|---|---|---|---|
Conservative | Glyn Mason | 45,595 | 80.9 | +30.5 | |
Labour | H.W. Ray | 10,795 | 19.1 | −7.4 | |
Majority | 34,800 | 61.8 | +37.9 | ||
Turnout | 56,490 | 69.4 | −0.4 | ||
Registered electors | 81,305 | ||||
Conservative hold | Swing | +19.0 |
Party | Candidate | Votes | % | ±% | |
---|---|---|---|---|---|
Unionist | Glyn Mason | 26,336 | 50.4 | −19.9 | |
Labour | Gilbert Foan | 13,852 | 26.5 | −3.2 | |
Liberal | Cyril Walter Nunneley | 12,053 | 23.1 | New | |
Majority | 12,484 | 23.9 | −16.7 | ||
Turnout | 52,241 | 69.8 | −3.0 | ||
Registered electors | 74,835 | ||||
Unionist hold | Swing | -8.4 |
Party | Candidate | Votes | % | ±% | |
---|---|---|---|---|---|
Unionist | Glyn Mason | 25,972 | 70.3 | +7.3 | |
Labour | Gilbert Foan | 10,954 | 29.7 | −7.3 | |
Majority | 15,018 | 40.6 | +14.6 | ||
Turnout | 36,926 | 72.8 | +17.1 | ||
Registered electors | 50,697 | ||||
Unionist hold | Swing | +7.3 |
Party | Candidate | Votes | % | ±% | |
---|---|---|---|---|---|
Unionist | Glyn Mason | 17,085 | 63.0 | N/A | |
Labour | Gilbert Foan | 10,054 | 37.0 | New | |
Majority | 7,031 | 26.0 | N/A | ||
Turnout | 27,139 | 55.7 | N/A | ||
Registered electors | 48,760 | ||||
Unionist hold | Swing | N/A |
Party | Candidate | Votes | % | ±% | |
---|---|---|---|---|---|
Unionist | Glyn Mason | Unopposed | |||
Registered electors | 47,675 | ||||
Unionist hold |
Party | Candidate | Votes | % | ±% | |
---|---|---|---|---|---|
C | Unionist | George Borwick | 16,520 | 70.0 | |
Liberal | James Trumble | 7,094 | 30.0 | ||
Majority | 9,426 | 40.0 | |||
Turnout | 23,614 | 54.1 | |||
Registered electors | 43,669 | ||||
Unionist win (new seat) | |||||
Cindicates candidate endorsed by the coalition government. |
{{cite web}}
: CS1 maint: archived copy as title (link){{cite web}}
: CS1 maint: archived copy as title (link)