| Broad Green | |
|---|---|
| ward for Croydon Council | |
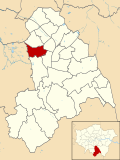
| Boundary of Broad Green in Croydon from 2018. | |
| County | Greater London |
| Current ward | |
| Created | 1965 |
| Councillor | Stuart Collins (Labour) |
| Councillor | Sherwan Chowdhury (Labour) |
| Councillor | Manju Shahul-Hameed (Labour) |
| Number of councillors | Three |
| UK Parliament constituency | Croydon West |
Broad Green is a ward in the London Borough of Croydon, London in the United Kingdom, covering the West Croydon area. Broad Green locality is divided between this ward and Selhurst ward.
The ward extends from central Croydon to the south to the boundary with the London Boroughs of Sutton and Merton by Mitcham Common. It includes part of the retail core of Croydon and the northern part of the Purley Way retail area.
The ward returns three councillors every four years. At the 2011 Census the ward had a population of 18,652. [1]
The ward currently forms part of Sarah Jones MP's Croydon North constituency. [2]
The ward became smaller in 2018, following boundary changes in Croydon.
| Election | Councillor | Party | Councillor | Party | Councillor | Party | ||||||
|---|---|---|---|---|---|---|---|---|---|---|---|---|
| 1964 | Ward created | |||||||||||
| Miss L. Overton | Labour | F. G. West | Labour | A. G. Wright | Labour | |||||||
| 1968 | L. D. Emerton | Conservative | R. H. Kent | Conservative | L. T. Wiles | Conservative | ||||||
| 1971 | P. J. Grieve Smith | Labour | P. Byrne | Labour | Mrs Ann M. Watson, J.P. | Labour | ||||||
| 1974 | Michael Warne | Labour | ||||||||||
| 1978 | James A. Keeling | Labour | ||||||||||
| 1982 | Gillian Charman | Conservative | Andrew J. Pelling | Conservative | Douglas A. H. Sharman | Conservative | ||||||
| 1986 | Christine M. Jarrold | Labour | Kevin D. Jarrold | Labour | Hugh P. Atkinson | Labour | ||||||
| 1990 | Rodney G. D. Matlock | Labour | Anthony J. Slatcher | Labour | Peter L. Spalding | Labour | ||||||
| 1993 by-election | Stuart Collins | Labour | ||||||||||
| 2002 | Timothy Godfrey | Labour | Mike Selva | Labour | ||||||||
| 2006 | Manju Shahul-Hameed | Labour | ||||||||||
| 2018 | Muhammad Ali | Labour | ||||||||||
| 2022 | Sherwan Chowdhury | Labour | ||||||||||
Below are the results for the candidate which received the highest share of the popular vote in the ward at each mayoral election.
| Year | Mayoral candidate | Party | Winner? | |
|---|---|---|---|---|
| 2022 | Val Shawcross | Labour | ||
| Party | Candidate | Votes | % | ±% | |
|---|---|---|---|---|---|
| Labour | Stuart Collins* | 1,885 | 20.7 | ||
| Labour | Sherwan Chowdhury† | 1,764 | 19.4 | ||
| Labour | Manju Shahul-Hameed* | 1,707 | 18.8 | ||
| Conservative | Jane Parker | 775 | 8.5 | ||
| Conservative | Peter Anike | 769 | 8.5 | ||
| Conservative | James Rajadurai | 721 | 7.9 | ||
| Liberal Democrats | Adrian George Waters | 420 | 4.6 | ||
| Green | Winston Phillips | 389 | 4.3 | ||
| Green | DJ Singh | 331 | 3.6 | ||
| Green | Irene Theochari | 325 | 3.6 | ||
| Turnout | 3,534 | 26.52 | |||
| Labour hold | Swing | ||||
| Labour hold | Swing | ||||
| Labour hold | Swing | ||||
| Party | Candidate | Votes | % | ±% | |
|---|---|---|---|---|---|
| Labour | Stuart Collins | 3,105 | 74.8 | ||
| Labour | Muhammad Ali | 2,820 | 68.0 | ||
| Labour | Manju Shahul-Hameed | 2,678 | 64.5 | ||
| Conservative | Jayde Edwards | 698 | 16.8 | ||
| Conservative | Kofi Frimpong | 693 | 16.7 | ||
| Conservative | Sharmmi Jeganmogan | 661 | 15.9 | ||
| Green | Tim Watson | 414 | 10.0 | ||
| Green | Am Weatherspoon | 299 | 7.2 | ||
| Majority | 1,980 | 17.42 | |||
| Turnout | |||||
| Labour hold | Swing | ||||
| Labour hold | Swing | ||||
| Labour hold | Swing | ||||
| Party | Candidate | Votes | % | ±% | |
|---|---|---|---|---|---|
| Labour | Stuart Collins | 2,754 | |||
| Labour | Mike Selva | 2,609 | |||
| Labour | Manju Shahul-Hameed | 2,289 | |||
| Conservative | Fabion Emmanuel | 761 | |||
| Conservative | Andrew Stevensen | 579 | |||
| Conservative | Sophia Khan | 535 | |||
| UKIP | Peter Kirby | 500 | |||
| UKIP | Herman Lyken | 404 | |||
| Green | Nicholas Barnett | 395 | |||
| Green | Bimal Mohanan | 301 | |||
| Green | Pravina Ellis | 265 | |||
| Liberal Democrats | Syed Mohiuddin | 170 | |||
| TUSC | Paul McMillan | 69 | |||
| Communist | Peter Latham | 69 | |||
| TUSC | Ragesh Khakhira | 65 | |||
| Majority | |||||
| Turnout | |||||
| Labour hold | Swing | ||||
| Labour hold | Swing | ||||
| Labour hold | Swing | ||||
| Party | Candidate | Votes | % | ±% | |
|---|---|---|---|---|---|
| Labour | Stuart Collins | 1,777 | |||
| Labour | Mike Selva | 1,600 | |||
| Labour | Manju Shahul-Hameed | 1,576 | |||
| Conservative | Ian Parker | 1,076 | |||
| Conservative | Patrick Ratnaraja | 1,073 | |||
| Conservative | Jill Thomas | 975 | |||
| Liberal Democrats | Syed Mohiuddin | 513 | |||
| Communist | Peter Latham | 177 | |||
| Turnout | 3,426 | 31.5% | |||
| Registered electors | 10,885 | ||||
| Labour hold | Swing | ||||
| Labour hold | Swing | ||||
| Labour hold | Swing | ||||
| Party | Candidate | Votes | % | ±% | |
|---|---|---|---|---|---|
| Labour | Stuart Collins | 1,737 | |||
| Labour | Timothy Godfrey | 1,634 | |||
| Labour | Michael S.P. Selvanayagam | 1,594 | |||
| Conservative | Ian J. Parker | 591 | |||
| Conservative | Keith B. Pearson | 514 | |||
| Conservative | Jill Thomas | 492 | |||
| UKIP | Christopher N. Pearce | 264 | |||
| Majority | |||||
| Turnout | |||||
| Labour hold | Swing | ||||
| Labour hold | Swing | ||||
| Labour hold | Swing | ||||
| Party | Candidate | Votes | % | ±% | |
|---|---|---|---|---|---|
| Labour | Rodney G. Matlock | 1,395 | |||
| Labour | Stuart Collins | 1,331 | |||
| Labour | Peter L. Spalding | 1,253 | |||
| Conservative | Ian J. Parker | 612 | |||
| Conservative | Jill Thomas | 553 | |||
| Conservative | Keith B. Pearson | 532 | |||
| Majority | |||||
| Turnout | |||||
| Registered electors | |||||
| Labour hold | Swing | ||||
| Labour hold | Swing | ||||
| Labour hold | Swing | ||||
| Party | Candidate | Votes | % | ±% | |
|---|---|---|---|---|---|
| Labour | Stuart Collins | 2,230 | |||
| Labour | Rodney G. D. Matlock | 2,171 | |||
| Labour | Peter L. Spalding | 2,008 | |||
| Conservative | Eric S. Headlam | 832 | |||
| Conservative | Keith B. Pearson | 718 | |||
| Conservative | Donald S. Speakman | 693 | |||
| Majority | 1,176 | ||||
| Turnout | |||||
| Registered electors | |||||
| Labour hold | Swing | ||||
| Labour hold | Swing | ||||
| Labour hold | Swing | ||||
| Party | Candidate | Votes | % | ±% | |
|---|---|---|---|---|---|
| Labour | Stuart Collins | 1,972 | 74.6 | ||
| Conservative | Patricia F. L. Knight | 528 | 20.0 | ||
| Liberal Democrats | David A. Holmes | 143 | 5.4 | ||
| Majority | 1,244 | 54.5 | |||
| Turnout | 2,643 | 30.2 | |||
| Labour hold | Swing | ||||
The by-election was called following the resignation of Cllr. Anthony J. Slatcher.
| Party | Candidate | Votes | % | ±% | |
|---|---|---|---|---|---|
| Labour Co-op | Rodney G. D. Matlock | 2,019 | |||
| Labour Co-op | Anthony J. Slatcher | 1,926 | |||
| Labour Co-op | Peter L. Spalding | 1,896 | |||
| Conservative | Kelly Ellender | 1,004 | |||
| Conservative | Mohammed I. Khokhar | 804 | |||
| Conservative | Yvonne E. Singh | 785 | |||
| Majority | 892 | ||||
| Turnout | |||||
| Registered electors | |||||
| Labour Co-op hold | Swing | ||||
| Labour Co-op hold | Swing | ||||
| Labour Co-op hold | Swing | ||||
| Party | Candidate | Votes | % | ±% | |
|---|---|---|---|---|---|
| Labour | Christine M. Jarrold | 1,913 | |||
| Labour | Kevin D. Jarrold | 1,895 | |||
| Labour | Hugh P. Atkinson | 1,887 | |||
| Conservative | Geoffrey N. de Bois | 870 | |||
| Conservative | Douglas A. H. Sharman | 801 | |||
| Conservative | Stephen G. Ghero | 792 | |||
| Alliance | Christopher M. Pocock | 524 | |||
| Alliance | Christopher D. Hunt | 513 | |||
| Alliance | Stephen A. Hall | 500 | |||
| Majority | 1,017 | ||||
| Turnout | |||||
| Registered electors | |||||
| Labour gain from Conservative | Swing | ||||
| Labour gain from Conservative | Swing | ||||
| Labour gain from Conservative | Swing | ||||
| Party | Candidate | Votes | % | ±% | |
|---|---|---|---|---|---|
| Conservative | Gillian Charman | 1,216 | |||
| Conservative | Andrew J. Pelling | 1,173 | |||
| Conservative | Douglas A.H. Sharman | 1,151 | |||
| Labour | James A. Keeling | 1,138 | |||
| Labour | Victor Martin | 1,067 | |||
| Labour | Ann M. Watson | 1,057 | |||
| Alliance | Moira C. Bamfield | 846 | |||
| Liberal | Charles E. Burling | 831 | |||
| Alliance | David E. Beeke | 823 | |||
| Communist | Peter A.G. Latham | 78 | |||
| Turnout | |||||
| Conservative gain from Labour | Swing | ||||
| Conservative gain from Labour | Swing | ||||
| Conservative gain from Labour | Swing | ||||
| Party | Candidate | Votes | % | ±% | |
|---|---|---|---|---|---|
| Labour | James A. Keeling | 1,708 | |||
| Labour | Ann Watson, J.P. | 1,700 | |||
| Labour | Michael Warne | 1,694 | |||
| Conservative | Christopher N. P. Lewis | 1,316 | |||
| Conservative | Rosemary P. Tomlin | 1,304 | |||
| Conservative | Joseph P. Szadlo | 1,177 | |||
| Liberal | Joan H. Leck | 305 | |||
| Liberal | Roger W. Stephens | 279 | |||
| Liberal | Gwendoline M. Luxford | 274 | |||
| Majority | 378 | ||||
| Turnout | 37.9 | ||||
| Registered electors | 9,624 | ||||
| Labour hold | Swing | ||||
| Labour hold | Swing | ||||
| Labour hold | Swing | ||||
| Party | Candidate | Votes | % | ±% | |
|---|---|---|---|---|---|
| Labour | Mrs A. M. Watson | 1,996 | |||
| Labour | P. Byrne | 1,939 | |||
| Labour | M. Warne | 1,913 | |||
| Conservative | L. T. Wiles | 993 | |||
| Conservative | P. R. Woolford | 951 | |||
| Conservative | J. P. Szadlo | 873 | |||
| Liberal | R. W. Stephens | 465 | |||
| Majority | 920 | ||||
| Turnout | 34.8 | ||||
| Registered electors | 9,749 | ||||
| Labour hold | Swing | ||||
| Labour hold | Swing | ||||
| Labour hold | Swing | ||||
| Party | Candidate | Votes | % | ±% | |
|---|---|---|---|---|---|
| Labour | P. J. Grieve Smith | 2,503 | |||
| Labour Co-op | P. Byrne | 2,462 | |||
| Labour Co-op | Mrs A. M. Watson | 2,395 | |||
| Conservative | R. H. Kent | 1,149 | |||
| Conservative | L. H. Rosan | 1,095 | |||
| Conservative | L. T. Wiles | 1,071 | |||
| Turnout | 39.1 | ||||
| Registered electors | 9,703 | ||||
| Labour gain from Conservative | Swing | ||||
| Labour Co-op gain from Conservative | Swing | ||||
| Labour Co-op gain from Conservative | Swing | ||||
| Party | Candidate | Votes | % | ±% | |
|---|---|---|---|---|---|
| Conservative | L.D. Emerton | 1,592 | |||
| Conservative | R.H. Kent | 1,538 | |||
| Conservative | L.T. Wiles | 1,530 | |||
| Labour | P. Byrne | 1,042 | |||
| Labour | Mrs W.M. Holt | 1,041 | |||
| Labour | F.G. West | 1,025 | |||
| Communist | Mrs A. Waddell | 175 | |||
| Turnout | 28.7 | ||||
| Registered electors | 9,970 | ||||
| Conservative gain from Labour | Swing | ||||
| Conservative gain from Labour | Swing | ||||
| Conservative gain from Labour | Swing | ||||
| Party | Candidate | Votes | % | ±% | |
|---|---|---|---|---|---|
| Labour | Miss L. Overton | 2,151 | |||
| Labour | F. G. West | 2,084 | |||
| Labour | A. G. Wright | 2,064 | |||
| Conservative | J. M. Stamford | 924 | |||
| Conservative | Miss M. Baker-Rogers | 890 | |||
| Conservative | D. M. Stranack | 868 | |||
| Communist | C. Young | 153 | |||
| Turnout | 3,188 | 29.3 | |||
| Registered electors | 10,866 | ||||
| Labour win (new seat) | |||||
| Labour win (new seat) | |||||
| Labour win (new seat) | |||||