Bermondsey | |
---|---|
Former borough constituency for the House of Commons | |
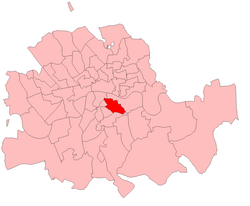
![]() Boundary of Bermondsey in Greater Londonfor the February 1974 general election | |
1885–1918 | |
Seats | one |
Created from | Southwark |
Replaced by | Bermondsey West and Rotherhithe |
1950–1983 | |
Seats | one |
Created from | Bermondsey West and Rotherhithe |
Replaced by | Southwark and Bermondsey |
Bermondsey was a borough constituency centred on the Bermondsey district of South London, England. It returned one Member of Parliament (MP) to the House of Commons of the Parliament of the United Kingdom. Elections were held using the first-past-the-post voting system.
The constituency was created for the 1885 general election and abolished for the 1918 general election, when almost all its territory was represented by the new Bermondsey West and a very small amount going into the existing Rotherhithe constituency.
A new Bermondsey constituency was created for the 1950 general election including Rotherhithe, was and abolished for the 1983 election, when it was largely replaced by the new Southwark and Bermondsey constituency.
The 1983 by-election was one of the most bitterly contested by-elections in the United Kingdom as it involved Bob Mellish, the retired Labour MP, running a highly personal and homophobic campaign against the Labour candidate, Peter Tatchell. The result was the election of Simon Hughes as a Liberal in a former Labour stronghold.
Dates | Local authority | Maps | Wards |
---|---|---|---|
1885–1918 | Metropolitan Borough of Bermondsey (after 1900) | ![]() | |
1950–1974 | Metropolitan Borough of Bermondsey (before 1965) London Borough of Southwark (after 1965) | ![]() | Metropolitan Borough of Bermondsey |
1974–1983 | London Borough of Wandsworth | ![]() | Abbey, Bricklayers, Browning, Cathedral, Chaucer, Dockyard, Riverside, and Rotherhithe. [1] |
Election | Member [2] | Party [3] | Notes | |
---|---|---|---|---|
1885 | Thorold Rogers | Liberal | Member for Southwark (1880–1885) | |
1886 | Alfred Lafone | Conservative | ||
1892 | Reuben Barrow | Liberal | ||
1895 | Alfred Lafone | Conservative | ||
1900 | Henry Cust | |||
1906 | George Cooper | Liberal | Died in office | |
1909 by-election | John Dumphreys | Conservative | ||
1910 | Harold Glanville | Liberal | Contested Bermondsey West following redistribution | |
1918 | Constituency abolished: see Rotherhithe and Bermondsey West |
Election | Member | Party | Notes | |
---|---|---|---|---|
1950 | Bob Mellish | Labour | Labour Chief Whip 1969–1976. Resigned November 1982 | |
1983 by-election | Simon Hughes | Liberal | Contested Southwark and Bermondsey following redistribution | |
1983 | constituency abolished: see Southwark and Bermondsey |
Party | Candidate | Votes | % | |
---|---|---|---|---|
Liberal | Thorold Rogers | 3,469 | 50.6 | |
Conservative | Alfred Lafone | 3,386 | 49.4 | |
Majority | 83 | 1.2 | ||
Turnout | 6,855 | 72.7 | ||
Registered electors | 9,433 | |||
Liberal win (new seat) |
Party | Candidate | Votes | % | ±% | |
---|---|---|---|---|---|
Conservative | Alfred Lafone | 3,356 | 52.8 | +3.4 | |
Liberal | Thorold Rogers | 2,998 | 47.2 | −3.4 | |
Majority | 358 | 5.6 | N/A | ||
Turnout | 6,354 | 67.4 | −5.3 | ||
Registered electors | 9,433 | ||||
Conservative gain from Liberal | Swing | +3.4 |
Party | Candidate | Votes | % | ±% | |
---|---|---|---|---|---|
Liberal | Reuben Barrow | 4,390 | 54.1 | +6.9 | |
Conservative | Alfred Lafone | 3,732 | 45.9 | −6.9 | |
Majority | 658 | 8.2 | N/A | ||
Turnout | 8,122 | 75.9 | +8.5 | ||
Registered electors | 10,702 | ||||
Liberal gain from Conservative | Swing | +6.9 |
Party | Candidate | Votes | % | ±% | |
---|---|---|---|---|---|
Conservative | Alfred Lafone | 4,182 | 52.2 | +6.3 | |
Liberal | Reuben Barrow | 3,822 | 47.8 | −6.3 | |
Majority | 360 | 4.5 | N/A | ||
Turnout | 8,004 | 73.2 | −2.7 | ||
Registered electors | 10,935 | ||||
Conservative gain from Liberal | Swing | +6.3 |
Party | Candidate | Votes | % | ±% | |
---|---|---|---|---|---|
Conservative | Henry Cust | 4,017 | 51.9 | −0.3 | |
Liberal | John Benn | 3,717 | 48.1 | +0.3 | |
Majority | 300 | 3.8 | −0.6 | ||
Turnout | 7,734 | 69.0 | −4.2 | ||
Registered electors | 11,211 | ||||
Conservative hold | Swing | −0.3 |
Party | Candidate | Votes | % | ±% | |
---|---|---|---|---|---|
Liberal | George Cooper | 4,775 | 61.3 | +13.2 | |
Conservative | Henry Cust | 3,016 | 38.7 | −13.2 | |
Majority | 1,759 | 22.6 | N/A | ||
Turnout | 7,791 | 73.4 | +4.4 | ||
Registered electors | 10,619 | ||||
Liberal gain from Conservative | Swing | +13.2 |
Party | Candidate | Votes | % | ±% | |
---|---|---|---|---|---|
Conservative | John Dumphreys | 4,278 | 47.5 | +8.8 | |
Liberal | Spencer Leigh Hughes | 3,291 | 36.6 | −24.7 | |
Labour | Alfred Salter | 1,435 | 15.9 | New | |
Majority | 987 | 10.9 | N/A | ||
Turnout | 9,004 | 73.6 | +0.2 | ||
Registered electors | 12,233 | ||||
Conservative gain from Liberal | Swing | +16.8 |
Party | Candidate | Votes | % | ±% | |
---|---|---|---|---|---|
Liberal | Harold Glanville | 5,477 | 54.9 | −6.4 | |
Conservative | John Dumphreys | 4,508 | 45.1 | +6.4 | |
Majority | 969 | 9.8 | −12.9 | ||
Turnout | 9,985 | 82.4 | +9.1 | ||
Registered electors | 12,115 | ||||
Liberal hold | Swing | −6.4 |
Party | Candidate | Votes | % | ±% | |
---|---|---|---|---|---|
Liberal | Harold Glanville | 4,911 | 57.1 | +2.2 | |
Conservative | John Dumphreys | 3,695 | 42.9 | −2.2 | |
Majority | 1,216 | 14.2 | +4.4 | ||
Turnout | 8,606 | 71.0 | −11.4 | ||
Registered electors | 12,115 | ||||
Liberal hold | Swing | +2.2 |
Party | Candidate | Votes | % | |
---|---|---|---|---|
Labour | Bob Mellish | 26,018 | 76.9 | |
Conservative | F Warwick | 5,964 | 17.6 | |
Liberal | Bridget Talbot | 1,852 | 5.5 | |
Majority | 20,054 | 59.3 | ||
Turnout | 33,834 | 79.7 | ||
Registered electors | 42,467 | |||
Labour win (new seat) |
Party | Candidate | Votes | % | ±% | |
---|---|---|---|---|---|
Labour | Bob Mellish | 26,267 | 78.9 | +2.0 | |
Conservative | Ralph Manders | 5,265 | 15.8 | –1.8 | |
Liberal | Harry Wilson | 1,779 | 5.3 | –0.1 | |
Majority | 21,002 | 63.0 | +3.8 | ||
Turnout | 33,311 | 78.2 | –1.5 | ||
Registered electors | 42,587 | ||||
Labour hold | Swing | +1.9 |
Party | Candidate | Votes | % | ±% | |
---|---|---|---|---|---|
Labour | Bob Mellish | 21,709 | 76.7 | –2.1 | |
Conservative | Catherine Orr-Ewing | 4,309 | 15.2 | –0.6 | |
Liberal | Harry Wilson | 1,554 | 5.49 | +0.2 | |
Ind. Labour Party | H Birkett | 715 | 2.5 | New | |
Majority | 17,400 | 61.5 | –1.5 | ||
Turnout | 28,287 | 69.5 | −8.7 | ||
Registered electors | 40,695 | ||||
Labour hold | Swing | –0.8 |
Party | Candidate | Votes | % | ±% | |
---|---|---|---|---|---|
Labour | Bob Mellish | 20,528 | 76.8 | +0.1 | |
Conservative | Kenneth Payne | 6,187 | 23.2 | +7.9 | |
Majority | 14,341 | 53.7 | –7.8 | ||
Turnout | 27,715 | 70.4 | +0.9 | ||
Registered electors | 37,921 | ||||
Labour hold | Swing | –3.9 |
Party | Candidate | Votes | % | ±% | |
---|---|---|---|---|---|
Labour | Bob Mellish | 17,481 | 79.3 | +2.4 | |
Conservative | Jeremy Porter | 4,568 | 20.7 | –2.4 | |
Majority | 12,913 | 58.6 | +4.9 | ||
Turnout | 22,049 | 63.3 | –7.2 | ||
Registered electors | 34,845 | ||||
Labour hold | Swing | +2.4 |
Party | Candidate | Votes | % | ±% | |
---|---|---|---|---|---|
Labour | Bob Mellish | 16,605 | 80.6 | +1.3 | |
Conservative | Jeremy Porter | 3,990 | 19.4 | –1.3 | |
Majority | 12,615 | 61.2 | +2.7 | ||
Turnout | 20,095 | 60.91 | –2.4 | ||
Registered electors | 33,811 | ||||
Labour hold | Swing | +1.3 |
Party | Candidate | Votes | % | ±% | |
---|---|---|---|---|---|
Labour | Bob Mellish | 13,908 | 76.9 | –3.7 | |
Conservative | George Nicholson | 4,172 | 23.1 | +3.7 | |
Majority | 9,736 | 53.9 | –7.4 | ||
Turnout | 18,090 | 52.9 | –8.0 | ||
Registered electors | 34,166 | ||||
Labour hold | Swing | +3.7 |
1970 notional result [7] | |||
---|---|---|---|
Party | Vote | % | |
Labour | 24,700 | 73.3 | |
Conservative | 9,000 | 26.7 | |
Turnout | 33,700 | 50.4 | |
Electorate | 66,835 |
Party | Candidate | Votes | % | ±% | |
---|---|---|---|---|---|
Labour | Bob Mellish | 24,847 | 68.6 | –4.7 | |
Conservative | Howard Flight | 6,126 | 16.9 | –9.8 | |
Liberal | Chris Hewittson [9] | 3,751 | 10.4 | New | |
National Front | G Davey | 1,485 | 4.1 | New | |
Majority | 18,721 | 51.7 | +5.1 | ||
Turnout | 32,706 | 65.9 | +15.5 | ||
Registered electors | 54,904 | ||||
Labour hold | Swing | +2.6 |
Party | Candidate | Votes | % | ±% | |
---|---|---|---|---|---|
Labour | Bob Mellish | 22,875 | 73.4 | +4.8 | |
Conservative | Howard Flight | 4,294 | 13.8 | –3.1 | |
Liberal | Thomas Taylor | 2,520 | 8.1 | –2.3 | |
National Front | G Davey | 1,488 | 4.8 | +0.7 | |
Majority | 18,581 | 59.6 | +7.9 | ||
Turnout | 31,177 | 56.4 | –9.5 | ||
Registered electors | 55,254 | ||||
Labour hold | Swing | +3.9 |
Party | Candidate | Votes | % | ±% | |
---|---|---|---|---|---|
Labour | Bob Mellish | 19,338 | 63.6 | –9.8 | |
Conservative | Alexander Duma | 7,582 | 24.9 | +11.2 | |
Liberal | Thomas Taylor | 2,072 | 6.8 | –1.3 | |
National Front | James Sneath | 1,175 | 3.9 | –0.9 | |
Workers Revolutionary | Anthony Moore | 239 | 0.8 | New | |
Majority | 11,756 | 38.7 | −20.9 | ||
Turnout | 30,406 | 59.3 | +2.9 | ||
Registered electors | 51,246 | ||||
Labour hold | Swing | –10.5 |
Party | Candidate | Votes | % | ±% | |
---|---|---|---|---|---|
Liberal | Simon Hughes | 17,017 | 57.7 | +50.9 | |
Labour | Peter Tatchell | 7,698 | 26.1 | −37.5 | |
Real Bermondsey Labour | John O'Grady | 2,243 | 7.6 | New | |
Conservative | Robert Hughes | 1,631 | 5.5 | −19.4 | |
National Front | James Sneath | 426 | 1.4 | −2.4 | |
Monster Raving Loony | David Sutch | 97 | 0.3 | New | |
Independent Patriot | Jane Birdwood | 69 | 0.2 | New | |
New Britain | Michael Keulemans | 62 | 0.2 | New | |
Independent Labour | Barry Giddings | 50 | 0.2 | New | |
Communist | Robert Gordon | 50 | 0.2 | New | |
Ecology | George Hannah | 45 | 0.2 | New | |
Revolutionary Communist | Fran Eden | 38 | 0.1 | New | |
National Labour Party | Ann King | 25 | 0.1 | New | |
United Democratic Party | Alan Baker | 15 | 0.1 | New | |
Anti-Common Market Free Trade Party | David Wedgwood | 15 | 0.1 | New | |
Systems Designer | Esmond Bevan | 8 | 0.0 | New | |
Majority | 9,319 | 31.6 | N/A | ||
Turnout | 29,489 | 57.7 | −1.6 | ||
Registered electors | 51,096 | ||||
Liberal gain from Labour | Swing | +44.2 |
Note: Esmond Bevan made a mistake and inserted his occupation rather than politics in the nomination paper. He was an Independent Labour candidate.