Borough result maps
 1999 results map
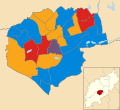 2003 results map
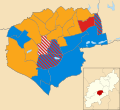 2007 results map
 2011 results map
 2015 results map
Northampton Borough Council was the local authority for Northampton in Northamptonshire, England and was elected every four years. From the last boundary changes in 1999, 47 councillors were elected from 23 wards. [1] The borough council was abolished in 2021, with the area becoming part of West Northamptonshire.
The results for each full council election from 1973 until the final election in 2015 were as follows: [2]
| Election | Party | |
|---|---|---|
| 1973 | Labour | |
| 1976 | Conservative | |
| 1979 | Conservative | |
| 1983 | No overall control Con largest single party | |
| 1987 | Conservative | |
| 1991 | No overall control | |
| 1995 | Labour | |
| 1999 | Labour | |
| 2003 | No overall control Con largest single party | |
| 2007 | Liberal Democrats | |
| 2011 | Conservative | |
| 2015 | Conservative | |


| Party | Candidate | Votes | % | ±% | |
|---|---|---|---|---|---|
| Liberal Democrats | 1,435 | 38.5 | −4.4 | ||
| Labour | 1,235 | 33.1 | −2.2 | ||
| Conservative | 1,059 | 28.4 | +6.6 | ||
| Majority | 200 | 5.4 | |||
| Turnout | 3,729 | ||||
| Liberal Democrats hold | Swing | ||||
| Party | Candidate | Votes | % | ±% | |
|---|---|---|---|---|---|
| Labour | 1,867 | 58.6 | −17.1 | ||
| Conservative | 841 | 26.4 | +10.3 | ||
| Liberal Democrats | 407 | 12.8 | +4.5 | ||
| UKIP | 71 | 2.2 | +2.2 | ||
| Majority | 1,026 | 32.2 | |||
| Turnout | 3,186 | ||||
| Labour hold | Swing | ||||
| Party | Candidate | Votes | % | ±% | |
|---|---|---|---|---|---|
| Labour | 1,662 | 46.1 | −16.4 | ||
| Conservative | 1,307 | 36.2 | +9.3 | ||
| Liberal Democrats | 640 | 17.7 | +7.0 | ||
| Majority | 355 | 9.9 | |||
| Turnout | 3,609 | ||||
| Labour hold | Swing | ||||
| Party | Candidate | Votes | % | ±% | |
|---|---|---|---|---|---|
| Labour | 551 | 65.9 | −3.5 | ||
| Liberal Democrats | 113 | 13.5 | −7.5 | ||
| Conservative | 96 | 11.5 | +1.9 | ||
| Green | 45 | 5.4 | +5.4 | ||
| Independent | 31 | 3.7 | +3.7 | ||
| Majority | 438 | 52.4 | |||
| Turnout | 836 | 16.7 | |||
| Labour hold | Swing | ||||
| Party | Candidate | Votes | % | ±% | |
|---|---|---|---|---|---|
| Liberal Democrats | Roger Conroy | 635 | 42.2 | +16.7 | |
| Labour | Alan Scott | 546 | 36.3 | −7.2 | |
| Conservative | Laura Norman | 265 | 17.6 | −13.4 | |
| Green | Marcus Rock | 33 | 2.2 | +2.2 | |
| CPA | Antony Solomon | 25 | 1.7 | +1.7 | |
| Majority | 89 | 5.9 | |||
| Turnout | 1,504 | 28.5 | |||
| Liberal Democrats gain from Labour | Swing | ||||
| Party | Candidate | Votes | % | ±% | |
|---|---|---|---|---|---|
| Conservative | Matthew Golby | 1,072 | 53.0 | +9.7 | |
| Labour | Geoff Howes | 322 | 15.9 | −1.3 | |
| Independent | David Huffadine-Smith | 320 | 15.8 | −3.8 | |
| Liberal Democrats | Marion Allen-Minney | 307 | 15.2 | +7.0 | |
| Majority | 750 | 37.1 | |||
| Turnout | 2,021 | 32.2 | |||
| Conservative hold | Swing | ||||
| Party | Candidate | Votes | % | ±% | |
|---|---|---|---|---|---|
| Liberal Democrats | Brian Markham | 583 | 49.7 | +36.4 | |
| Conservative | Gregory Lunn | 319 | 27.2 | −28.7 | |
| Labour | Toby Birch | 270 | 23.0 | −7.6 | |
| Majority | 264 | 23.4 | |||
| Turnout | 1127 | 33 | |||
| Liberal Democrats gain from Conservative | Swing | ||||
| Party | Candidate | Votes | % | ±% | |
|---|---|---|---|---|---|
| Labour | Paul Joyce | 493 | 50.5 | +13.5 | |
| Conservative | Pauline Woodhouse | 288 | 29.5 | −4.1 | |
| Liberal Democrats | Martin Sawyer | 195 | 20.0 | +16.7 | |
| Majority | 205 | 20.9 | |||
| Turnout | 980 | 27 | |||
| Labour hold | Swing | ||||
| Party | Candidate | Votes | % | ±% | |
|---|---|---|---|---|---|
| Conservative | Luke Graystone | 803 | 52.5 | +11.7 | |
| Labour | Nikesh Jani | 343 | 22.4 | +7.6 | |
| Liberal Democrats | Brian Hoare | 293 | 19.2 | +9.0 | |
| Green | Denise Donaldson | 91 | 5.9 | +5.9 | |
| Majority | |||||
| Turnout | 1530 | 18.2 | |||
| Conservative hold | Swing | ||||
| Party | Candidate | Votes | % | ±% | |
|---|---|---|---|---|---|
| Labour | Emma Roberts | 914 | 43.4 | +15.6 | |
| Conservative | Daniel Soan | 549 | 26.0 | +1.3 | |
| Independent | Nicola McKenna | 417 | 19.8 | +19.8 | |
| Liberal Democrats | Michael Maher | 133 | 6.3 | −10.4 | |
| Green | Denise Donaldson | 95 | 4.5 | +4.5 | |
| Majority | 365 | 17.3 | |||
| Turnout | 2,108 | ||||
| Labour hold | Swing | ||||