The 2008 Denbighshire County Council election took place in Denbighshire, Wales, on 1 May 2008 to elect members of Denbighshire Council. [1] This was the same day as other 2008 United Kingdom local elections. The previous elections took place in 2004 and the next all-council elections took place in 2012.
Six months before the election, the Independent council leader, Rhiannon Hughes, and her entire cabinet had been voted out of their positions, following the release of a critical schools report. [2]
Contests in May 2008 took place in all of the 30 electoral wards.
The Conservatives became the largest group on the council after taking new seats, largely from Independent councillors. [1]
Party | Seats | Gains | Losses | Net gain/loss | Seats % | Votes % | Votes | +/− | |
---|---|---|---|---|---|---|---|---|---|
Conservative | 18 | 11 | +11 | 38.2 | 29.0 | 10,053 | +11.5 | ||
Independent | 13 | 1 | 8 | -7 | 27.6 | 31.8 | 11,023 | -5.0 | |
Plaid Cymru | 8 | 1 | +1 | 17.0 | 15.1 | 5,237 | -0.6 | ||
Labour | 7 | 1 | -1 | 14.9 | 16.0 | 5,548 | -3.8 | ||
Liberal Democrats | 1 | 1 | 2 | -1 | 2.1 | 7.2 | 2,479 | -0.3 | |
DAW | 0 | 3 | -3 | 0.0 | N/A | 0 | -2.7 | ||
UKIP | 0 | 0 | 0.0 | 0.5 | 162 | New | |||
BNP | 0 | 0 | 0 | 0 | 0.0 | 0.4 | 138 | New |
Party | Candidate | Votes | % | ±% | |
---|---|---|---|---|---|
Independent | Elizabeth Jones * | 246 | 45.6 | ||
Conservative | Nan Jones | 190 | 35.2 | ||
Independent | James Warner | 104 | 19.3 | ||
Majority | 56 | ||||
Turnout | 33.5 | ||||
Registered electors | 1,628 | ||||
Independent hold | Swing | ||||
Party | Candidate | Votes | % | ±% | |
---|---|---|---|---|---|
Plaid Cymru | Huw Jones | 531 | 55.2 | ||
Independent | Nigel Roberts * | 311 | 32.3 | ||
Conservative | John Broughton | 77 | 8.0 | ||
Independent | Anthony Dilworth | 43 | 4.5 | ||
Majority | 220 | ||||
Turnout | 51.2 | ||||
Registered electors | 1,883 | ||||
Plaid Cymru gain from Independent | Swing | ||||
Party | Candidate | Votes | % | ±% | |
---|---|---|---|---|---|
Plaid Cymru | Gwyneth Kensler * | 256 | 45.0 | ||
Independent | Peter Glynn | 141 | 24.8 | ||
Labour | Graham Maudsley | 77 | 13.5 | ||
Independent | Robert Parkes | 62 | 10.9 | ||
Liberal Democrats | Mary Young | 33 | 5.8 | ||
Majority | 115 | ||||
Turnout | 40.8 | ||||
Registered electors | 1,410 | ||||
Plaid Cymru hold | Swing | ||||
Party | Candidate | Votes | % | ±% | |
---|---|---|---|---|---|
Independent | John Bartley * | 993 | 41.6 | ||
Plaid Cymru | Neville Jones * | 664 | 27.8 | ||
Conservative | Dilwyn Edwards | 471 | 19.7 | ||
Labour | Robert Roberts | 261 | 10.9 | ||
Majority | 193 | ||||
Turnout | 41.8 | ||||
Registered electors | 3,430 | ||||
Independent hold | Swing | ||||
Plaid Cymru hold | Swing | ||||
Party | Candidate | Votes | % | ±% | |
---|---|---|---|---|---|
Labour | Colin Hughes * | 266 | 26.8 | ||
Conservative | Jane Yorke | 236 | 23.7 | ||
Labour | Keith Stevens | 219 | |||
Independent | Jennifer Rowley-Williams | 197 | 19.8 | ||
Plaid Cymru | Jean Gwynn | 193 | 19.4 | ||
Plaid Cymru | Philip Williams | 129 | |||
Independent | Robb Jenkins | 119 | |||
Liberal Democrats | Colin L. Hughes * | 102 | 10.3 | ||
Liberal Democrats | John Larsen | 96 | |||
Majority | 17 | ||||
Turnout | 36.5 | ||||
Registered electors | 2,484 | ||||
Labour hold | Swing | ||||
Conservative gain from Liberal Democrats | Swing | ||||
Party | Candidate | Votes | % | ±% | |
---|---|---|---|---|---|
Conservative | Peter Owen * | 327 | 46.1 | ||
Independent | Hugh Hughes | 181 | 25.5 | ||
Labour | Richard Gumm | 87 | 12.3 | ||
Liberal Democrats | Kenneth Prydderch | 58 | 8.2 | ||
Plaid Cymru | Arwel Roberts | 56 | 7.9 | ||
Majority | 146 | ||||
Turnout | 38.0 | ||||
Registered electors | 1,881 | ||||
Conservative gain from Independent | Swing | ||||
Peter Owen was previously elected as an Independent, in 2004.
Party | Candidate | Votes | % | ±% | |
---|---|---|---|---|---|
Plaid Cymru | Eryl Williams * | 397 | 54.9 | ||
Independent | John Price | 326 | 45.1 | ||
Majority | 71 | ||||
Turnout | 55.9 | ||||
Registered electors | 1,303 | ||||
Plaid Cymru hold | Swing | ||||
Party | Candidate | Votes | % | ±% | |
---|---|---|---|---|---|
Independent | Christine Evans | 514 | 47.5 | ||
Liberal Democrats | Robert Barton * | 285 | 26.3 | ||
Conservative | Donald Holder | 283 | 26.2 | ||
Majority | 229 | ||||
Turnout | 57.1 | ||||
Registered electors | 1,908 | ||||
Independent gain from Liberal Democrats | Swing | ||||
Party | Candidate | Votes | % | ±% | |
---|---|---|---|---|---|
Conservative | Pauline Dobb | 297 | 43.8 | ||
Independent | Huw Williams | 258 | 38.1 | ||
Independent | Gwynfor Evans | 87 | 12.8 | ||
Labour | Mary Chaffé | 36 | 5.3 | ||
Majority | 39 | ||||
Turnout | 56.1 | ||||
Registered electors | 1,209 | ||||
Conservative hold | Swing | ||||
Party | Candidate | Votes | % | ±% | |
---|---|---|---|---|---|
Plaid Cymru | Cefyn Williams * | 405 | 78.3 | ||
Independent | David Robinson | 93 | 18.0 | ||
Conservative | Richard Wishart | 19 | 3.7 | ||
Majority | 312 | ||||
Turnout | 54.6 | ||||
Registered electors | 962 | ||||
Plaid Cymru hold | Swing | ||||
Party | Candidate | Votes | % | ±% | |
---|---|---|---|---|---|
Independent | Gwilym Evans * | 469 | 56.5 | ||
Liberal Democrats | Mark Young | 361 | 43.5 | ||
Majority | 108 | ||||
Turnout | 49.6 | ||||
Registered electors | 1,678 | ||||
Independent hold | Swing | ||||
Party | Candidate | Votes | % | ±% | |
---|---|---|---|---|---|
Independent | Hugh Evans * | 690 | 69.9 | ||
Independent | Dewi Jones | 297 | 30.1 | ||
Majority | 393 | ||||
Turnout | 53.6 | ||||
Registered electors | 1,846 | ||||
Independent hold | Swing | ||||
Party | Candidate | Votes | % | ±% | |
---|---|---|---|---|---|
Plaid Cymru | Trefor Hughes * | 671 | 33.8 | ||
Independent | Lucy Morris | 613 | 30.9 | ||
Independent | Stuart Davies * | 491 | |||
Conservative | Mark Pendlebury | 383 | 19.3 | ||
Labour | John Palmer | 319 | 16.1 | ||
Plaid Cymru | Jonathan Haddy | 154 | |||
Independent | Janet Wakefield | 129 | |||
Majority | 32 | ||||
Turnout | 46.6 | ||||
Registered electors | 3,342 | ||||
Plaid Cymru hold | Swing | ||||
Independent gain from Independent | Swing | ||||
Party | Candidate | Votes | % | ±% | |
---|---|---|---|---|---|
Independent | Paul Marfleet * | 455 | 56.5 | ||
Plaid Cymru | Huw Williams | 351 | 43.5 | ||
Majority | 104 | ||||
Turnout | 53.1 | ||||
Registered electors | 1,523 | ||||
Independent hold | Swing | ||||
Party | Candidate | Votes | % | ±% | |
---|---|---|---|---|---|
Independent | Peter Duffy * | 564 | 39.9 | ||
Conservative | June Cahill | 504 | 35.6 | ||
Independent | Neville Jones * | 450 | |||
Conservative | Margaret Horobin | 442 | |||
Labour | Robert Kelly | 180 | 12.7 | ||
Liberal Democrats | Paul Penlington | 167 | 11.8 | ||
Independent | Colin Hall | 124 | |||
Majority | 54 | ||||
Turnout | 48.7 | ||||
Registered electors | 2,736 | ||||
Independent hold | Swing | ||||
Conservative gain from Independent | Swing | ||||
Party | Candidate | Votes | % | ±% | |
---|---|---|---|---|---|
Conservative | James Davies * | 847 | 72.6 | ||
Conservative | Julian Thompson-Hill * | 739 | |||
Labour | Alan Marsden | 320 | 27.4 | ||
Majority | 419 | ||||
Turnout | 39.1 | ||||
Registered electors | 3,100 | ||||
Conservative hold | Swing | ||||
Party | Candidate | Votes | % | ±% | |
---|---|---|---|---|---|
Independent | Rhiannon Hughes * | 307 | 44.7 | ||
Conservative | Gerald Frobisher | 210 | 30.6 | ||
Labour | Peter Newell | 154 | 22.4 | ||
Liberal Democrats | Peter Newell | 16 | 2.3 | ||
Majority | 97 | ||||
Turnout | 44.7 | ||||
Registered electors | 1,552 | ||||
Independent hold | Swing | ||||
Party | Candidate | Votes | % | ±% | |
---|---|---|---|---|---|
Conservative | George Green | 741 | 40.7 | ||
Conservative | Allan Pennington | 709 | |||
Conservative | Michael Eckersley | 696 | |||
Independent | Michael German * | 684 | 37.6 | ||
Independent | Isobel German * | 634 | |||
Independent | David Cooper * | 476 | |||
Labour | Velma Wilshaw-Cryer | 396 | 21.7 | ||
Labour | Patricia Dawson | 391 | |||
Labour | Amanda Wiggan | 366 | |||
Majority | 12 | ||||
Turnout | 39.1 | ||||
Registered electors | 4,695 | ||||
Conservative gain from DAW | Swing | ||||
In 2008 the DAW councillors stood as Independents
Party | Candidate | Votes | % | ±% | |
---|---|---|---|---|---|
Conservative | Glyn Jones * | 559 | 46.0 | ||
Conservative | Sharon Frobisher * | 524 | |||
Labour | Paul Roberts | 425 | 35.0 | ||
Labour | Adrian West | 385 | |||
Liberal Democrats | Jonathon Bentley | 232 | 19.1 | ||
Majority | 99 | ||||
Turnout | 41.8 | ||||
Registered electors | 2,820 | ||||
Conservative hold | Swing | ||||
Party | Candidate | Votes | % | ±% | |
---|---|---|---|---|---|
Conservative | Janet Davies | 671 | 47.0 | ||
Independent | Selwyn Thomas * | 497 | 34.8 | ||
Independent | Gareth Rowlands * | 422 | |||
Independent | Stephen Rafferty | 325 | |||
Conservative | Melanie Jones | 318 | |||
Labour | George Williams | 261 | 18.3 | ||
Majority | 75 | ||||
Turnout | 49.4 | ||||
Registered electors | 2,915 | ||||
Conservative gain from Independent | Swing | ||||
Independent hold | Swing | ||||
Party | Candidate | Votes | % | ±% | |
---|---|---|---|---|---|
Conservative | John Bellis | 756 | 49.6 | +49.6 | |
Conservative | Diana Hannam * | 581 | |||
Labour | Margaret McCarroll | 410 | 26.9 | -16.9 | |
Independent | Susan Roberts * | 358 | 23.5 | -32.7 | |
Labour | William Tasker | 353 | |||
Majority | 171 | ||||
Turnout | 40.0 | ||||
Registered electors | 3,721 | ||||
Conservative gain from Independent | Swing | ||||
Councillor Hannam was previously elected as an Independent.
Party | Candidate | Votes | % | ±% | |
---|---|---|---|---|---|
Conservative | David Lee | 674 | 45.1 | +19.8 | |
Labour | Jeanette Chamberlain-Jones * | 574 | 38.4 | +4.4 | |
Conservative | Lynette Edwards | 568 | |||
Labour | Brian Moylan | 386 | |||
Plaid Cymru | Alun Edwards | 248 | 16.6 | -1.4 | |
Majority | 6 | ||||
Turnout | 43.8 | ||||
Registered electors | 3,083 | ||||
Conservative hold | Swing | ||||
Labour hold | Swing | ||||
Party | Candidate | Votes | % | ±% | |
---|---|---|---|---|---|
Conservative | Ian Gunning | 826 | 38.7 | +38.7 | |
Labour | Brian Blakeley * | 823 | 38.6 | -12.4 | |
Conservative | Carl Davies | 766 | |||
Labour | Glyn Pickering * | 746 | |||
Conservative | Paul Sumner | 714 | |||
Labour | Barry Mellor | 673 | |||
Plaid Cymru | Stephen Marlor | 247 | 11.6 | +11.6 | |
Independent | Hugh Jones * | 238 | 11.2 | -37.8 | |
Independent | Martin Gibson | 121 | |||
Majority | 20 | ||||
Turnout | 33.8 | ||||
Registered electors | 5,935 | ||||
Conservative gain from Labour | Swing | ||||
Labour hold | Swing | ||||
Conservative gain from Independent | Swing | ||||
Party | Candidate | Votes | % | ±% | |
---|---|---|---|---|---|
Labour | David Thomas * | 587 | 59.2 | -4.9 | |
Labour | Glyn Williams * | 532 | |||
Conservative | Christopher Geddes | 267 | 26.9 | +26.9 | |
Conservative | Maria Espley | 266 | |||
BNP | Ian Si'ree | 138 | 13.9 | +13.9 | |
Majority | 265 | ||||
Turnout | 29.9 | ||||
Registered electors | 3,560 | ||||
Labour hold | Swing | ||||
Party | Candidate | Votes | % | ±% | |
---|---|---|---|---|---|
Labour | Joan Butterfield * | 276 | 35.6 | -23.7 | |
Labour | Ian Armstrong | 236 | |||
Independent | Colin Jones | 195 | 25.1 | -15.6 | |
Independent | Mark Webster * | 188 | |||
Conservative | Michael Espley | 175 | 22.6 | +22.6 | |
Conservative | Linda Gordon | 163 | |||
Liberal Democrats | Columbus McCormack | 130 | 16.8 | +16.8 | |
Majority | 41 | ||||
Turnout | 23.5 | ||||
Registered electors | 3,494 | ||||
Labour hold | Swing | ||||
Mark Webster had been elected as a Labour councillor in 2004.
Party | Candidate | Votes | % | ±% | |
---|---|---|---|---|---|
Independent | David Smith | 992 | 26.1 | ||
Liberal Democrats | Robina Feeley | 978 | 25.7 | ||
Plaid Cymru | Morfudd Jones * | 887 | 23.3 | ||
Independent | Elwyn Edwards * | 861 | |||
Conservative | Richard Costain | 789 | 20.7 | ||
UKIP | Warwick Nicholson | 162 | 4.3 | ||
Majority | 26 | ||||
Turnout | 49.9 | ||||
Registered electors | 4,197 | ||||
Independent hold | Swing | ||||
Liberal Democrats gain from Independent | Swing | ||||
Plaid Cymru hold | Swing | ||||
Party | Candidate | Votes | % | ±% | |
---|---|---|---|---|---|
Conservative | Dewi Owens * | 333 | 58.3 | ||
Independent | David Roberts | 145 | 25.4 | ||
Independent | Charles Leach | 93 | 16.3 | ||
Majority | 288 | ||||
Turnout | 42.4 | ||||
Registered electors | 1,348 | ||||
Conservative hold | Swing | ||||
Party | Candidate | Votes | % | ±% | |
---|---|---|---|---|---|
Independent | William Cowie | 209 | 46.4 | ||
Independent | John Smith * | 128 | 28.4 | ||
Conservative | John Horden | 113 | 25.1 | ||
Majority | 81 | ||||
Turnout | 33.9 | ||||
Registered electors | 1,337 | ||||
Independent gain from Independent | Swing | ||||
Party | Candidate | Votes | % | ±% | |
---|---|---|---|---|---|
Plaid Cymru | Meirick Davies * | 331 | 45.2 | ||
Conservative | David Dudley | 305 | 41.7 | ||
Labour | Stephen Ellison | 96 | 13.1 | ||
Majority | 26 | ||||
Turnout | 48.4 | ||||
Registered electors | 1,525 | ||||
Plaid Cymru hold | Swing | ||||
Party | Candidate | Votes | % | ±% | |
---|---|---|---|---|---|
Independent | Barbara Smith | 309 | 47.5 | ||
Independent | Robert Williams * | 224 | 34.5 | ||
Liberal Democrats | Rhodri Jones | 117 | 18.0 | ||
Majority | 85 | ||||
Turnout | 51.1 | ||||
Registered electors | 1,280 | ||||
Independent gain from Independent | Swing | ||||
(a) Election Centre/Andrew Teale source also compares the percentage vote of the lead candidate for each party in the ward
*= sitting councillor in this ward prior to election
The City and County of Swansea Council, or simply Swansea Council, is the local authority for the city and county of Swansea, one of the principal areas of Wales. The principal area also includes rural areas to the north of the built-up area of Swansea and the Gower Peninsula to the west. The council consists of 75 councillors representing 32 electoral wards.
Denbighshire County Council is the unitary local authority for the county of Denbighshire, one of the principal areas of Wales. The council is based at County Hall in Ruthin.
The 2012 Cardiff Council election took place on Thursday 3 May 2012 to elect members of Cardiff Council in Wales. This was the same day as the national 2012 Welsh local elections. It was preceded by the 2008 election and followed by the 2017 election
The 2012 Conwy County Council election took place on 3 May 2012 to elect members of Conwy County Borough Council in Wales. It was on the same day as other 2012 United Kingdom local elections. The previous elections took place on 1 May 2008 and the next elections took place on 4 May 2017.
The 2012 Denbighshire County Council election took place in Denbighshire, Wales, on 3 May 2012 to elect members of Denbighshire Council. This was the same day as other 2012 United Kingdom local elections. The previous elections took place in 2008 and the next all-council elections took place in 2017.
The 2012 Rhondda Cynon Taf Council election took place on Thursday 3 May 2012 to elect members of Rhondda Cynon Taf County Borough Council in Wales. This was the same day as other United Kingdom local elections. It was preceded by the 2008 election and the next full council election took place on 4 May 2017.
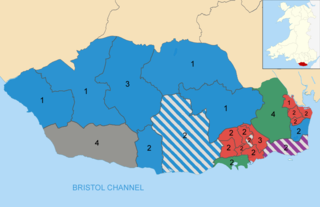
The 2012 Vale of Glamorgan Council election took place on Thursday 3 May 2012 to elect members of Vale of Glamorgan Council in Wales. This was the same day as other United Kingdom local elections. The previous full council election took place on 1 May 2008 and the next one took place on 4 May 2017.
The fifth election to the Carmarthenshire County Council was held on 1 May 2012. It was preceded by the 2008 election and was followed by the 2017 election. Plaid Cymru won 28 seats whilst Labour and the Independents won 23 each. The main feature of the election was a Labour recovery in the Llanelli area, and to some extent in the Gwendraeth and Ammanford area also, mainly at the expense of Independent candidates. Plaid Cymru lost ground to Labour in the Llanelli area but gained seats elsewhere, becoming the largest party. An Independent-Labour coalition was again formed, but with Labour as the leading partner. As a result, Kevin Madge replaced Meryl Gravell as the leader of the council.
The 2017 Welsh local elections were held on 4 May 2017 to elect members of all 22 local authorities in Wales. This included the Isle of Anglesey, which was previously up for election in 2013 due to having its elections delayed for a year. Community council elections also took place on the same day. These local elections were held as part of the 2017 local elections in the United Kingdom. Apart from Anglesey, the last elections were held in 2012. Normally these elections take place every four years, but the 2017 elections were postponed for a year in order to avoid clashing with the 2016 Welsh Assembly election, which itself had been postponed by a year to avoid clashing with the 2015 general election.
The 2012 Wrexham County Borough Council election took place on 3 May 2012 to elect members of Wrexham County Borough Council in Wales. This was on the same day as other 2012 United Kingdom local elections. The previous all-council elections took place in 2008 and the next elections took place in May 2017.
St Athan is the name of the electoral ward, coterminous with the community of St Athan, Vale of Glamorgan, Wales. It elects one county councillor to the Vale of Glamorgan Council.
The 2008 Isle of Anglesey County Council election took place on Thursday 1 May 2008 to elect members of the Isle of Anglesey County Council in Wales. This was the same day as other United Kingdom local elections. The previous full council election was on 10 June 2004 and the next full council election was held on 2 May 2013.
Prestatyn North is the name of one of the electoral wards of the town of Prestatyn, Denbighshire, Wales. It covers the northwest part of the town, either side of Victoria Road close to the beach. Prestatyn East ward lies to the east, while Rhyl East lies to the west.
The 2017 Isle of Anglesey County Council election, to the Isle of Anglesey County Council was held on 4 May 2017 as part of the 2017 United Kingdom local elections. All 30 council seats were up for election. The previous full election took place in 2013 and the following one in 2022.
The 2017 Denbighshire County Council election took place in Denbighshire, Wales, on 4 May 2017 to elect members of Denbighshire Council. This was the same day as other 2017 United Kingdom local elections. The previous elections took place in 2012 and the next all-council elections took place in 2022.
The 2017 Wrexham County Borough Council election took place on 4 May 2017 to elect members of Wrexham County Borough Council in Wales. This was on the same day as other 2017 United Kingdom local elections. The previous all-council election took place in May 2012.
The 2017 Merthyr Tydfil County Borough Council election took place on Thursday 4 May 2017 to elect the 33 members of Merthyr Tydfil County Borough Council in Wales. This was on the same day as other 2017 United Kingdom local elections. The Council shifted back from Labour to Independent control.
The 2022 Vale of Glamorgan Council election took place as of 5 May 2022 to elect 54 members across 24 wards to Vale of Glamorgan Council. On the same day, elections were held to the other 21 local authorities and to community councils in Wales as part of the 2022 Welsh local elections. The previous Vale of Glamorgan all-council election took place in May 2017 and future elections will take place every five years.
The 2022 election to Denbighshire County Council took place on 5 May 2022 as part of the 2022 Welsh local elections. The previous elections took place in May 2017 and the next are scheduled to happen in 2027
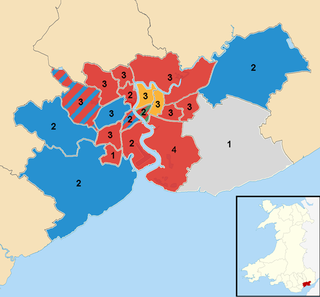
2004 Elections to Newport City Council were held on 10 June 2004 along with elections to the other 21 local authorities and community councils in Wales, as well as elections in the remainder of the United Kingdom. It was the first full election in Newport since it was awarded city status in 2002.