The 2012 Denbighshire County Council election took place in Denbighshire, Wales, on 3 May 2012 to elect members of Denbighshire Council. [1] This was the same day as other 2012 United Kingdom local elections. The previous elections took place in 2008 and the next all-council elections took place in 2017.
Labour Party and Independent candidates were hoping to take seats from the governing Conservatives. Topical issues included the county's Local Development Plan and redevelopment of Rhyl's seafront, as well as the usual funding pressures and unemployment. [2] Four of the 30 electoral wards were uncontested, while in the Ruthin ward there were 12 candidates competing for the 3 seats. [2]
The 39.1% turnout was even lower than the turnout in 2008 (42%), despite the weather being sunny. It was particularly low in areas of social deprivation, such as Rhyl West. [3]
Party | Seats | Gains | Losses | Net gain/loss | Seats % | Votes % | Votes | +/− | |
---|---|---|---|---|---|---|---|---|---|
Labour | 19 | +12 | 40.4 | 29.2 | 8,293 | +13.2 | |||
Conservative | 8 | -10 | 17.0 | 27.2 | 7,745 | -1.8 | |||
Independent | 12 | -1 | 25.5 | 25.4 | 7,217 | -6.4 | |||
Plaid Cymru | 7 | -1 | 14.9 | 11.5 | 3,270 | -3.6 | |||
Liberal Democrats | 1 | 0 | 2.1 | 5.0 | 1,418 | -2.2 | |||
Green | 0 | 0 | 0.0 | 1.0 | 274 | New | |||
Socialist Labour | 0 | 0 | 0.0 | 0.4 | 122 | New | |||
UKIP | 0 | 0 | 0.0 | 0.3 | 85 | -0.2 | |||
BNP | - | - | - | - | - | - | - | -0.4 |
In the Prestatyn North ward, the incorrect councillor was declared the winner, due to his similar surname. Conservative councillor Allan Pennington became councillor for the ward, after 265 votes for the Labour candidate, Paul Penlington, were allocated to him. Penlington was not able to take his rightful seat until 14 February 2013, after a court case involving three High Court judges. [5]
Party | Candidate | Votes | % | ±% | |
---|---|---|---|---|---|
Independent | Elizabeth Jones * | 294 | 48.9 | ||
Labour | Stephen Ellison | 223 | 37.1 | ||
Conservative | Nan Jones | 84 | 14.0 | ||
Majority | 71 | ||||
Turnout | 37.4 | ||||
Registered electors | 1,616 | ||||
Independent hold | Swing | ||||
Party | Candidate | Votes | % | ±% | |
---|---|---|---|---|---|
Plaid Cymru | Huw Jones * | unopposed | |||
Registered electors | 1,862 | ||||
Plaid Cymru hold | Swing | ||||
Party | Candidate | Votes | % | ±% | |
---|---|---|---|---|---|
Plaid Cymru | Gwyneth Kensler * | 288 | 48.7 | ||
Independent | Peter Jones | 191 | 32.3 | ||
Independent | Robert Parkes | 87 | 14.7 | ||
Conservative | Anton Sampson | 25 | 4.2 | ||
Majority | 97 | ||||
Turnout | 37.7 | ||||
Registered electors | 1,584 | ||||
Plaid Cymru hold | Swing | ||||
Party | Candidate | Votes | % | ±% | |
---|---|---|---|---|---|
Independent | John Bartley * | 977 | 60.7 | ||
Independent | Richard Davies | 579 | |||
Independent | Mark Young | 504 | |||
Plaid Cymru | Jean Gwynn | 386 | 23.8 | ||
Independent | Keith Stevens | 204 | |||
Liberal Democrats | William Williams | 138 | 8.5 | ||
Conservative | Diane Highton | 118 | 7.3 | ||
Majority | 398 | ||||
Turnout | 45.5 | ||||
Registered electors | 3,583 | ||||
Independent hold | Swing | ||||
Independent gain from Plaid Cymru | Swing | ||||
Party | Candidate | Votes | % | ±% | |
---|---|---|---|---|---|
Labour | Colin Hughes * | 504 | 55.8 | ||
Labour | Geraint Lloyd-Williams | 392 | |||
Conservative | Diane Highton * | 246 | 27.2 | ||
UKIP | Jean Gwynn | 85 | 9.4 | ||
Liberal Democrats | William Williams | 69 | 7.6 | ||
Majority | 146 | ||||
Turnout | 34.4 | ||||
Registered electors | 2,336 | ||||
Labour hold | Swing | ||||
Labour gain from Conservative | Swing | ||||
Party | Candidate | Votes | % | ±% | |
---|---|---|---|---|---|
Conservative | Peter Owen * | 369 | 50.7 | ||
Labour | Peter Newell | 275 | 37.8 | ||
Liberal Democrats | Heather Prydderch | 84 | 11.5 | ||
Majority | 94 | ||||
Turnout | 39.2 | ||||
Registered electors | 1,890 | ||||
Conservative hold | Swing | ||||
Party | Candidate | Votes | % | ±% | |
---|---|---|---|---|---|
Plaid Cymru | Eryl Williams * | unopposed | |||
Registered electors | 1,306 | ||||
Plaid Cymru hold | Swing | ||||
Party | Candidate | Votes | % | ±% | |
---|---|---|---|---|---|
Conservative | Martyn Holland | 523 | 50.2 | ||
Independent | Peter Rees | 281 | 27.0 | ||
Socialist Labour | Robert English | 122 | 11.7 | ||
Independent | Robert Barton | 115 | 11.0 | ||
Majority | 242 | ||||
Turnout | 53.6 | ||||
Registered electors | 1,968 | ||||
Conservative gain from Independent | Swing | ||||
Party | Candidate | Votes | % | ±% | |
---|---|---|---|---|---|
Conservative | Huw Williams | 348 | 60.3 | ||
Independent | Julie Masters | 129 | 22.4 | ||
Labour | Mary Chaffé | 100 | 17.3 | ||
Majority | 219 | ||||
Turnout | 47.2 | ||||
Registered electors | 1,226 | ||||
Conservative hold | Swing | ||||
Party | Candidate | Votes | % | ±% | |
---|---|---|---|---|---|
Plaid Cymru | Cefyn Williams * | unopposed | |||
Registered electors | 941 | ||||
Plaid Cymru hold | Swing | ||||
Party | Candidate | Votes | % | ±% | |
---|---|---|---|---|---|
Independent | Thomas Parry | 377 | 50.1 | ||
Independent | Christopher Denman | 192 | 25.5 | ||
Labour | John McGuire | 85 | 11.3 | ||
Plaid Cymru | John McCabe | 73 | 9.7 | ||
Liberal Democrats | Robin Hill | 25 | 3.3 | ||
Majority | 185 | ||||
Turnout | 44.6 | ||||
Registered electors | 1,694 | ||||
Independent hold | Swing | ||||
Party | Candidate | Votes | % | ±% | |
---|---|---|---|---|---|
Independent | Hugh Evans * | unopposed | |||
Registered electors | 1,816 | ||||
Independent hold | Swing | ||||
Party | Candidate | Votes | % | ±% | |
---|---|---|---|---|---|
Plaid Cymru | Trefor Hughes * | 678 | 36.4 | ||
Independent | Stuart Davies | 459 | 24.7 | ||
Labour | John Palmer | 427 | 22.9 | ||
Plaid Cymru | Jonathan Haddy | 217 | |||
Independent | Michael Edwards | 212 | |||
Conservative | Paul Firth | 206 | 11.1 | ||
Green | Robert Spalding | 91 | 4.9 | ||
Majority | 32 | ||||
Turnout | 39.2 | ||||
Registered electors | 3,362 | ||||
Plaid Cymru hold | Swing | ||||
Independent hold | Swing | ||||
Party | Candidate | Votes | % | ±% | |
---|---|---|---|---|---|
Independent | Joseph Welch | 254 | 38.2 | ||
Plaid Cymru | Hefin Edwards | 219 | 32.9 | ||
Conservative | Gregory Wynne | 146 | 22.0 | ||
Green | Dominic Oakes | 46 | 6.9 | ||
Majority | 35 | ||||
Turnout | 44.0 | ||||
Registered electors | 1,524 | ||||
Independent hold | Swing | ||||
Party | Candidate | Votes | % | ±% | |
---|---|---|---|---|---|
Labour | Peter Duffy * | 611 | 47.9 | ||
Conservative | Hugh Irvine | 578 | 45.3 | ||
Labour | Sherayne Edwards | 551 | |||
Conservative | June Cahill * | 487 | |||
Green | Kay Roney | 87 | 6.8 | ||
Majority | 27 | ||||
Turnout | 44.5 | ||||
Registered electors | 2,822 | ||||
Labour gain from Independent | Swing | ||||
Conservative hold | Swing | ||||
Party | Candidate | Votes | % | ±% | |
---|---|---|---|---|---|
Conservative | James Davies * | 524 | 41.6 | ||
Conservative | Julian Thompson-Hill * | 463 | |||
Labour | Caroline Holliday | 364 | 28.9 | ||
Labour | Kenneth Wells | 341 | |||
Independent | Julie Peters | 322 | 25.6 | ||
Independent | Leanne Knapp | 300 | |||
Green | John Roney | 50 | 4.0 | ||
Majority | 99 | ||||
Turnout | 39.2 | ||||
Registered electors | 3,220 | ||||
Conservative hold | Swing | ||||
Party | Candidate | Votes | % | ±% | |
---|---|---|---|---|---|
Independent | Peter Evans | 264 | 44.2 | ||
Conservative | Gerald Frobisher | 174 | 29.1 | ||
Labour | Robert Paterson | 159 | 26.6 | ||
Majority | 90 | ||||
Turnout | 39.1 | ||||
Registered electors | 1,549 | ||||
Independent hold | Swing | ||||
Party | Candidate | Votes | % | ±% | |
---|---|---|---|---|---|
Labour | Carys Guy-Davies | 633 | 41.3 | ||
Labour | Paul Penlington b | 606 | |||
Labour | Jason McLellan | 598 | |||
Independent | Michael German | 557 | 36.4 | ||
Independent | Isobel German | 538 | |||
Independent | George Flynn | 472 | |||
Independent | Gwynn Clague | 438 | |||
Conservative | Allan Pennington b * | 341 | 22.3 | ||
Conservative | Michael Eckersley * | 325 | |||
Conservative | Michelle Pope | 314 | |||
Majority | 41 | ||||
Turnout | 39.9 | ||||
Registered electors | 4,717 | ||||
Labour gain from Conservative | Swing | ||||
Party | Candidate | Votes | % | ±% | |
---|---|---|---|---|---|
Labour | Robert Murray | 586 | 57.0 | ||
Labour | Gareth Sandilands | 562 | |||
Conservative | Glyn Jones * | 442 | 43.0 | ||
Conservative | Sharon Frobisher * | 424 | |||
Majority | 120 | ||||
Turnout | 37.9 | ||||
Registered electors | 2,856 | ||||
Labour gain from Conservative | Swing | ||||
Party | Candidate | Votes | % | ±% | |
---|---|---|---|---|---|
Conservative | Janet Davies * | 665 | 43.3 | ||
Plaid Cymru | Arwel Roberts | 419 | 27.3 | ||
Independent | John Jones | 382 | 24.9 | ||
Conservative | Nathan Lamb | 222 | |||
Independent | William Jones | 221 | |||
Liberal Democrats | Kenneth Prydderch | 71 | 4.6 | ||
Majority | 37 | ||||
Turnout | 41.9 | ||||
Registered electors | 2,936 | ||||
Conservative hold | Swing | ||||
Plaid Cymru gain from Independent | Swing | ||||
Party | Candidate | Votes | % | ±% | |
---|---|---|---|---|---|
Labour | Barry Mellor | 667 | 47.7 | ||
Labour | David Simmons | 562 | |||
Conservative | John Bellis * | 464 | 33.2 | ||
Conservative | Diana Hannam * | 362 | |||
Independent | Hugh Jones | 267 | 19.1 | ||
Majority | 98 | ||||
Turnout | 35.0 | ||||
Registered electors | 3,796 | ||||
Labour gain from Conservative | Swing | ||||
Party | Candidate | Votes | % | ±% | |
---|---|---|---|---|---|
Labour | Jeanette Chamberlain-Jones * | 733 | 56.3 | ||
Labour | Cheryl Williams | 508 | |||
Conservative | David Lee * | 361 | 27.7 | ||
Conservative | Melanie Jones | 337 | |||
Plaid Cymru | Alun Edwards | 208 | 16.0 | ||
Majority | 98 | ||||
Turnout | 39.5 | ||||
Registered electors | 3,022 | ||||
Labour hold | Swing | ||||
Labour gain from Conservative | Swing | ||||
Party | Candidate | Votes | % | ±% | |
---|---|---|---|---|---|
Labour | Brian Blakeley * | 1,180 | 56.1 | ||
Labour | Winifred Mullen-James | 984 | |||
Labour | William Tasker | 972 | |||
Conservative | Ian Gunning * | 641 | 30.5 | ||
Conservative | Peter Jackson | 506 | |||
Conservative | Anthony Thomas | 452 | |||
Independent | Daniel Murray | 284 | 13.5 | ||
Majority | 331 | ||||
Turnout | 34.2 | ||||
Registered electors | 6,025 | ||||
Labour hold | Swing | ||||
Labour gain from Conservative | Swing | ||||
Party | Candidate | Votes | % | ±% | |
---|---|---|---|---|---|
Labour | Patricia Jones | 797 | 68.2 | ||
Labour | Margaret McCarrol | 647 | |||
Independent | David Thomas * | 184 | 15.8 | ||
Independent | Glyn Williams * | 141 | |||
Conservative | Harold Bennett | 116 | 9.9 | ||
Conservative | William Dawson | 96 | |||
Liberal Democrats | David Dear | 71 | 6.1 | ||
Majority | 463 | ||||
Turnout | 30.8 | ||||
Registered electors | 3,725 | ||||
Labour hold | Swing | ||||
Previous Labour councillors stood as Independents.
Party | Candidate | Votes | % | ±% | |
---|---|---|---|---|---|
Labour | Joan Butterfield * | 378 | 50.3 | ||
Labour | Ian Armstrong * | 361 | |||
Independent | David Thomas | 142 | 18.9 | ||
Plaid Cymru | Norman Shone | 125 | 16.6 | ||
Conservative | Michael Espley | 106 | 14.1 | ||
Conservative | Paul Sumner | 99 | |||
Majority | 219 | ||||
Turnout | 20.0 | ||||
Registered electors | 3,510 | ||||
Labour hold | Swing | ||||
Party | Candidate | Votes | % | ±% | |
---|---|---|---|---|---|
Independent | Huw Hilditch-Roberts | 805 | 27.4 | ||
Liberal Democrats | Robina Feeley * | 804 | 27.4 | ||
Independent | David Smith * | 634 | |||
Plaid Cymru | Hywel Richards | 510 | 17.4 | ||
Labour | Alun Pugh | 473 | 16.1 | ||
Independent | Patricia Astbury | 426 | |||
Plaid Cymru | Peter Ryder | 346 | |||
Conservative | Carole Roberts | 342 | 11.7 | ||
Independent | Richard Thomas | 271 | |||
Independent | Roger Parry | 268 | |||
Plaid Cymru | Shane Brennan | 256 | |||
Conservative | Joan Benton | 178 | |||
Conservative | John Broughton | 119 | |||
Majority | 124 | ||||
Turnout | 49.9 | ||||
Registered electors | 4,366 | ||||
Independent gain from Plaid Cymru | Swing | ||||
Liberal Democrats hold | Swing | ||||
Independent hold | Swing | ||||
Party | Candidate | Votes | % | ±% | |
---|---|---|---|---|---|
Conservative | Dewi Owens * | 252 | 45.2 | ||
Independent | John Smith | 160 | 28.7 | ||
Liberal Democrats | Linda Linaker | 146 | 26.2 | ||
Majority | 92 | ||||
Turnout | 40.0 | ||||
Registered electors | 1,400 | ||||
Conservative hold | Swing | ||||
Party | Candidate | Votes | % | ±% | |
---|---|---|---|---|---|
Independent | William Cowie * | 181 | 46.8 | ||
Labour | Richard Gumm | 98 | 25.3 | ||
Conservative | John Horden | 98 | 25.3 | ||
Liberal Democrats | Sean Hagan | 10 | 2.6 | ||
Majority | 83 | ||||
Turnout | 29.4 | ||||
Registered electors | 1,326 | ||||
Independent hold | Swing | ||||
Party | Candidate | Votes | % | ±% | |
---|---|---|---|---|---|
Plaid Cymru | Meirick Davies * | 364 | 53.8 | ||
Conservative | Leslie Rees | 312 | 46.2 | ||
Majority | 52 | ||||
Turnout | 43.8 | ||||
Registered electors | 1,572 | ||||
Plaid Cymru hold | Swing | ||||
Party | Candidate | Votes | % | ±% | |
---|---|---|---|---|---|
Independent | Barbara Smith * | 313 | 54.2 | ||
Conservative | Hugh Hughes | 264 | 45.8 | ||
Majority | 49 | ||||
Turnout | 44.2 | ||||
Registered electors | 1,325 | ||||
Independent hold | Swing | ||||
(a) Election Centre/Andrew Teale source also compares the percentage vote of the lead candidate for each party in the ward
(b) Prestatyn North result corrected by election petition
*= sitting ward councillor prior to election
Rhyl is a seaside town and community within the historic boundaries of Denbighshire in Wales. The town lies on the coast of North East Wales, at the mouth of the River Clwyd.
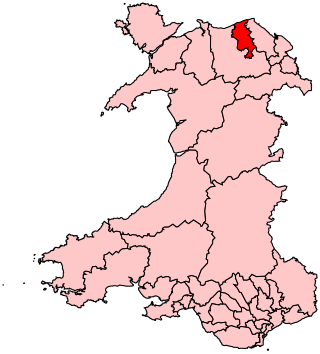
The Vale of Clwyd is a constituency of the House of Commons of the UK Parliament created in 1997 and represented since 2019 by James Davies of the Conservative Party. As with all extant seats its electorate elect one Member of Parliament (MP) by the first past the post system at least every five years.
Denbighshire County Council is the unitary local authority for the county of Denbighshire, one of the principal areas of Wales. The council is based at County Hall in Ruthin.
The 2012 City of Lincoln Council election took place on 3 May 2012 to elect one-third of the members of City of Lincoln Council in Lincolnshire, England, for a 4-year term of office. This was on the same day as other 2012 United Kingdom local elections.
The 2012 Cardiff Council election took place on Thursday 3 May 2012 to elect members of Cardiff Council in Wales. This was the same day as the national 2012 Welsh local elections. It was preceded by the 2008 election and followed by the 2017 election
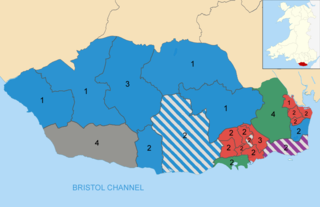
The 2012 Vale of Glamorgan Council election took place on Thursday 3 May 2012 to elect members of Vale of Glamorgan Council in Wales. This was the same day as other United Kingdom local elections. The previous full council election took place on 1 May 2008 and the next one took place on 4 May 2017.
The fifth election to the Carmarthenshire County Council was held on 1 May 2012. It was preceded by the 2008 election and was followed by the 2017 election. Plaid Cymru won 28 seats whilst Labour and the Independents won 23 each. The main feature of the election was a Labour recovery in the Llanelli area, and to some extent in the Gwendraeth and Ammanford area also, mainly at the expense of Independent candidates. Plaid Cymru lost ground to Labour in the Llanelli area but gained seats elsewhere, becoming the largest party. An Independent-Labour coalition was again formed, but with Labour as the leading partner. As a result, Kevin Madge replaced Meryl Gravell as the leader of the council.
The 2006 West Oxfordshire District Council election took place on 4 May 2006 to elect members of West Oxfordshire District Council in Oxfordshire, England. One third of the council was up for election and the Conservative Party stayed in overall control of the council.
The 2016 Exeter City Council election took place on 5 May 2016, to elect members of Exeter City Council in England. Following boundary changes, the entire council was up for election, and all 13 wards were contested, each electing three councillors. The election was held concurrently with other local elections held in England on the 5 May.
The 2017 Welsh local elections were held on 4 May 2017 to elect members of all 22 local authorities in Wales. This included the Isle of Anglesey, which was previously up for election in 2013 due to having its elections delayed for a year. Community council elections also took place on the same day. These local elections were held as part of the 2017 local elections in the United Kingdom. Apart from Anglesey, the last elections were held in 2012. Normally these elections take place every four years, but the 2017 elections were postponed for a year in order to avoid clashing with the 2016 Welsh Assembly election, which itself had been postponed by a year to avoid clashing with the 2015 general election.
The Riverside electoral ward of Cardiff covers the Riverside and Pontcanna areas of the city, electing three councillors to Cardiff Council. The ward was originally created in 1890, as a ward to Cardiff County Borough Council.
Prestatyn North is the name of one of the electoral wards of the town of Prestatyn, Denbighshire, Wales. It covers the northwest part of the town, either side of Victoria Road close to the beach. Prestatyn East ward lies to the east, while Rhyl East lies to the west.
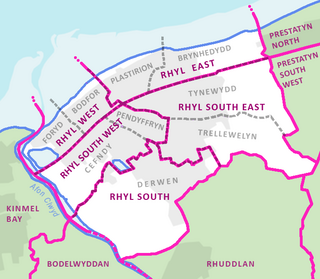
Rhyl West is the name of one of the electoral wards of the town of Rhyl, Denbighshire, Wales. It covers the northwest part of the town, including the town centre at one end and as far as Marine Lake and the Marina Quay on the western edge. Rhyl East ward lies to the east, Rhyl South West to the south and Conwy County Borough's Kinmel Bay ward to the west.
The 2017 Rhondda Cynon Taf County Borough Council election took place on Thursday 4 May 2017 to elect members of Rhondda Cynon Taf County Borough Council in Wales. This was the same day as other 2017 United Kingdom local elections. The previous full council election took place on 3 May 2012 and the next full election took place in 2022.
The 2008 Denbighshire County Council election took place in Denbighshire, Wales, on 1 May 2008 to elect members of Denbighshire Council. This was the same day as other 2008 United Kingdom local elections. The previous elections took place in 2004 and the next all-council elections took place in 2012.
The 2017 Denbighshire County Council election took place in Denbighshire, Wales, on 4 May 2017 to elect members of Denbighshire Council. This was the same day as other 2017 United Kingdom local elections. The previous elections took place in 2012 and the next all-council elections took place in 2022.
Gareth Lloyd Davies is a Welsh Conservative politician who has been Member of the Senedd (MS) for Vale of Clwyd since 2021. He is the first Conservative to win this seat since its establishment in 1999.
The 2022 Welsh local elections took place on 5 May 2022 to elect members of all twenty-two local authorities in Wales. They were held alongside other local elections in the United Kingdom. The previous elections were held in 2017.
The 2022 Wrexham County Borough Council election took place on 5 May 2022 to elect 56 members to Wrexham County Borough Council, the principal council of Wrexham County Borough, Wales. On the same day, elections were held to the other 21 local authorities, and community councils in Wales as part of the 2022 Welsh local elections. The previous Wrexham County Borough all-council election took place in May 2017 and future elections will take place every five years, with the next scheduled for 2027.
The 2022 election to Denbighshire County Council took place on 5 May 2022 as part of the 2022 Welsh local elections. The previous elections took place in May 2017 and the next are scheduled to happen in 2027