The 2012 Rhondda Cynon Taf Council election took place on Thursday 3 May 2012 to elect members of Rhondda Cynon Taf County Borough Council in Wales. This was the same day as other United Kingdom local elections. It was preceded by the 2008 election and the next full council election took place on 4 May 2017.
Labour remained in firm control of the council, after gaining an additional 16 seats. [1] [2] However, the leader of the council, Labour councillor Russell Roberts, lost his seat to an Independent candidate (in the Tonyrefail East ward) by 34 votes. [1]
Party | Seats | Gains | Losses | Net gain/loss | Seats % | Votes % | Votes | +/− | |
---|---|---|---|---|---|---|---|---|---|
Labour | 60 | +16 | 80.0 | 54.6 | 35,568 | +6.4 | |||
Plaid Cymru | 9 | -12 | 12.0 | 27.9 | 18,162 | -9.7 | |||
Independent | 4 | -1 | 5.3 | 9.3 | 6,085 | +2.4 | |||
Liberal Democrats | 1 | -3 | 1.3 | 3.6 | 2,350 | -1.7 | |||
Conservative | 1 | 0 | 1.3 | 2.6 | 1,700 | +1.8 | |||
Green | 0 | 0 | 0.0 | 0.7 | 460 | +0.1 | |||
TUSC | 0 | 0 | 0.0 | 0.5 | 298 | New | |||
Socialist Labour | 0 | 0 | 0.0 | 0.5 | 275 | New | |||
UKIP | 0 | 0 | 0.0 | 0.3 | 217 | -0.2 | |||
Communist | - | - | - | - | - | - | - | -0.1 |
Party | Candidate | Votes | % | ±% | |
---|---|---|---|---|---|
Labour | Anthony Christopher* | 900 | 69.4 | ||
Labour | Linda De Vet* | 781 | |||
Plaid Cymru | Wayne Lloyd | 396 | 30.6 | ||
Turnout | 32.9 | ||||
Labour hold | Swing | ||||
Party | Candidate | Votes | % | ±% | |
---|---|---|---|---|---|
Labour | Anita Calvert | 890 | 64.0 | ||
Labour | Tina Williams | 861 | |||
Plaid Cymru | Howard Davies* | 501 | 36.0 | ||
Plaid Cymru | Lea Dempsey | 350 | |||
Turnout | 39.6 | ||||
Labour gain from Plaid Cymru | Swing | ||||
Party | Candidate | Votes | % | ±% | |
---|---|---|---|---|---|
Labour | Alby Davies* | 903 | 45.6 | ||
Labour | Rhys Lewis | 681 | |||
Independent | Stuart Gregory* | 519 | 26.2 | ||
Plaid Cymru | Rhodri Owen | 334 | 16.9 | ||
Green | John Matthews | 161 | 8.1 | ||
Liberal Democrats | Sean Hackett | 65 | 3.3 | ||
Turnout | |||||
Labour hold | Swing | ||||
Labour gain from Independent | Swing | ||||
Party | Candidate | Votes | % | ±% | |
---|---|---|---|---|---|
Labour | Steve Bradwick* | 1,414 | 71.0 | ||
Labour | Mike Forey* | 1,269 | |||
Plaid Cymru | David Alun Walters | 578 | 29.0 | ||
Turnout | 36.3 | ||||
Labour hold | Swing | ||||
Party | Candidate | Votes | % | ±% | |
---|---|---|---|---|---|
Labour | Ann Crimmings* | 1,306 | 55.5 | ||
Labour | John Davies | 1,118 | |||
Labour | Sharon Rees | 1,095 | |||
Plaid Cymru | John Daniel* | 1049 | 44.5 | ||
Plaid Cymru | Liz Walters* | 934 | |||
Plaid Cymru | Wayne Richards | 899 | |||
Turnout | 32.7 | ||||
Labour hold | Swing | ||||
Labour gain from Plaid Cymru | Swing | ||||
Party | Candidate | Votes | % | ±% | |
---|---|---|---|---|---|
Labour | Richard Yeo | 661 | 69.5 | ||
Independent | Mike Sinclair-Thomson | 174 | 18.3 | ||
Plaid Cymru | James Radcliffe | 116 | 12.2 | ||
Turnout | 29.5 | ||||
Labour gain from Independent | Swing | ||||
Roger Turner, elected as an Independent in 2004 and 2008 stood as a Labour candidate.
Party | Candidate | Votes | % | ±% | |
---|---|---|---|---|---|
Labour | Roger Turner* | 771 | 78.4 | ||
Plaid Cymru | Mick Tems | 213 | 21.6 | ||
Turnout | 32.7 | ||||
Labour gain from Independent | Swing | ||||
Party | Candidate | Votes | % | ±% | |
---|---|---|---|---|---|
Labour | Graham Stacey* | 657 | 18.6 | ||
Plaid Cymru | Rhys Watkins | 189 | 64.7 | ||
Conservative | Christopher Norton | 169 | 16.7 | ||
Turnout | 29.0 | ||||
Labour hold | Swing | ||||
Party | Candidate | Votes | % | ±% | |
---|---|---|---|---|---|
Labour | Barrie Morgan | 354 | 48.4 | ||
Independent | Stephen Belzak | 189 | 25.8 | ||
Liberal Democrats | James Hackett | 132 | 18.0 | ||
Plaid Cymru | Stuart Fisher | 57 | 7.8 | ||
Turnout | 35.0 | ||||
Labour gain from Liberal Democrats | Swing | ||||
Party | Candidate | Votes | % | ±% | |
---|---|---|---|---|---|
Labour | Mark Norris* | 508 | 69.8 | ||
Plaid Cymru | Heidi Whitter | 220 | 30.2 | ||
Turnout | 33.6 | ||||
Labour hold | Swing | ||||
Party | Candidate | Votes | % | ±% | |
---|---|---|---|---|---|
Labour | Jeffrey Elliot* | 757 | 63.5 | ||
Plaid Cymru | Adrian Jarman | 436 | 36.5 | ||
Turnout | 35.8 | ||||
Labour hold | Swing | ||||
Party | Candidate | Votes | % | ±% | |
---|---|---|---|---|---|
Labour | Chris Williams | 989 | 69.7 | ||
Labour | Margaret Tegg* | 972 | |||
Plaid Cymru | Nicole Griffiths | 430 | 30.3 | ||
Plaid Cymru | Edwyn Parry | 331 | |||
Turnout | 34.4 | ||||
Labour hold | Swing | ||||
Party | Candidate | Votes | % | ±% | |
---|---|---|---|---|---|
Independent | Philip Howe | 952 | 49.0 | ||
Labour | Annette Davies* | 604 | 31.1 | ||
Labour | Ceri Jones* | 463 | |||
Plaid Cymru | Norma Williams | 385 | 19.8 | ||
Independent | Martin Rees | 323 | |||
Turnout | 46.8 | ||||
Labour hold | Swing | ||||
Independent gain from Labour | Swing | ||||
Party | Candidate | Votes | % | ±% | |
---|---|---|---|---|---|
Labour | Aufron Roberts | 826 | 77.3 | ||
Liberal Democrats | Gerald Francis | 213 | 19.9 | ||
Conservative | Emyr Wilkinson | 30 | 2.8 | ||
Turnout | 46.8 | ||||
Labour hold | Swing | ||||
Party | Candidate | Votes | % | ±% | |
---|---|---|---|---|---|
Labour | Doug Williams* | Unopposed | |||
Labour hold | Swing | ||||
Party | Candidate | Votes | % | ±% | |
---|---|---|---|---|---|
Labour | Joyce Cass* | 339 | 59.2 | ||
Independent | Bob Fox | 140 | 24.4 | ||
Plaid Cymru | Jennifer Hughes | 65 | 11.3 | ||
Liberal Democrats | George Summers | 21 | 3.7 | ||
TUSC | Glyn Matthews | 8 | 1.4 | ||
Turnout | 33.1 | ||||
Labour hold | Swing | ||||
Party | Candidate | Votes | % | ±% | |
---|---|---|---|---|---|
Labour | Teressa Bates* | 482 | 52.6 | ||
Plaid Cymru | Iago ap Steffan | 352 | 38.4 | ||
Liberal Democrats | Jeanette Jones | 83 | 9.1 | ||
Turnout | 32.7 | ||||
Labour hold | Swing | ||||
Party | Candidate | Votes | % | ±% | |
---|---|---|---|---|---|
Plaid Cymru | Karen Morgan* | 712 | 61.2 | ||
Labour | Jennifer Hartwell | 452 | 38.8 | ||
Turnout | 36.6 | ||||
Plaid Cymru hold | Swing | ||||
Party | Candidate | Votes | % | ±% | |
---|---|---|---|---|---|
Labour | Geraint Hopkins* | 510 | 66.1 | ||
Plaid Cymru | J. Dilworth | 262 | 33.9 | ||
Turnout | 31.0 | ||||
Labour hold | Swing | ||||
Party | Candidate | Votes | % | ±% | |
---|---|---|---|---|---|
Labour | Barry Stephens | 600 | 70.8 | ||
Plaid Cymru | Julie Dilworth | 247 | 29.2 | ||
Turnout | 31.6 | ||||
Labour gain from Plaid Cymru | Swing | ||||
Party | Candidate | Votes | % | ±% | |
---|---|---|---|---|---|
Labour | Glynne Holmes* | 940 | 69.6 | ||
Plaid Cymru | Steven Harry | 248 | 18.4 | ||
Conservative | Ann-Marie Mason | 162 | 12.0 | ||
Turnout | 35.9 | ||||
Labour hold | Swing | ||||
Party | Candidate | Votes | % | ±% | |
---|---|---|---|---|---|
Conservative | Joel James* | 630 | 37.4 | ||
Labour | Jacqui Bunnage | 535 | 31.8 | ||
Labour | Bev Channon | 481 | |||
Conservative | Alex Coombs | 421 | |||
Independent | Jools Jones | 275 | 16.3 | ||
Independent | Margaret Burtonwood* | 260 | |||
Plaid Cymru | Steven Owen | 243 | |||
Plaid Cymru | Steven Thomas | 175 | |||
Turnout | 35.0 | ||||
Conservative hold | Swing | ||||
Labour gain from Independent | Swing | ||||
Party | Candidate | Votes | % | ±% | |
---|---|---|---|---|---|
Labour | Sylvia Jones* | 357 | 63.2 | ||
Plaid Cymru | Naethan Jones | 208 | 36.8 | ||
Turnout | 33.1 | ||||
Labour hold | Swing | ||||
Party | Candidate | Votes | % | ±% | |
---|---|---|---|---|---|
Labour | Keiron Montague | 832 | 79.3 | ||
Plaid Cymru | Gerwyn Evans* | 217 | 20.7 | ||
Turnout | 44.3 | ||||
Labour gain from Plaid Cymru | Swing | ||||
Party | Candidate | Votes | % | ±% | |
---|---|---|---|---|---|
Plaid Cymru | Pauline Jarman* | 544 | 60.4 | ||
Labour | Wendy Treeby | 356 | 39.6 | ||
Turnout | 40.9 | ||||
Plaid Cymru hold | Swing | ||||
Party | Candidate | Votes | % | ±% | |
---|---|---|---|---|---|
Labour | Andrew Morgan* | 885 | 75.5 | ||
Labour | Simon Lloyd* | 770 | |||
Plaid Cymru | Danny Allen | 287 | 24.5 | ||
Plaid Cymru | Nicola Benney | 287 | |||
Turnout | |||||
Labour hold | Swing | ||||
Party | Candidate | Votes | % | ±% | |
---|---|---|---|---|---|
Labour | Adam Fox* | 1,104 | 64.5 | ||
Labour | Jane Ward* | 947 | 64.5 | ||
Plaid Cymru | Lyn Warner | 473 | 27.6 | ||
TUSC | Mia Hollsing | 135 | 7.9 | ||
Turnout | 33.9 | ||||
Labour hold | Swing | ||||
Party | Candidate | Votes | % | ±% | |
---|---|---|---|---|---|
Plaid Cymru | Shelley Rees-Owen | 867 | 51.2 | ||
Plaid Cymru | Maureen Weaver | 789 | |||
Labour | Eilane Barnett | 741 | 43.7 | ||
Labour | Kris Evans | 724 | |||
Green | Leigh Evans | 87 | 5.1 | ||
Green | Linda Evans | 82 | |||
Turnout | 43.6 | ||||
Plaid Cymru gain from Labour | Swing | ||||
Party | Candidate | Votes | % | ±% | |
---|---|---|---|---|---|
Labour | Ken Privett* | 755 | 60.2 | ||
Labour | Dennis Weeks* | 754 | 60.2 | ||
Plaid Cymru | Alison Jones | 513 | 39.8 | ||
Plaid Cymru | Mark Lewis | 421 | |||
Turnout | 32.5 | ||||
Labour hold | Swing | ||||
Party | Candidate | Votes | % | ±% | |
---|---|---|---|---|---|
Labour | Helen Boggis | 378 | 48.8 | ||
Independent | Anthony Edwards | 228 | 29.4 | ||
Plaid Cymru | Paul James | 169 | 21.8 | ||
Turnout | 36.5 | ||||
Labour hold | Swing | ||||
Party | Candidate | Votes | % | ±% | |
---|---|---|---|---|---|
Labour | Paul Griffiths | 651 | 27.3 | ||
Labour | Margaret Griffiths | 642 | |||
Independent | Brendan O'Reilly | 567 | 23.8 | ||
Plaid Cymru | Jonathan Huish* | 527 | 22.1 | ||
Plaid Cymru | Merfyn Rea* | 487 | |||
Conservative | Dan Saxton | 422 | 17.7 | ||
Independent | Ken Forsdyke | 334 | |||
Independent | Gordon Norman | 332 | |||
UKIP | David Bevan | 217 | 9.1 | ||
Turnout | 37.0 | ||||
Labour gain from Plaid Cymru | Swing | ||||
Party | Candidate | Votes | % | ±% | |
---|---|---|---|---|---|
Labour | Steve Carter | 372 | 41.4 | ||
Independent | Joe Payne | 312 | 34.7 | ||
Plaid Cymru | Richard Martin | 123 | 13.7 | ||
Liberal Democrats | Dewi Gray | 92 | 10.2 | ||
Turnout | 40.9 | ||||
Labour gain from Liberal Democrats | Swing | ||||
Party | Candidate | Votes | % | ±% | |
---|---|---|---|---|---|
Labour | Margaret Davies* | 941 | 53.5 | ||
Labour | Graham Smith | 809 | |||
Plaid Cymru | Julie Williams* | 662 | 37.7 | ||
Plaid Cymru | Alun Cox | 582 | |||
TUSC | Cliff Jones | 155 | 8.8 | ||
Turnout | 38.2 | ||||
Labour hold | Swing | ||||
Labour gain from Plaid Cymru | Swing | ||||
Party | Candidate | Votes | % | ±% | |
---|---|---|---|---|---|
Labour | Graham Thomas | 341 | 56.6 | ||
Plaid Cymru | Beverley Hall | 187 | 31.0 | ||
Independent | Colin Woodley | 75 | 12.4 | ||
Turnout | 42.6 | ||||
Labour gain from Plaid Cymru | Swing | ||||
Party | Candidate | Votes | % | ±% | |
---|---|---|---|---|---|
Labour | Tina Leyshon | 623 | 44.4 | ||
Labour | Rob Smith | 531 | |||
Independent | Graeme Beard | 434 | 31.0 | ||
Independent | Philip Price | 303 | |||
Green | Richard Reast | 176 | 12.6 | ||
Plaid Cymru | Hannah Fisher | 169 | 12.1 | ||
Independent | Ken Owen | 155 | |||
Turnout | 36.8 | ||||
Labour hold | Swing | ||||
Party | Candidate | Votes | % | ±% | |
---|---|---|---|---|---|
Labour | Maureen Webber | 714 | 79.2 | ||
Plaid Cymru | Bob Humphries | 128 | 14.2 | ||
Liberal Democrats | Lee Thacker | 59 | 6.5 | ||
Turnout | 28.3 | ||||
Labour hold | Swing | ||||
Party | Candidate | Votes | % | ±% | |
---|---|---|---|---|---|
Labour | Jill Bonetto | 589 | 62.1 | ||
Plaid Cymru | Adrian Hobson | 359 | 37.9 | ||
Turnout | 33.3 | ||||
Labour gain from Plaid Cymru | Swing | ||||
Party | Candidate | Votes | % | ±% | |
---|---|---|---|---|---|
Independent | Paul Baccara | 400 | 44.9 | ||
Labour | Jeff Woodington | 375 | 42.1 | ||
Plaid Cymru | Emyr Williams | 66 | 7.4 | ||
Conservative | Gregory Zuckerman | 49 | 5.5 | ||
Turnout | 44.8 | ||||
Independent hold | Swing | ||||
Party | Candidate | Votes | % | ±% | |
---|---|---|---|---|---|
Independent | Lyndon Walker | 645 | 34.6 | ||
Labour | John David | 593 | 31.8 | ||
Labour | Ray Butler | 536 | |||
Liberal Democrats | Karen Roberts | 282 | 15.1 | ||
Conservative | Anna Rees | 183 | 9.8 | ||
Conservative | Ian Rees | 175 | |||
Plaid Cymru | Geraint Day | 161 | 8.6 | ||
Turnout | 44.3 | ||||
Independent gain from Plaid Cymru | Swing | ||||
Labour hold | Swing | ||||
Party | Candidate | Votes | % | ±% | |
---|---|---|---|---|---|
Labour | Craig Middle | 651 | 65.4 | ||
Plaid Cymru | Tina Davies | 344 | 34.6 | ||
Turnout | 36.6 | ||||
Labour hold | Swing | ||||
Party | Candidate | Votes | % | ±% | |
---|---|---|---|---|---|
Independent | Paul Wasley | 629 | 34.1 | ||
Labour | Bob McDonald | 610 | 33.0 | ||
Labour | Russell Roberts | 576 | |||
Independent | Phil Doyle | 549 | |||
Plaid Cymru | Greg Powell | 430 | 23.3 | ||
Liberal Democrats | Hendrik Haye | 178 | 9.6 | ||
Turnout | 38.4 | ||||
Independent gain from Labour | Swing | ||||
Labour hold | Swing | ||||
Party | Candidate | Votes | % | ±% | |
---|---|---|---|---|---|
Labour | Eudine Hanagan | 792 | 53.4 | ||
Plaid Cymru | Danny Greham | 360 | 24.3 | ||
Independent | Shawn Stevens | 331 | 22.3 | ||
Turnout | 32.1 | ||||
Labour hold | Swing | ||||
Party | Candidate | Votes | % | ±% | |
---|---|---|---|---|---|
Liberal Democrats | Mike Powell | 537 | 46.4 | ||
Labour | Allen Bevan | 417 | 36.0 | ||
Independent | Adrian Dumphy | 120 | 10.4 | ||
Plaid Cymru | Tony Richards | 84 | 7.3 | ||
Turnout | 40.4 | ||||
Liberal Democrats hold | Swing | ||||
Party | Candidate | Votes | % | ±% | |
---|---|---|---|---|---|
Plaid Cymru | Rebecca Winter | 244 | 22.4 | ||
Labour | Joy Rosser | 749 | 68.8 | ||
Independent | Tina Ludlow | 95 | 8.7 | ||
Turnout | 37.0 | ||||
Labour gain from Plaid Cymru | Swing | ||||
Party | Candidate | Votes | % | ±% | |
---|---|---|---|---|---|
Labour | Steve Powderhill | 424 | 62.9 | ||
Liberal Democrats | Royston O'Reilly | 153 | 22.7 | ||
Plaid Cymru | Ceri Carter | 61 | 9.1 | ||
Green | Paul Carter | 36 | 5.3 | ||
Turnout | 17.6 | ||||
Labour gain from Liberal Democrats | Swing | ||||
Party | Candidate | Votes | % | ±% | |
---|---|---|---|---|---|
Plaid Cymru | Geraint Rhys Davies | 1081 | 56.4 | ||
Plaid Cymru | Irene Pearce | 978 | |||
Labour | Luke Bouchard | 835 | 43.6 | ||
Labour | Paul Russell | 726 | |||
Turnout | 43.2 | ||||
Plaid Cymru hold | Swing | ||||
Party | Candidate | Votes | % | ±% | |
---|---|---|---|---|---|
Plaid Cymru | Cennard Davies | 1252 | 53.3 | ||
Plaid Cymru | Sera Evans-Fear | 1247 | |||
Plaid Cymru | Emyr Webster | 1140 | |||
Labour | Graham Thomas | 1099 | 46.7 | ||
Labour | Ron Jones | 1096 | |||
Labour | Hardev Singh | 1012 | |||
Turnout | 41.3 | ||||
Plaid Cymru hold | Swing | ||||
Party | Candidate | Votes | % | ±% | |
---|---|---|---|---|---|
Labour | Robert Bevan | 1003 | 67.0 | ||
Labour | Mark Adams | 910 | |||
Socialist Labour | Craig Jones | 275 | 18.4 | ||
Plaid Cymru | Gareth Taylor | 218 | 14.6 | ||
Turnout | 38.4 | ||||
Labour hold | Swing | ||||
Party | Candidate | Votes | % | ±% | |
---|---|---|---|---|---|
Plaid Cymru | Carole Willis | 116 | 12.8 | ||
Labour | Clayton Willis | 791 | 87.2 | ||
Turnout | 35.2 | ||||
Labour hold | Swing | ||||
Party | Candidate | Votes | % | ±% | |
---|---|---|---|---|---|
Labour | Lionel Langford | 606 | 62.0 | ||
Plaid Cymru | Christian Reed | 372 | 38.0 | ||
Turnout | 39.5 | ||||
Labour hold | Swing | ||||
Party | Candidate | Votes | % | ±% | |
---|---|---|---|---|---|
Labour | Sue Pickering | 587 | 42.8 | ||
Liberal Democrats | Richard Isaac | 414 | 30.2 | ||
Plaid Cymru | Elaine Williams | 316 | 23.0 | ||
Conservative | Andrew Williams-Jones | 55 | 4.0 | ||
Turnout | 38.8 | ||||
Labour hold | Swing | ||||
Party | Candidate | Votes | % | ±% | |
---|---|---|---|---|---|
Labour | Paul Cannon | 979 | 57.9 | ||
Labour | Malcolm Watts | 804 | |||
Plaid Cymru | Larraine Jones | 591 | 34.9 | ||
Plaid Cymru | Esther Nagle | 536 | |||
Liberal Democrats | Angharad Jones | 121 | 7.2 | ||
Turnout | 37.3 | ||||
Labour hold | Swing | ||||
Rhondda was a constituency in Wales in the House of Commons of the UK Parliament. It was represented since its 1974 recreation by the Labour Party.
Ferndale is a town and community located in the Rhondda Valley in the county borough of Rhondda Cynon Taf, Wales. Neighbouring villages are Blaenllechau, Maerdy and Tylorstown. Ferndale was industrialised in the mid-19th century. The first coal mine shaft was sunk in 1857 and Ferndale was the first community to be intensively industrialised in the Rhondda Valley.
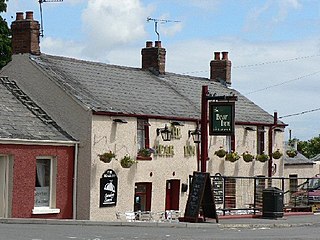
Llanharry is a village, community and electoral ward in the county borough of Rhondda Cynon Taf, Wales.
Rhondda Cynon Taf County Borough Council is the governing body for Rhondda Cynon Taf, one of the Principal Areas of Wales. The council headquarters are located in the Llys Cadwyn Development in Pontypridd.
Syd Morgan is a Welsh nationalist politician.
Aberaman is an electoral ward in Rhondda Cynon Taf, Wales. It was an electoral ward for much of the twentieth century, for the purposes of electing members to Glamorgan County Council and the Aberdare Urban District Council. The village of Aberaman was subsequently covered by two electoral wards, Aberaman North and Aberaman South, for the purposes of electing members to the Rhondda Cynon Taf County Borough Council. Aberaman North was composed mainly of Aberaman itself while Aberaman South included Abercwmboi, Cwmaman, Godreaman and Glynhafod.
The first election to Rhondda Cynon Taf County Borough Council was held on 4 May 1995. It was followed by the 1999 election. On the same day there were elections to the other 21 local authorities in Wales and community councils in Wales.
The second election to Rhondda Cynon Taf County Borough Council was held on 6 May 1999. It was preceded by the 1995 election and followed by the 2004 election. On the same day there were elections to the other 21 local authorities in Wales and community councils in Wales and the first elections to the National Assembly for Wales were held.
The third election to Rhondda Cynon Taf County Borough Council was held in June 2004. It was preceded by the 1999 election and followed by the 2008 election. On the same day there were elections to the other 21 local authorities in Wales and community councils in Wales.
Hirwaun, Penderyn and Rhigos is the northernmost electoral ward in Rhondda Cynon Taf, Wales. It covers the communities of Hirwaun and Rhigos. The ward elects two county borough councillors to the Rhondda Cynon Taf County Borough Council. It is the largest ward in Rhondda Cynon Taf.
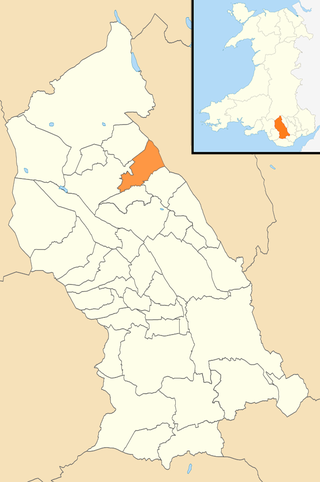
Aberdare East is a local government community and electoral ward in Rhondda Cynon Taf, Wales. The community was formed in 2016 when the former community of Aberdare was split into two. Aberdare East includes the main town of Aberdare.
The Cynon Valley Party is a political party formed in 2016 to campaign for people living in the Cynon Valley, including the towns of Aberdare and Mountain Ash, in Rhondda Cynon Taf, South Wales. The party won a council seat on Rhondda Cynon Taf County Borough Council in May 2017.
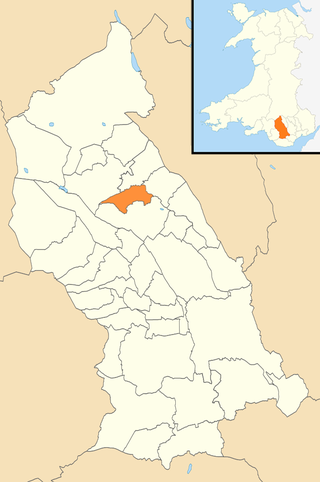
Aberaman North is a community in Rhondda Cynon Taf, Wales. It primarily includes the village of Aberaman. The community was formed in 2016 when the larger community of Aberaman was split into North and South.
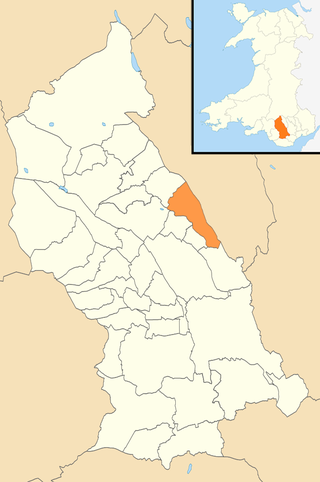
Mountain Ash East is a community and coterminous electoral ward in Rhondda Cynon Taf, Wales. It primarily includes the part of the town of Mountain Ash east of the River Cynon. The community was formed in 2016 when the larger community of Mountain Ash was divided into East and West to match the ward boundaries.
The 2017 Rhondda Cynon Taf County Borough Council election took place on Thursday 4 May 2017 to elect members of Rhondda Cynon Taf County Borough Council in Wales. This was the same day as other 2017 United Kingdom local elections. The previous full council election took place on 3 May 2012 and the next full election took place in 2022.
The 2022 Rhondda Cynon Taf County Borough election took place on 5 May 2022 to elect 54 members across 46 wards to Rhondda Cynon Taf County Borough Council. On the same day, elections were to the other 21 local authorities and to community councils in Wales as part of the 2022 Welsh local elections. The previous Rhondda Cynon Taf all-council election took place in 2017 and future elections will take place every five years.
Mountain Ash is an electoral ward in Rhondda Cynon Taf, electing two councillors to Rhondda Cynon Taf County Borough Council. It was re-created by the merger of Mountain Ash East and Mountain Ash West, following a local government boundary review, effective from 5 May 2022, the date of the 2022 Welsh local elections.
Penrhiw-ceibr is the name of an electoral ward in the Cynon Valley, Rhondda Cynon Taf, Wales. Its boundaries are coterminous with the village and community of Penrhiwceiber. The ward elects two councillors to Rhondda Cynon Taf County Borough Council.
Mountain Ash East was the name of an electoral ward in the Cynon Valley, Rhondda Cynon Taf, Wales. It elected councillors to Cynon Valley Borough Council and later Rhondda Cynon Taf County Borough Council. It merged with Mountain Ash West to form the Mountain Ash ward in 2022.
Tonyrefail East is the name of an electoral ward covering the eastern two-thirds of the community of Tonyrefail in Rhondda Cynon Taf, Wales. It elects two councillors to Rhondda Cynon Taf County Borough Council.