2012 Elections to Newport City Council were held on 3 May 2012 [1] along with elections to the other 21 local authorities in Wales, community council elections in Wales and 2012 United Kingdom local elections.
Councillors elected in this election served an extended five-year term, after local government minister Carl Sargeant announced the next elections would be moved from 2016 to 2017 to avoid clashing with the 2016 National Assembly for Wales election which in turn had been delayed a year to avoid clashing with the 2015 United Kingdom general election. [2]
The previous election took place on 1 May 2008.
The next full election took place on 3 May 2017.
Party | Seats | Gains | Losses | Net gain/loss | Seats % | Votes % | Votes | +/− | |
---|---|---|---|---|---|---|---|---|---|
Labour | 37 | +15 | 74.0 | 48.2 | 17,870 | +14.9 | |||
Conservative | 10 | -7 | 20.0 | 28.7 | 10,642 | -6.6 | |||
Liberal Democrats | 1 | -8 | 2.0 | 13.0 | 4,823 | -8.8 | |||
Independent | 2 | +1 | 4.0 | 4.8 | 1,764 | +2.4 | |||
Plaid Cymru | 0 | -1 | 0.0 | 4.1 | 1,517 | -3.1 | |||
Green | 0 | 0 | 0.0 | 0.7 | 274 | New | |||
Welsh Christian | 0 | 0 | 0.0 | 0.4 | 158 | New | |||
Total | 50 | 37,048 |
Asterisks denote incumbent Councillors seeking re-election. Vote share changes compared with corresponding 2008 election.
Party | Candidate | Votes | % | ±% | |
---|---|---|---|---|---|
Labour | Michael Allen | 942 | 11.90% | ||
Labour | Jan Atkinson | 916 | 11.57% | ||
Independent | Laura Buchanan-Smith | 755 | 9.54% | ||
Labour | Pat Drewett | 843 | 10.65% | ||
Plaid Cymru | Robert Edwards | 236 | 2.98% | ||
Conservative | Matthew Evans* | 1,364 | 17.24% | -7.05% | |
Conservative | Charles Ferris | 1,273 | 16.09% | ||
Conservative | David Fouweather* | 1,339 | 16.92% | -7.12% | |
Liberal Democrats | Megan Rees-Webb | 246 | 3.10% | -2.39% | |
Majority | |||||
Turnout | 7,914 | ||||
Conservative hold | Swing | ||||
Party | Candidate | Votes | % | ±% | |
---|---|---|---|---|---|
Conservative | Dave Gapper-Hampson | 292 | 7.14% | ||
Labour | John Guy* | 1,103 | 26.97% | +9.58% | |
Labour | Debbie Harvey | 1,021 | 24.97% | ||
Conservative | Andrew Hill | 314 | 7.68% | ||
Labour | Ray Truman* | 1,140 | 27.88% | +10.07% | |
Liberal Democrats | Shihab Uddin | 219 | 5.36% | ||
Majority | |||||
Turnout | 4,089 | ||||
Labour hold | Swing | ||||
Party | Candidate | Votes | % | ±% | |
---|---|---|---|---|---|
Conservative | Javid Ahmed | 172 | 3.06% | ||
Liberal Democrats | Hugh Clarke* | 806 | 14.32% | ||
Labour | Deb Davies | 950 | 16.87% | ||
Liberal Democrats | Jeff Evans* | 765 | 13.59% | ||
Liberal Democrats | David Hando* | 805 | 14.30% | ||
Labour | Paul Hannon | 912 | 16.20% | ||
Conservative | Pat Harris | 185 | 3.29% | ||
Conservative | Omer Mian | 134 | 2.38% | ||
Labour | Mark Spencer | 901 | 16.00% | ||
Majority | |||||
Turnout | 5,630 | ||||
Labour gain from Liberal Democrats | Swing | ||||
Party | Candidate | Votes | % | ±% | |
---|---|---|---|---|---|
Independent | Susan Baker | 534 | 13.01% | ||
Labour | Val Delahaye* | 616 | 15.01% | ||
Labour | Kieron Dineen | 594 | 14.47% | ||
Welsh Christian | John Harrold | 158 | 3.85% | ||
Labour | Glyn Jarvis* | 584 | 14.23% | ||
Independent | Noel Trigg* | 840 | 20.46% | ||
Independent | Kevin Whitehead | 779 | 18.98% | ||
Majority | |||||
Turnout | 4,105 | ||||
Labour hold | Swing | ||||
Independent gain from Labour | Swing | ||||
Party | Candidate | Votes | % | ±% | |
---|---|---|---|---|---|
Labour | Gail Giles* | 1,582 | 21.79% | ||
Liberal Democrats | Theresa Hughes | 300 | 4.13% | ||
Labour | Paul Huntley | 1,346 | 18.54% | ||
Conservative | Angela Jones* | 1,074 | 14.79% | ||
Conservative | Edward Saville | 743 | 10.23% | ||
Labour | Cliff Suller | 1,342 | 18.48% | ||
Conservative | Joan Watkins | 874 | 12.04% | ||
Majority | |||||
Turnout | 7,261 | ||||
Labour gain from Conservative | Swing | ||||
Labour hold | Swing | ||||
Labour gain from Conservative | Swing | ||||
Party | Candidate | Votes | % | ±% | |
---|---|---|---|---|---|
Conservative | Anthony Bird | 473 | 9.09% | ||
Plaid Cymru | Clive Busson | 238 | 4.57% | ||
Conservative | Amanda Butler | 486 | 9.34% | ||
Liberal Democrats | Susan Davies | 156 | 3.00% | ||
Conservative | Jackie Johnson | 463 | 8.90% | ||
Labour | Herbie Thomas | 1,135 | 21.81% | ||
Labour | Mark Whitcutt | 1,152 | 22.14% | ||
Labour | Debbie Wilcox | 1,101 | 21.16% | ||
Majority | |||||
Turnout | 5,204 | ||||
Labour gain from | Swing | ||||
Labour hold | Swing | ||||
Labour gain from | Swing | ||||
Party | Candidate | Votes | % | ±% | |
---|---|---|---|---|---|
Conservative | Margaret Cornelious* | 902 | 28.42% | ||
Labour | Victoria Ann Cox-Wall | 718 | 22.62% | ||
Liberal Democrats | Norman Mountain | 169 | 5.32% | ||
Labour | Sarah Osolinski | 580 | 18.27% | ||
Conservative | David Williams* | 805 | 25.36% | ||
Majority | |||||
Turnout | 3,174 | ||||
Conservative hold | Swing | ||||
Party | Candidate | Votes | % | ±% | |
---|---|---|---|---|---|
Conservative | David Atwell* | 839 | 34.44% | ||
Labour | Nicholas Boyd | 300 | 12.32% | ||
Labour | John Davies | 355 | 14.57% | ||
Liberal Democrats | Linda Davies | 175 | 7.18% | ||
Conservative | Ray Mogford | 767 | 31.49% | ||
Majority | |||||
Turnout | 2,436 | ||||
Conservative hold | Swing | ||||
Conservative gain from Independent | Swing | ||||
Party | Candidate | Votes | % | ±% | |
---|---|---|---|---|---|
Liberal Democrats | Paul Bevan | 26 | 2.95% | ||
Labour | Chris Herriot | 269 | 30.50% | ||
Conservative | Martyn Kellway* | 587 | 66.55% | +14.38% | |
Majority | 318 | 36.05% | +21.92% | ||
Turnout | 882 | ||||
Conservative hold | Swing | ||||
Party | Candidate | Votes | % | ±% | |
---|---|---|---|---|---|
Labour | Ken Critchley* | 1,506 | 18.78% | ||
Labour | Roger Jeavons* | 1,469 | 18.31% | ||
Conservative | Heather Lee | 561 | 6.99% | ||
Labour | Allan Morris* | 1,479 | 18.44% | ||
Labour | John Richards* | 1,326 | 16.53% | ||
Conservative | Lewis Routley | 573 | 7.14% | ||
Conservative | Carl Tucker | 559 | 6.97% | ||
Conservative | Richard Weller | 548 | 6.83% | ||
Majority | |||||
Turnout | 8,021 | ||||
Labour hold | Swing | ||||
Party | Candidate | Votes | % | ±% | |
---|---|---|---|---|---|
Green | Philip Anderson | 217 | 3.43% | ||
Conservative | Carol Anne Bader | 663 | 10.48% | ||
Green | Pippa Bartolotti | 274 | 4.33% | ||
Conservative | John Bird* | 658 | 10.40% | ||
Green | Malcolm Degroot | 195 | 3.08% | ||
Labour | Christine Maxfield | 1,194 | 18.87% | ||
Labour | David Mayer* | 1,227 | 19.39% | ||
Conservative | Peter Meredith | 667 | 10.54% | ||
Labour | Jane Mudd | 1,232 | 19.47% | ||
Majority | |||||
Turnout | 6,327 | ||||
Labour gain from Conservative | Swing | ||||
Labour hold | Swing | ||||
Party | Candidate | Votes | % | ±% | |
---|---|---|---|---|---|
Liberal Democrats | Andrew Bailey | 274 | 9.42% | ||
Plaid Cymru | Keith Bennet | 173 | 5.95% | ||
Labour | Stephen Marshall | 413 | 14.20% | ||
Liberal Democrats | Liz Newton | 335 | 11.52% | ||
Labour | Mark Price | 326 | 11.21% | ||
Conservative | Tom Suller | 672 | 23.11% | ||
Conservative | Richard White | 715 | 24.59% | ||
Majority | |||||
Turnout | 2,908 | ||||
Conservative hold | Swing | ||||
Party | Candidate | Votes | % | ±% | |
---|---|---|---|---|---|
Liberal Democrats | Mustafa Ali | 150 | 6.63% | ||
Labour | Ibrahim Hayat* | 703 | 31.06% | ||
Conservative | Zafar Peavez Ismail | 306 | 13.52% | ||
Labour | Ron Jones* | 756 | 33.41% | ||
Liberal Democrats | Sofique Miah | 71 | 3.14% | ||
Plaid Cymru | Khalilur Rahman | 277 | 12.24% | ||
Majority | |||||
Turnout | 2,263 | ||||
Labour hold | Swing | ||||
Party | Candidate | Votes | % | ±% | |
---|---|---|---|---|---|
Liberal Democrats | Mofiz Ali | 304 | 6.45% | ||
Labour | Bob Bright* | 1046 | 22.21% | ||
Labour | Emma Corten | 1,097 | 23.29% | ||
Liberal Democrats | Paul Jordan | 514 | 10.91% | ||
Labour | Malcolm Linton* | 1,090 | 23.14% | ||
Liberal Democrats | Ray Lord | 446 | 9.47% | ||
Conservative | Ruth Williams | 213 | 4.52% | ||
Majority | |||||
Turnout | 4,710 | ||||
Labour hold | Swing | ||||
Labour gain from Liberal Democrats | Swing | ||||
Labour hold | Swing | ||||
Party | Candidate | Votes | % | ±% | |
---|---|---|---|---|---|
Labour | Tom Bond | 1,495 | 17.41% | ||
Liberal Democrats | Peter Davies | 248 | 2.89% | ||
Conservative | Valerie Dudley* | 1216 | 14.16% | ||
Labour | Chris Evans | 1,623 | 18.90% | ||
Plaid Cymru | David Hall | 231 | 2.69% | ||
Conservative | Stephen Jones* | 1,213 | 14.12% | ||
Conservative | Alan Mazey | 1,075 | 12.52% | ||
Labour | Sally Mlewa | 1,487 | 17.31% | ||
Majority | |||||
Turnout | 8,588 | ||||
Labour gain from Conservative | Swing | ||||
Party | Candidate | Votes | % | ±% | |
---|---|---|---|---|---|
Labour | Paul Cockeram* | 586 | 28.16% | ||
Conservative | Jay Hampson | 151 | 7.26% | ||
Conservative | Anselm Plummer | 136 | 6.54% | ||
Labour | Bob Poole* | 620 | 29.79% | ||
Independent | Louise Ryan | 169 | 8.12% | ||
Independent | Michael Ryan | 168 | 8.07% | ||
Plaid Cymru | Anthony Salkeld | 124 | 5.96% | ||
Plaid Cymru | Maria Shellard | 127 | 6.10% | ||
Majority | |||||
Turnout | 2,081 | ||||
Labour hold | Swing | ||||
Party | Candidate | Votes | % | ±% | |
---|---|---|---|---|---|
Liberal Democrats | Gill Ford* | 863 | 13.36% | ||
Labour | Emma Garland | 1,020 | 15.79% | ||
Conservative | Vikky Howells | 299 | 4.63% | ||
Labour | Rhys Hutchings | 981 | 15.19% | ||
Conservative | Marie Jermyn | 243 | 3.76% | ||
Conservative | Roy Lane | 266 | 4.12% | ||
Liberal Democrats | Carmel Townsend* | 873 | 13.51% | ||
Liberal Democrats | Ed Townsend* | 958 | 14.83% | ||
Labour | Joshua Worrad | 957 | 14.81% | ||
Majority | |||||
Turnout | 6,460 | ||||
Labour gain from Liberal Democrats | Swing | ||||
Liberal Democrats hold | Swing | ||||
Party | Candidate | Votes | % | ±% | |
---|---|---|---|---|---|
Plaid Cymru | Rhys Gwyn Ab Elis | 79 | 3.91% | ||
Labour | Miqdad Al-Nuaimi | 527 | 26.05% | ||
Liberal Democrats | Pam Baulch | 62 | 3.06% | ||
Conservative | Peter Hugh Charles Davies* | 383 | 18.93% | ||
Conservative | William J Routley* | 374 | 18.49% | ||
Labour | Kate Thomas | 598 | 29.56% | ||
Majority | |||||
Turnout | 2,023 | ||||
Labour gain from Conservative | Swing | ||||
Party | Candidate | Votes | % | ±% | |
---|---|---|---|---|---|
Liberal Democrats | Andrew Sherwood | 41 | 5.88% | ||
Conservative | Adam Wate | 144 | 20.66% | ||
Labour | Trevor Watkins | 512 | 73.46% | ||
Majority | 368 | 52.80% | +44.39% | ||
Turnout | 697 | ||||
Labour gain from Plaid Cymru | Swing | ||||
Party | Candidate | Votes | % | ±% | |
---|---|---|---|---|---|
Liberal Democrats | Mike Hamilton* | 418 | 14.57% | ||
Liberal Democrats | Mozadul Hussain* | 345 | 12.03% | ||
Labour | Chris Jenkins | 769 | 26.81% | ||
Conservative | Khurram Khan | 174 | 6.07% | ||
Conservative | Bilal Meah | 224 | 7.81% | ||
Plaid Cymru | Christopher Paul | 156 | 5.44% | ||
Plaid Cymru | Trefor Puw | 108 | 3.77% | ||
Labour | Majid Rahman | 674 | 23.50% | ||
Majority | |||||
Turnout | 2,868 | ||||
Labour gain from Liberal Democrats | Swing | ||||
Newport City Council is the governing body for Newport, one of the principal areas of Wales. It consists of 51 councillors, who represent the city's 20 wards.
The 2012 election to Ceredigion County Council was held on 3 May 2012 along with elections to 20 of the other 21 local authorities in Wales, community council elections in Wales and other elections elsewhere in the United Kingdom. It was followed by the 2017 election.
The 2012 Conwy County Council election took place on 3 May 2012 to elect members of Conwy County Borough Council in Wales. It was on the same day as other 2012 United Kingdom local elections. The previous elections took place on 1 May 2008 and the next elections took place on 4 May 2017.
The 2012 Denbighshire County Council election took place in Denbighshire, Wales, on 3 May 2012 to elect members of Denbighshire Council. This was the same day as other 2012 United Kingdom local elections. The previous elections took place in 2008 and the next all-council elections took place in 2017.
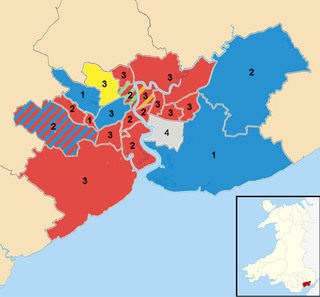
The 2012 Rhondda Cynon Taf Council election took place on Thursday 3 May 2012 to elect members of Rhondda Cynon Taf County Borough Council in Wales. This was the same day as other United Kingdom local elections. It was preceded by the 2008 election and the next full council election took place on 4 May 2017.
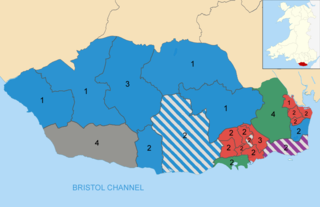
The 2012 Vale of Glamorgan Council election took place on Thursday 3 May 2012 to elect members of Vale of Glamorgan Council in Wales. This was the same day as other United Kingdom local elections. The previous full council election took place on 1 May 2008 and the next one took place on 4 May 2017.
The fifth election to Pembrokeshire County Council was held on 3 May 2012. It was preceded by the 2008 election and followed by the 2017 election. On the same day there were elections to 20 of the other 21 local authorities in Wales, community council elections in Wales and other elections elsewhere in the United Kingdom
The 2016 Plymouth City Council election took place on 5 May 2016 to elect members of Plymouth City Council in England. The Conservatives gained one seat from Labour, resulting in both parties having twenty-seven members of the council. A coalition of Conservative and UKIP members took overall control of the Council, having thirty members in total and a working majority.
The 2017 Welsh local elections were held on 4 May 2017 to elect members of all 22 local authorities in Wales. This included the Isle of Anglesey, which was previously up for election in 2013 due to having its elections delayed for a year. Community council elections also took place on the same day. These local elections were held as part of the 2017 local elections in the United Kingdom. Apart from Anglesey, the last elections were held in 2012. Normally these elections take place every four years, but the 2017 elections were postponed for a year in order to avoid clashing with the 2016 Welsh Assembly election, which itself had been postponed by a year to avoid clashing with the 2015 general election.
The 2008 Isle of Anglesey County Council election took place on Thursday 1 May 2008 to elect members of the Isle of Anglesey County Council in Wales. This was the same day as other United Kingdom local elections. The previous full council election was on 10 June 2004 and the next full council election was held on 2 May 2013.
2008 elections to Newport City Council were held on 1 May 2008 along with elections to the other 21 local authorities in Wales, community council elections in Wales and 2008 United Kingdom local elections.
Elections to Newport City Council were held on 3 May 2017 along with elections to the other 21 local authorities in Wales, community council elections in Wales and 2017 United Kingdom local elections.
The 1973 Gwent County Council election was held on Thursday 12 April 1973 to elect councillors to the new Gwent County Council, governing the new county of Gwent, Wales. It took place on the same day as other county council elections in the United Kingdom.
The 2008 Denbighshire County Council election took place in Denbighshire, Wales, on 1 May 2008 to elect members of Denbighshire Council. This was the same day as other 2008 United Kingdom local elections. The previous elections took place in 2004 and the next all-council elections took place in 2012.
The 2017 Denbighshire County Council election took place in Denbighshire, Wales, on 4 May 2017 to elect members of Denbighshire Council. This was the same day as other 2017 United Kingdom local elections. The previous elections took place in 2012 and the next all-council elections took place in 2022.
The 2022 Welsh local elections took place on 5 May 2022 to elect members of all twenty-two local authorities in Wales. They were held alongside other local elections in the United Kingdom. The previous elections were held in 2017.
The 2022 Wrexham County Borough Council election took place on 5 May 2022 to elect 56 members to Wrexham County Borough Council, the principal council of Wrexham County Borough, Wales. On the same day, elections were held to the other 21 local authorities, and community councils in Wales as part of the 2022 Welsh local elections. The previous Wrexham County Borough all-council election took place in May 2017 and future elections will take place every five years, with the next scheduled for 2027.
The 2022 Vale of Glamorgan Council election took place as of 5 May 2022 to elect 54 members across 24 wards to Vale of Glamorgan Council. On the same day, elections were held to the other 21 local authorities and to community councils in Wales as part of the 2022 Welsh local elections. The previous Vale of Glamorgan all-council election took place in May 2017 and future elections will take place every five years.
2022 Elections to Newport City Council were held on 5 May 2022 along with elections to the other 21 local authorities in Wales, community council elections in Wales and 2022 United Kingdom local elections. The previous full council election took place in May 2017, though there had also been a number of by-elections in the city in the intervening period.
2004 Elections to Newport City Council were held on 10 June 2004 along with elections to the other 21 local authorities and community councils in Wales, as well as elections in the remainder of the United Kingdom. It was the first full election in Newport since it was awarded city status in 2002.
a