| |||||||||||||||||||||||||||||||||||||||||
20 seats (of the 53) to Hull City Council 27 seats needed for a majority | |||||||||||||||||||||||||||||||||||||||||
---|---|---|---|---|---|---|---|---|---|---|---|---|---|---|---|---|---|---|---|---|---|---|---|---|---|---|---|---|---|---|---|---|---|---|---|---|---|---|---|---|---|
| |||||||||||||||||||||||||||||||||||||||||
Map of the results of the 2012 Hull council election. Labour in red, Liberal Democrats in yellow, Conservatives in blue, Uncontested in cream. | |||||||||||||||||||||||||||||||||||||||||
|
The 2012 Hull City Council election took place on 3 May 2012 to elect members of Hull City Council in England. [1] This was held on the same day as other 2012 United Kingdom local elections. One third of the council was up for election and Labour retained control of the council with an increased majority. [2]
No elections were held in Bransholme East, Bransholme West and University wards.
Party | Candidate | Votes | % | ±% | |
---|---|---|---|---|---|
Labour | Rosie Nicola | 1,348 | 41.2 | ||
Liberal Democrats | John Graham Robinson | 1,089 | 33.3 | ||
Green | Martin Deane | 513 | 15.7 | ||
UKIP | Stan Smith | 201 | 6.1 | ||
Conservative | Alexander David Hayward | 120 | 3.7 | ||
Majority | 259 | 7.9 | |||
Turnout | 3,277 | 33.9 | |||
Labour gain from Liberal Democrats | Swing | ||||
Party | Candidate | Votes | % | ±% | |
---|---|---|---|---|---|
Liberal Democrats | Karen Mathieson | 1,484 | 59.0 | ||
Labour | Leanne Fudge | 612 | 24.3 | ||
UKIP | Vicky Butler | 348 | 13.8 | ||
Conservative | Andrew Neil Forster | 70 | 2.8 | ||
Majority | 872 | 34.5 | |||
Turnout | 2,524 | 37.2 | |||
Liberal Democrats hold | Swing | ||||
Party | Candidate | Votes | % | ±% | |
---|---|---|---|---|---|
Liberal Democrats | Helena Woods | 1,196 | 43.8 | ||
Labour Co-op | Theresa Elizabeth Vaughan | 1,123 | 41.2 | ||
UKIP | Brian Shepherd | 308 | 11.3 | ||
Conservative | Craig William Ulliott | 101 | 3.7 | ||
Majority | 73 | 2.7 | |||
Turnout | 2,733 | 28.5 | |||
Liberal Democrats hold | Swing | ||||
Party | Candidate | Votes | % | ±% | |
---|---|---|---|---|---|
Conservative | John Francis Abbott | 928 | 43.2 | ||
Labour | Karen Jane Rouse-Deane | 803 | 37.4 | ||
UKIP | Mike Hookem | 234 | 10.9 | ||
Green | Michael John Lammiman | 101 | 4.7 | ||
Liberal Democrats | Motokin Ali | 80 | 3.7 | ||
Majority | 125 | 5.8 | |||
Turnout | 2,155 | 32.9 | |||
Conservative hold | Swing | ||||
Party | Candidate | Votes | % | ±% | |
---|---|---|---|---|---|
Liberal Democrats | Eliza Mann | 1,047 | 44.0 | ||
Labour | Rob Dunstan | 949 | 39.9 | ||
UKIP | John Henry Cornforth | 301 | 12.7 | ||
Conservative | James Alliott | 81 | 3.4 | ||
Majority | 98 | 4.1 | |||
Turnout | 2,381 | 26.4 | |||
Liberal Democrats hold | Swing | ||||
Party | Candidate | Votes | % | ±% | |
---|---|---|---|---|---|
Liberal Democrats | Adam Williams | 1,523 | 52.6 | ||
Labour | Mike Thompson | 1,180 | 40.7 | ||
National Front | Stuart Moses | 133 | 4.6 | ||
Conservative | Steph Corke | 60 | 2.1 | ||
Majority | 343 | 11.8 | |||
Turnout | 2,909 | 30.3 | |||
Liberal Democrats hold | Swing | ||||
Party | Candidate | Votes | % | ±% | |
---|---|---|---|---|---|
Labour | Gill Kennett | 1,481 | 48.7 | ||
Liberal Democrats | Jackie Dad | 1,447 | 47.5 | ||
Conservative | John Mathew Crompton | 116 | 3.8 | ||
Majority | 34 | 1.1 | |||
Turnout | 3,044 | 30.0 | |||
Labour gain from Liberal Democrats | Swing | ||||
Party | Candidate | Votes | % | ±% | |
---|---|---|---|---|---|
Labour | Suzanne Armstrong | 1,879 | 71.2 | ||
Liberal Democrats | Christine Gurevitch | 349 | 13.2 | ||
National Front | Nick Walsh | 241 | 9.1 | ||
Conservative | Philip David MacKay | 169 | 6.4 | ||
Majority | 1,530 | 57.9 | |||
Turnout | 2,642 | 28.0 | |||
Labour gain from Liberal Democrats | Swing | ||||
Party | Candidate | Votes | % | ±% | |
---|---|---|---|---|---|
Liberal Democrats | Charles Quinn | 973 | 48.5 | ||
Labour | Gwen Lunn | 945 | 47.1 | ||
Conservative | Colin Robert Baxter | 89 | 4.4 | ||
Majority | 28 | 1.4 | |||
Turnout | 2,017 | 26.2 | |||
Liberal Democrats hold | Swing | ||||
Party | Candidate | Votes | % | ±% | |
---|---|---|---|---|---|
Labour | John Allen Hewitt | 1,539 | 82.8 | ||
Liberal Democrats | Elaine Lesley Keal | 177 | 9.5 | ||
Conservative | Leslie Harry Fisher | 143 | 7.7 | ||
Majority | 1,362 | 72.5 | |||
Turnout | 1,878 | 21.6 | |||
Labour hold | Swing | ||||
Party | Candidate | Votes | % | ±% | |
---|---|---|---|---|---|
Labour | Sheila Waudby | 1,510 | 87.7 | ||
Liberal Democrats | Tracey Neal | 108 | 6.3 | ||
Conservative | Richard James Munslow | 104 | 6.0 | ||
Majority | 1,402 | 80.9 | |||
Turnout | 1,734 | 18.8 | |||
Labour hold | Swing | ||||
Party | Candidate | Votes | % | ±% | |
---|---|---|---|---|---|
Labour | Colin Inglis | 1,107 | 61.5 | ||
UKIP | Ken Hordon | 361 | 20.1 | ||
Liberal Democrats | Steven Carter | 157 | 8.7 | ||
Conservative | Adam Vaughan | 105 | 5.8 | ||
National Front | Nigel Piggins | 70 | 3.9 | ||
Majority | 746 | 41.0 | |||
Turnout | 1,819 | 18.3 | |||
Labour hold | Swing | ||||
Party | Candidate | Votes | % | ±% | |
---|---|---|---|---|---|
Labour | Helena Jane Spencer | 1,040 | 74.2 | ||
Liberal Democrats | Rick Welton | 269 | 19.2 | ||
Conservative | David Thompson | 92 | 6.6 | ||
Majority | 771 | 54.7 | |||
Turnout | 1,409 | 17.8 | |||
Labour gain from Liberal Democrats | Swing | ||||
Party | Candidate | Votes | % | ±% | |
---|---|---|---|---|---|
Liberal Democrats | Mike Ross | 883 | 58.2 | ||
Labour Co-op | Brian Leslie Navier | 426 | 28.1 | ||
Green | James Edward Russell | 119 | 7.8 | ||
Conservative | Sam Lee | 89 | 5.9 | ||
Majority | 457 | 29.8 | |||
Turnout | 1,536 | 19.2 | |||
Liberal Democrats hold | Swing | ||||
Party | Candidate | Votes | % | ±% | |
---|---|---|---|---|---|
Labour Co-op | Stephen James Bayes | 1,267 | 77.9 | ||
UKIP | Tony Morfitt | 219 | 13.5 | ||
Liberal Democrats | Chris Randall | 92 | 5.7 | ||
Conservative | David Triffitt Whellan | 48 | 3.0 | ||
Majority | 1,048 | 64.1 | |||
Turnout | 1,636 | 17.8 | |||
Labour Co-op hold | Swing | ||||
Party | Candidate | Votes | % | ±% | |
---|---|---|---|---|---|
Liberal Democrats | Claire Thomas | 1,489 | 52.7 | ||
Labour | Sharon Belcher | 984 | 34.8 | ||
UKIP | Peter Mawer | 281 | 9.9 | ||
Conservative | Daniel Mark Bond | 73 | 2.6 | ||
Majority | 505 | 17.8 | |||
Turnout | 2,837 | 31.4 | |||
Liberal Democrats hold | Swing | ||||
Party | Candidate | Votes | % | ±% | |
---|---|---|---|---|---|
Labour | Tom Mcvie | 1,013 | 88.5 | ||
Liberal Democrats | Elizabeth Neil | 71 | 6.2 | ||
Conservative | Samuel Gary Beckton | 61 | 5.3 | ||
Majority | 942 | 81.0 | |||
Turnout | 1163 | 19.9 | |||
Labour hold | Swing | ||||
Party | Candidate | Votes | % | ±% | |
---|---|---|---|---|---|
Labour Co-op | Mary Elizabeth Glew | 1,036 | 78.5 | ||
UKIP | Julian Marcus Penna | 109 | 8.3 | ||
National Front | Mike Cooper | 66 | 5.0 | ||
Liberal Democrats | Michael Chambers | 58 | 4.4 | ||
Conservative | Nikki Knowles | 50 | 3.8 | ||
Majority | 927 | 70.1 | |||
Turnout | 1,323 | 22.1 | |||
Labour Co-op hold | Swing | ||||
Party | Candidate | Votes | % | ±% | |
---|---|---|---|---|---|
Labour Co-op | Daren Russell Hale | 866 | 83.4 | ||
Liberal Democrats | Tracey Henry | 97 | 9.3 | ||
Conservative | Bob Cook | 75 | 7.2 | ||
Majority | 769 | 73.0 | |||
Turnout | 1,053 | 18.3 | |||
Labour Co-op hold | Swing | ||||
Party | Candidate | Votes | % | ±% | |
---|---|---|---|---|---|
Labour | Ken Turner | 1,606 | 59.4 | ||
Liberal Democrats | Kalvin Neal | 977 | 36.2 | ||
Conservative | Christopher David Oakley | 119 | 4.4 | ||
Majority | 629 | 23.2 | |||
Turnout | 2,714 | 28.0 | |||
Labour gain from Liberal Democrats | Swing | ||||
Summary of the 3 May 2012 Hull City Council election results
Parties | Last election: 2011 | Uncontested Seats | Seats for Election | Elected | Gains | Losses | Result | Votes | Share | |
---|---|---|---|---|---|---|---|---|---|---|
Labour | 34 | 27 | 7 | 12 | 5 | - | 39 | 22,714 | 53.3% | |
Liberal Democrats | 22 | 10 | 12 | 7 | 5 | - | 17 | 13,566 | 31.9% | |
Conservative | 2 | 1 | 1 | 1 | - | - | 2 | 2,693 | 6.3% | |
Independent | 1 | 1 | 0 | 0 | - | - | 1 | 0 | 0% | |
UKIP | 0 | 0 | 0 | 0 | - | - | 0 | 2,362 | 5.5% | |
Green | 0 | 0 | 0 | 0 | - | - | 0 | 733 | 1.7% | |
National Front | 0 | 0 | 0 | 0 | - | - | 0 | 510 | 1.2% |
Kingston upon Hull, usually shortened to Hull, is a port city and unitary authority area in the East Riding of Yorkshire, England. It lies upon the River Hull at its confluence with the Humber Estuary, 25 miles (40 km) inland from the North Sea and 37 miles (60 km) south-east of York, the historic county town. With a population of 268,852 (2022), it is the fourth-largest city in the Yorkshire and the Humber region after Leeds, Sheffield and Bradford.
Kingston upon Hull East is a borough constituency for the House of Commons of the Parliament of the United Kingdom. It elects one Member of Parliament (MP) at least once every five years by the first-past-the-post electoral system. The constituency has been represented by Karl Turner of the Labour Party since the 2010 general election.
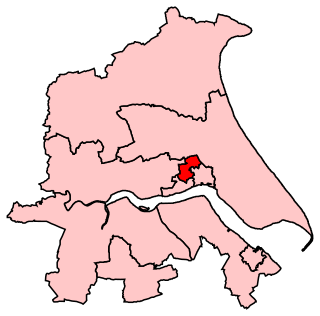
Kingston upon Hull North is a borough constituency for the House of Commons of the Parliament of the United Kingdom. It elects one Member of Parliament (MP) at least once every five years by the first-past-the-post electoral system. The constituency has been represented by Diana Johnson of the Labour Party since the 2005 general election.
Scotland has elections to several bodies: the Scottish Parliament, the United Kingdom Parliament, local councils and community councils. Before the United Kingdom left the European Union, Scotland elected members to the European Parliament.
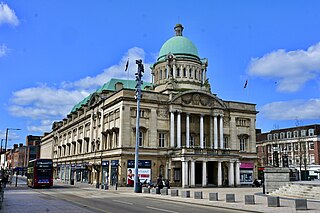
(Kingston upon) Hull City Council is the governing body for the unitary authority and city of Kingston upon Hull. It was created in 1972 as the successor to the Corporation of Hull, which was also known as the Hull Corporation and founded in 1440 by royal charter.
Bransholme is an area and a housing estate on the north side of Kingston upon Hull, East Riding of Yorkshire, England. The name Bransholme comes from an old Scandinavian word meaning Brand's water meadow.
Drypool is an area within the city of Kingston upon Hull, England.
The 2008 Hull City Council election took place on 1 May 2008 to elect members of Hull City Council in England. One third of the council was up for election and the Liberal Democrats retained control of the council with an increased majority from a situation of ruling under no overall control.
Kingston upon Hull is a unitary authority in the East Riding of Yorkshire, England. Until 1 April 1996 it was a non-metropolitan district in Humberside. A third of the Council is elected each year with no election every four years. Since the boundary changes in 2002 until 2018, 59 councillors are elected from 23 wards with each ward electing either 2 or 3 councillors. Following a review, in 2017, by the Local Government Boundary Commission this was reduced to 57 councillors from 21 wards effective from the 2018 elections.
The 2003 Hull City Council election took place on 1 May 2003 to elect members of Hull City Council in England. One third of the council was up for election and the council stayed under no overall control.
The 2004 Hull City Council election took place on 10 June 2004 to elect members of Hull City Council in England. One third of the council was up for election and the council stayed under no overall control.
The 2007 Hull City Council election took place on 3 May 2007 to elect members of Hull City Council in England. One third of the council was up for election and the Liberal Democrats gained overall control of the council from no overall control. Overall turnout was 27%.
The 2011 Hull City Council election took place on 5 May 2011 to elect members of Hull City Council in England. One third of the council was up for election and Labour gained control of the council from the Liberal Democrats.
The 2010 Hull City Council election took place on 6 May 2010 to elect members of Hull City Council in England. One third of the council was up for election and Liberal Democrats retained control of the council.
Southcoates is an urban area in the eastern part of Kingston upon Hull, England.
The 2015 Hull City Council election took place on 7 May 2015 to elect members of Hull City Council in England. This was on the same day as other local elections.
Kingswood, occasionally referred to as Kingswood Parks, is a modern housing estate on the northern fringe of Kingston upon Hull, England.
The 2016 Hull City Council election took place on 5 May 2016 to elect members of Hull City Council in England. This was on the same day as other nationwide local elections. One third of the council was up for election with Labour defending overall control of the council. The Green Party did not field any candidates after the local party failed to submit nomination papers in time.
The 2018 Hull City Council election took place on 3 May 2018 to elect members of Hull City Council in England. This was on the same day as other nationwide local elections. Following a review of Ward boundaries by the Local Government Boundary Commission for England (LGBCE) the whole council was up for election as the number of councillors was reduced by two and boundaries of all seats redrawn. The Labour party was defending overall control of the council, which they achieved but with a greatly reduced majority.