| |||||||||||||||||||||||||||||||||||||||||||||||||||||||||||||||||||||||||||||||||||||||||||||||||
All 79 seats to Glasgow City Council 40 seats needed for a majority | |||||||||||||||||||||||||||||||||||||||||||||||||||||||||||||||||||||||||||||||||||||||||||||||||
---|---|---|---|---|---|---|---|---|---|---|---|---|---|---|---|---|---|---|---|---|---|---|---|---|---|---|---|---|---|---|---|---|---|---|---|---|---|---|---|---|---|---|---|---|---|---|---|---|---|---|---|---|---|---|---|---|---|---|---|---|---|---|---|---|---|---|---|---|---|---|---|---|---|---|---|---|---|---|---|---|---|---|---|---|---|---|---|---|---|---|---|---|---|---|---|---|---|
| |||||||||||||||||||||||||||||||||||||||||||||||||||||||||||||||||||||||||||||||||||||||||||||||||
The 21 multi-member wards | |||||||||||||||||||||||||||||||||||||||||||||||||||||||||||||||||||||||||||||||||||||||||||||||||
|
Elections to Glasgow City Council were held on 3 May 2012, the same day as the other Scottish local government elections. The election was the second using 21 new wards created as a result of the Local Governance (Scotland) Act 2004, each ward elected three or four councillors using the single transferable vote system form of proportional representation.
The election in Glasgow attracted the most attention out of the local elections in Scotland as there were many predictions that the Scottish Labour would lose control of the council due to losses of seats to the Scottish National Party. [1] The Labour administration had suffered from a number of defections of council members to the newly formed Glasgow First party and controversy surrounding Councillor's salaries and contracts. [2] In the end, Labour remained in control, losing just one seat, while the SNP gained five. The Scottish Liberal Democrats were reduced to holding just one seat on the council, the same numbers as the Scottish Conservatives (who retained their solitary seat) and Glasgow First. The Scottish Greens retained five seats on the authority.
After the elections Labour again formed a controlling administration on the City Council.
Party | Seats | Gains | Losses | Net gain/loss | Seats % | Votes % | Votes | +/− | |
---|---|---|---|---|---|---|---|---|---|
Labour | 44 | 1 | 2 | 1 | 55.70 | 46.72 | 67,341 | +3.40 | |
SNP | 27 | 5 | 0 | 5 | 34.17 | 32.57 | 46,947 | +7.99 | |
Scottish Green | 5 | 1 | 1 | 0 | 6.33 | 5.55 | 7,999 | -0.93 | |
Conservative | 1 | 0 | 0 | 0 | 1.27 | 5.94 | 8,567 | -1.73 | |
Liberal Democrats | 1 | 0 | 4 | 4 | 1.27 | 2.93 | 4,221 | -4.98 | |
Glasgow First | 1 | 1 | 0 | 1 | 1.27 | 1.76 | 2,544 | New | |
Independent | 0 | - | - | - | - | 1.7 | 2,432 | +0.59 | |
Scottish Socialist | 0 | - | - | - | - | 0.7 | 979 | -1.76 | |
TUSC | 0 | - | - | - | - | 0.4 | 636 | New | |
Solidarity | 0 | 0 | 1 | 1 | 0 | 0.4 | 621 | -4.31 | |
Scottish Unionist | 0 | 0 | 0 | 0 | 0 | 0.4 | 586 | -0.67 | |
UKIP | 0 | - | - | - | - | 0.3 | 441 | New | |
Scottish Christian | 0 | - | - | - | - | 0.2 | 354 | -0.13 | |
Socialist Labour | 0 | - | - | - | - | 0.2 | 271 | New | |
Pirate_Party_UK | 0 | 0 | 0 | 0 | 0 | 0.1 | 97 | New | |
Britannica Party | 0 | 0 | 0 | 0 | 0 | 0.1 | 73 | New | |
Turnout | 144,149 | 32.4% |
Note: "Votes" are the first preference votes. The net gain/loss and percentage changes relate to the result of the previous Scottish local elections on 3 May 2007. This may differ from other published sources showing gain/loss relative to seats held at dissolution of Scotland's councils.
Ward | % | Seats | % | Seats | % | Seats | % | Seats | % | Seats | % | Seats | % | Seats | Total |
---|---|---|---|---|---|---|---|---|---|---|---|---|---|---|---|
Labour | SNP | Conservative | Green | Lib Dem | Glasgow First | Others | |||||||||
Linn | 46.04 | 2 | 29.44 | 1 | 7.03 | 0 | 2.73 | 0 | 12.09 | 1 | 1.06 | 0 | 1.61 | 0 | 4 |
Newlands/Auldburn | 40.98 | 2 | 36.11 | 1 | 10.77 | 0 | 3.61 | 0 | 1.56 | 0 | 0.71 | 0 | 6.26 | 0 | 3 |
Greater Pollok | 47.65 | 2 | 34.03 | 2 | 3.73 | 0 | 2.11 | 0 | 1.12 | 0 | 8.23 | 0 | 3.13 | 0 | 4 |
Craigton | 53.4 | 2 | 31.4 | 2 | 3.6 | 0 | 2.1 | 0 | 0.9 | 0 | 1.8 | 0 | 6.8 | 0 | 4 |
Govan | 32.22 | 2 | 32.63 | 1 | 3.16 | 0 | 3.31 | 0 | 1.26 | 0 | 14.46 | 1 | 12.98 | 0 | 4 |
Pollokshields | 24.19 | 1 | 40.93 | 1 | 22.15 | 1 | 8.04 | 0 | 2.91 | 0 | 0.57 | 0 | 1.20 | 0 | 3 |
Langside | 35.80 | 1 | 37.61 | 1 | 7.38 | 0 | 8.50 | 1 | 7.25 | 0 | 1.03 | 0 | 2.42 | 0 | 3 |
Southside Central | 44.3 | 2 | 35.81 | 2 | 2.50 | 0 | 6.40 | 0 | 0.79 | 0 | 0.0 | 0 | 10.19 | 0 | 4 |
Calton | 54.6 | 2 | 30 | 1 | 2.6 | 0 | 3.0 | 0 | 0.9 | 0 | 2.9 | 0 | 6 | 0 | 3 |
Anderston/City | 50.3 | 2 | 29.6 | 1 | 4.7 | 0 | 10.5 | 1 | 1.7 | 0 | 0.4 | 0 | 2.9 | 0 | 4 |
Hillhead | 29.45 | 2 | 33.06 | 1 | 6.54 | 0 | 17.62 | 1 | 4.10 | 0 | 0.22 | 0 | 9.01 | 0 | 4 |
Partick West | 32.1 | 1 | 33.5 | 2 | 10.33 | 0 | 14.71 | 1 | 5.54 | 0 | 0.29 | 0 | 3.53 | 0 | 4 |
Garscadden/Scotstounhill | 61.6 | 3 | 27.1 | 1 | 2.6 | 0 | 2.7 | 0 | 1.1 | 0 | 0.3 | 0 | 4.6 | 0 | 4 |
Drumchapel/Anniesland | 61.36 | 3 | 29.26 | 1 | 3.62 | 0 | 2.63 | 0 | 1.96 | 0 | 0.30 | 0 | 0.87 | 0 | 4 |
Maryhill/Kelvin | 39.6 | 2 | 34.4 | 2 | 7.7 | 0 | 7.3 | 0 | 9.2 | 0 | 0.0 | 0.0 | 1.9 | 0 | 4 |
Canal | 44.5 | 2 | 31.27 | 1 | 2.34 | 0 | 9.27 | 1 | 1.84 | 0 | 0.54 | 0 | 10.23 | 0 | 4 |
Springburn | 57.7 | 2 | 30 | 1 | 2.7 | 0 | 1.5 | 0 | 1.1 | 0 | 0.5 | 0 | 6.4 | 0 | 3 |
East Centre | 58.6 | 3 | 27.7 | 1 | 4.0 | 0 | 4.8 | 0 | 0.9 | 0 | 0.6 | 0 | 3.4 | 0 | 4 |
Shettleston | 60.5 | 3 | 30.9 | 1 | 4.2 | 0 | 1.5 | 0 | 0.7 | 0 | 1.4 | 0 | 0.9 | 0 | 4 |
Baillieston | 50.8 | 2 | 37.2 | 2 | 5.2 | 0 | 1.8 | 0 | 0.8 | 0 | 1.8 | 0 | 2.4 | 0 | 4 |
North East | 63.61 | 3 | 29.65 | 1 | 3.13 | 0 | 1.76 | 0 | 1.13 | 0 | 0.00 | 0 | 0.72 | 0 | 4 |
Total | 46.72 | 44 | 32.57 | 27 | 5.94 | 1 | 5.55 | 5 | 2.93 | 1 | 1.76 | 1 | 4.53 | 0 | 79 |
Party | Candidate | FPv% | Count | ||||||||
---|---|---|---|---|---|---|---|---|---|---|---|
1 | 2 | 3 | 4 | 5 | 6 | 7 | 8 | ||||
Labour | Malcolm Cunning | 25.14% | 1,858 | ||||||||
Labour | Sadie Docherty (incumbent) | 20.90% | 1,545 | ||||||||
SNP | Glenn Elder | 20.01% | 1,479 | ||||||||
Liberal Democrats | Margot Clark (incumbent) | 12.09% | 894 | 938 | 949 | 961 | 970 | 1,026 | 1,300 | 1,548 | |
SNP | Stewart McDonald | 9.43% | 697 | 736 | 742 | 751 | 778 | 851 | 900 | ||
Conservative | Andrew Morrison | 7.03% | 520 | 533 | 534 | 539 | 546 | 569 | |||
Scottish Green | Lisa Jones | 2.73% | 202 | 229 | 234 | 261 | 315 | ||||
TUSC | Frank Young | 1.61% | 119 | 138 | 142 | 166 | |||||
Glasgow First | Lesley Ingram | 1.06% | 78 | 111 | 116 | ||||||
Electorate: 22,192 Valid: 7,392 Spoilt: 169 Quota: 1,479 Turnout: 34.07% |
2007: 2×Lab; 1×SNP
2012: 2×Lab; 1×SNP
2007–2012 change: No change
Party | Candidate | FPv% | Count | |||||||||||
---|---|---|---|---|---|---|---|---|---|---|---|---|---|---|
1 | 2 | 3 | 4 | 5 | 6 | 7 | 8 | 9 | 10 | 11 | ||||
Labour | Stephan Curran (incumbent) | 26.03% | 1,750 | |||||||||||
SNP | Josephine Docherty | 21.17% | 1,423 | 1,426 | 1,431 | 1,440 | 1,446 | 1,460 | 1,515 | 1,595 | 1,699 | |||
Labour | Emma Gillan | 14.95% | 1,005 | 1,058 | 1,062 | 1,071 | 1,076 | 1,085 | 1,147 | 1,233 | 1,360 | 1,361 | 1,506 | |
SNP | Shoaib Gul | 14.94% | 1,004 | 1,005 | 1,006 | 1,008 | 1,009 | 1,010 | 1,042 | 1,068 | 1,097 | 1,110 | ||
Conservative | Robert McElroy | 10.77% | 724 | 725 | 728 | 730 | 734 | 757 | 771 | 841 | ||||
Independent | Colin Deans (incumbent) | 4.63% | 311 | 314 | 319 | 324 | 362 | 372 | 422 | |||||
Scottish Green | Ben Thomson | 3.61% | 243 | 243 | 256 | 269 | 282 | 318 | ||||||
Liberal Democrats | Michael O'Donnell | 1.56% | 105 | 105 | 105 | 105 | 107 | |||||||
Independent | Craig Creighton | 1.06% | 71 | 71 | 74 | 82 | ||||||||
Glasgow First | Ruth Black [lower-alpha 1] | 0.71% | 48 | 48 | 50 | |||||||||
TUSC | Diane Harvey | 0.57% | 38 | 38 | ||||||||||
Electorate: 17,755 Valid: 6,722 Spoilt: 201 Quota: 1,681 Turnout: 38.98% |
2007: 3×Lab; 1×SNP
2012: 2×Lab; 2×SNP
2007–2012 change: SNP gain one seat from Lab
Party | Candidate | FPv% | Count | |||||||||||
---|---|---|---|---|---|---|---|---|---|---|---|---|---|---|
1 | 2 | 3 | 4 | 5 | 6 | 7 | 8 | 9 | 10 | 11 | ||||
Labour | Bill Butler | 34.40% | 2,462 | |||||||||||
Labour | Rashid Hussain | 13.25% | 948 | 1,684 | ||||||||||
SNP | David McDonald [lower-alpha 1] | 19.85% | 1,421 | 1,472 | ||||||||||
SNP | Shabbar Jaffri | 14.18% | 1,015 | 1,036 | 1,080 | 1,109 | 1,122 | 1,137 | 1,167 | 1,193 | 1,211 | 1,233 | 1,343 | |
Glasgow First | William O'Rourke (incumbent) | 5.16% | 369 | 404 | 425 | 426 | 431 | 435 | 452 | 481 | 676 | 752 | ||
Conservative | Chris Morgan | 3.73% | 267 | 281 | 287 | 288 | 310 | 332 | 338 | 356 | 369 | |||
Glasgow First | Tommy Morrison (incumbent) | 3.07% | 220 | 250 | 269 | 271 | 288 | 295 | 310 | 347 | ||||
Scottish Green | Juliet Neal | 2.11% | 151 | 168 | 181 | 183 | 194 | 218 | 255 | |||||
Scottish Socialist | Ian Beattie | 1.94% | 139 | 152 | 163 | 164 | 168 | 172 | ||||||
Liberal Democrats | Norman Fraser | 1.12% | 80 | 98 | 104 | 104 | 108 | |||||||
Scottish Christian | Archie Linnegan | 1.19% | 85 | 91 | 95 | 96 | ||||||||
Electorate: 24,096 Valid: 7,157 Spoilt: 200 Quota: 1,432 Turnout: 30.53% |
2007: 2×Lab; 1×SNP; 1×Sol
2012: 2×Lab; 2×SNP
2007–2012 change: SNP gain one seat from Sol
Party | Candidate | FPv% | Count | ||||||||||
---|---|---|---|---|---|---|---|---|---|---|---|---|---|
1 | 2 | 3 | 4 | 5 | 6 | 7 | 8 | 9 | 10 | ||||
Labour | Matt Kerr (incumbent) | 27.8 | 2,279 | ||||||||||
Labour | Alistair Watson (incumbent) | 25.6 | 2,102 | ||||||||||
SNP | Iris Gibson (incumbent) | 22.9 | 1,876 | ||||||||||
SNP | Jim Torrance | 8.5 | 700 | 771.8 | 826.7 | 1,004.1 | 1,010.7 | 1,025.9 | 1,048.7 | 1,128.1 | 1,193.8 | 1,434.9 | |
Solidarity | Gail Sheridan | 5.8 | 472 | 555.3 | 624.3 | 638.9 | 646.9 | 656.8 | 688 | 735.1 | 772.4 | ||
Conservative | Jayne Morgan | 3.6 | 292 | 316.7 | 330.5 | 333.3 | 365.7 | 391.1 | 411.9 | 431.5 | |||
Scottish Green | Ian Ruffell | 2.1 | 169 | 209.9 | 237.8 | 245 | 256.7 | 273.9 | 314 | ||||
Glasgow First | Gordon MacDiarmid | 1.8 | 147 | 193.8 | 226.6 | 233.7 | 245.3 | 259.2 | |||||
Liberal Democrats | Isabel Nelson | 0.9 | 76 | 103.2 | 115.5 | 119.7 | 123.7 | ||||||
UKIP | Janice MacKay | 1.0 | 86 | 99.7 | 107.2 | 109.7 | |||||||
Electorate: 22,948 Valid: 8,199 Spoilt: 124 Quota: 1,640 Turnout: 8,439 (36.77%) |
2007: 3×Lab; 1×SNP
2012: 2×Lab; 1×SNP; 1×Glasgow First
2007–2012 change: Glasgow First gain one seat from Lab
Party | Candidate | FPv% | Count | |||||||||||||
---|---|---|---|---|---|---|---|---|---|---|---|---|---|---|---|---|
1 | 2 | 3 | 4 | 5 | 6 | 7 | 8 | 9 | 10 | 11 | 12 | 13 | ||||
Labour | James Adams | 24.94% | 1,727 | |||||||||||||
SNP | Allison Hunter (incumbent) | 21.09% | 1,460 | |||||||||||||
Glasgow First | Stephen Dornan (incumbent) [lower-alpha 1] | 8.71% | 603 | 626 | 627 | 631 | 640 | 643 | 650 | 679 | 714 | 722 | 886 | 1,069 | 1,156 | |
Labour | Fariha Thomas | 7.28% | 504 | 728 | 729 | 730 | 735 | 740 | 747 | 788 | 826 | 873 | 995 | 1,175 | 1,261 | |
SNP | Jonathan Mackie | 6.40% | 443 | 452 | 512 | 517 | 522 | 532 | 538 | 601 | 625 | 879 | 931 | 993 | ||
No description | John Flanagan (incumbent) | 9.30% | 644 | 660 | 661 | 668 | 671 | 677 | 688 | 716 | 741 | 742 | 753 | |||
Glasgow First | Shaukat Butt (incumbent) | 5.75% | 398 | 408 | 408 | 409 | 415 | 416 | 427 | 445 | 468 | 515 | ||||
SNP | Tahir Mohammed | 5.14% | 356 | 359 | 363 | 363 | 367 | 370 | 370 | 385 | 392 | |||||
Conservative | Harriet Murdoch | 3.16% | 219 | 222 | 223 | 223 | 224 | 242 | 323 | 339 | ||||||
Scottish Green | Jesper Bach | 3.31% | 229 | 237 | 238 | 261 | 280 | 307 | 315 | |||||||
Scottish Unionist | Alan Hughes | 2.07% | 143 | 148 | 148 | 154 | 154 | 156 | ||||||||
Liberal Democrats | Chris Young | 1.26% | 87 | 91 | 92 | 92 | 92 | |||||||||
Solidarity | Joyce Drummond | 0.87% | 60 | 62 | 62 | 65 | ||||||||||
Pirate | Finlay Archibald | 0.74% | 51 | 54 | 54 | |||||||||||
Electorate: 23,590 Valid: 6,924 Spoilt: 297 (4.11%) Quota: 1,385 Turnout: 7,221 (30.61%) |
2007: 1×Lab; 1×SNP; 1×Con
2012: 1×Lab; 1×SNP; 1×Con
2007–2012 change: No change
Party | Candidate | FPv% | Count | |||||||
---|---|---|---|---|---|---|---|---|---|---|
1 | 2 | 3 | 4 | 5 | 6 | 7 | ||||
Labour | Hanif Raja | 24.19% | 1,828 | 1,837 | 1,854 | 1,897 | ||||
SNP | Norman MacLeod | 21.92% | 1,657 | 1,662 | 1,671 | 1,702 | 1,703 | 1,865 | 3,181 | |
Conservative | David Meikle (incumbent) | 22.15% | 1,674 | 1,682 | 1,683 | 1,730 | 1,731 | 1,832 | 1,878 | |
SNP | Khalil Malik (incumbent) | 19.01% | 1,437 | 1,439 | 1,455 | 1,466 | 1,467 | 1,613 | ||
Scottish Green | Patrick McAleer | 8.04% | 608 | 614 | 652 | 707 | 709 | |||
Liberal Democrats | Bill Fraser | 2.91% | 220 | 224 | 224 | |||||
TUSC | Akhtar Khan | 1.20% | 91 | 94 | ||||||
Glasgow First | Andrina Morrison | 0.57% | 43 | |||||||
Electorate: 18,117 Valid: 7,558 Spoilt: 178 Quota: 1,890 Turnout: 42.70% |
2007: 1×SNP; 1×Lab; 1×Lib Dem
2012: 1×SNP; 1×Lab; 1×Green
2007–2012 change: Green gain one seat from Lib Dem
Result based on original count
Party | Candidate | FPv% | Count | ||||||||
---|---|---|---|---|---|---|---|---|---|---|---|
1 | 2 | 3 | 4 | 5 | 6 | 7 | 8 | ||||
Labour | Archie Graham (incumbent) | 35.80% | 2,320 | ||||||||
SNP | Susan Aitken | 28.12% | 1,822 | ||||||||
Scottish Green | Liam Hainey | 8.50% | 551 | 690 | 705 | 745 | 834 | 895 | 1,180 | 1,560 | |
SNP | Alex Hewetson | 9.49% | 615 | 692 | 852 | 859 | 892 | 929 | 1,059 | ||
Liberal Democrats | Paul Coleshill (incumbent) | 7.25% | 470 | 567 | 575 | 592 | 606 | 808 | |||
Conservative | Russell Munn | 7.38% | 478 | 512 | 515 | 517 | 524 | ||||
TUSC | Ronnie Stevenson | 2.42% | 157 | 213 | 216 | 238 | |||||
Glasgow First | Cayleigh Dornan | 1.03% | 67 | 116 | 120 | ||||||
Electorate: 18,902 Valid: 6,480 Spoilt: 88 Quota: 1,621 Turnout: 34.75% |
It was announced by Glasgow City Council on Thursday 10 May 2012 that Box 139, containing approximately 385 papers, was not counted in the vote despite them being registered and scanned. Permission was obtained from Glasgow Sheriff Court to examine the ballots and rerun the calculation. The two highest scoring candidates were mathematically assured of their place, however the third candidate, Liam Hainey, could have had his election overturned. [6] After the ballots were rescanned on 16 May 2012 and the result recalculated, he retained his seat. [7]
2007: 2×Lab; 1×SNP; 1×GRN
2012: 2×Lab; 2×SNP
2007–2012 change: SNP gain one seat from Green
Party | Candidate | FPv% | Count | |||||||||
---|---|---|---|---|---|---|---|---|---|---|---|---|
1 | 2 | 3 | 4 | 5 | 6 | 7 | 8 | 9 | ||||
Labour | James Scanlon (incumbent) | 32.01% | 2,226 | |||||||||
SNP | Jahangir Hanif (incumbent) | 20.73% | 1,442 | |||||||||
Labour | Soryia Siddique | 12.29% | 855 | 1,482 | ||||||||
SNP | Mhairi Hunter | 15.08% | 1,049 | 1,081 | 1,092 | 1,135 | 1,140 | 1,154 | 1,180 | 1,203 | 1,418 | |
Independent | Anne-Marie Millar (incumbent) | 7.68% | 534 | 584 | 597 | 598 | 604 | 612 | 633 | 673 | 822 | |
Scottish Green | Moira Crawford | 6.40% | 445 | 461 | 467 | 468 | 480 | 492 | 550 | 602 | ||
Conservative | Thomas Connor | 2.50% | 174 | 178 | 179 | 179 | 186 | 196 | 208 | |||
Scottish Socialist | Bill Bonnar | 2.01% | 140 | 148 | 152 | 152 | 154 | 155 | ||||
Liberal Democrats | David Jago | 0.79% | 55 | 60 | 63 | 63 | 64 | |||||
Britannica Party | Jean Douglas | 0.50% | 35 | 37 | 38 | 38 | ||||||
Electorate: 22,892 Valid: 6,955 Spoilt: 284 Quota: 1,385 Turnout: 7,239 (31.62%) |
2007: 2×Lab; 1×SNP
2012: 2×Lab; 1×SNP
2007–2012 change: No change
Party | Candidate | FPv% | Count | |||||||||||||
---|---|---|---|---|---|---|---|---|---|---|---|---|---|---|---|---|
1 | 2 | 3 | 4 | 5 | 6 | 7 | 8 | 9 | 10 | 11 | 12 | 13 | ||||
Labour | George Redmond (incumbent) | 35.0 | 1,595 | |||||||||||||
Labour | Yvonne Kucuk | 19.6 | 892 | 1,220.9 | ||||||||||||
SNP | Alison Thewliss (incumbent) | 15.3 | 695 | 714.1 | 720.2 | 720.2 | 726.2 | 737.2 | 747.9 | 757.8 | 762.8 | 782.3 | 800.7 | 855.6 | 1,449.8 | |
SNP | Alexander Belic | 14.7 | 672 | 681.9 | 688.7 | 690.7 | 692.1 | 699.1 | 701.5 | 718.6 | 721.2 | 740.2 | 756.6 | 779.8 | ||
Scottish Green | Andy Reid | 3.0 | 135 | 140.9 | 145.9 | 148.3 | 151.2 | 162.4 | 176.5 | 180.8 | 189.3 | 208.1 | 231.7 | |||
Conservative | Scott Gillespie | 2.6 | 120 | 123.4 | 124.9 | 125.9 | 127.9 | 127.9 | 135.8 | 138.8 | 184.3 | 193.8 | ||||
Glasgow First | Duncan Miller | 2.9 | 131 | 141.8 | 146.6 | 146.6 | 149.2 | 151.5 | 151.7 | 151.9 | 181.3 | |||||
Scottish Unionist | Gordon Kirker | 2.4 | 109 | 118.9 | 121 | 124 | 125 | 126.4 | 126.4 | 129.4 | ||||||
No description | Gary Barton | 1.6 | 71 | 74.4 | 76.4 | 76.4 | 81.5 | 81.6 | 82.7 | |||||||
Liberal Democrats | Harvey Sussock | 0.9 | 43 | 45.3 | 47.4 | 47.4 | 50.4 | 50.9 | ||||||||
Scottish Socialist | Murdo Ritchie | 0.9 | 43 | 45.3 | 48.9 | 48.9 | 50 | |||||||||
Independent | Thomas Rannachan | 0.9 | 41 | 43.3 | 45.1 | 45.4 | ||||||||||
Britannica Party | Martin Clark | 0.2 | 9 | 9.6 | 9.9 | |||||||||||
Electorate: 18,140 Valid: 4,556 Spoilt: 191 Quota: 1,140 Turnout: 4,722 (26.03%) |
2007: 2×Lab; 1×SNP; 1×GRN
2012: 2×Lab; 1×SNP; 1×GRN
2007–2012 change: No change
Party | Candidate | FPv% | Count | |||||||||||
---|---|---|---|---|---|---|---|---|---|---|---|---|---|---|
1 | 2 | 3 | 4 | 5 | 6 | 7 | 8 | 9 | 10 | 11 | ||||
Labour | Philip Braat (incumbent) | 29.4 | 1,561 | |||||||||||
Labour | Gordon Matheson (incumbent) | 20.9 | 1,113 | |||||||||||
SNP | Martin Docherty | 19.9 | 1,057 | 1,122.3 | ||||||||||
Scottish Green | Nina Baker (incumbent) | 10.5 | 558 | 652.2 | 656.6 | 662.6 | 665.6 | 676.2 | 704.3 | 753.2 | 809 | 891.8 | 1,163.5 | |
SNP | Craig MacKay (incumbent) | 9.7 | 516 | 541.5 | 587.8 | 592.3 | 592.3 | 596 | 605.5 | 628.4 | 645.2 | 683.3 | ||
Conservative | David Barnes | 4.7 | 249 | 273.5 | 274.4 | 276.3 | 279.3 | 280.8 | 283.9 | 283.9 | 314.3 | |||
Liberal Democrats | Ewan Hoyle | 1.7 | 89 | 112.9 | 113.9 | 116 | 117.3 | 120 | 126.4 | 129.4 | ||||
Solidarity | Graham Campbell | 1.7 | 89 | 110.9 | 112.1 | 113.2 | 113.2 | 115.3 | 118.3 | |||||
Pirate | Rob Harris | 0.9 | 46 | 53.9 | 54.4 | 54.8 | 58.5 | 60.9 | ||||||
Glasgow First | Alexander McDowell | 0.4 | 20 | 30.8 | 31.2 | 32.4 | 36 | |||||||
Britannica Party | James Moir Robertson | 0.3 | 17 | 19.2 | 19.2 | 19.4 | ||||||||
Electorate: 23,063 Valid: 5,315 Spoilt: 191 Quota: 1,064 Turnout: 5,442 (23.60%) |
2007: 1×SNP; 1×GRN; 1×Lib Dem; 1×Lab
2012: 1×SNP; 1×GRN; 2×Lab
2007–2012 change: Labour gain one seat from Lib Dem
Party | Candidate | FPv% | Count | |||||||||||||
---|---|---|---|---|---|---|---|---|---|---|---|---|---|---|---|---|
1 | 2 | 3 | 4 | 5 | 6 | 7 | 8 | 9 | 10 | 11 | 12 | 13 | ||||
SNP | Ken Andrew (incumbent) | 24.62% | 1,424 | |||||||||||||
Scottish Green | Martha Wardrop (incumbent) | 17.62% | 1,019 | 1,037 | 1,037 | 1,039 | 1,049 | 1,055 | 1,099 | 1,185 | ||||||
Labour | Martin McElroy | 17.31% | 1,001 | 1,015 | 1,018 | 1,019 | 1,023 | 1,030 | 1,041 | 1,068 | 1,071 | 1,129 | 1,211 | |||
Labour | Pauline McKeever | 12.14% | 702 | 709 | 710 | 711 | 712 | 712 | 720 | 741 | 746 | 799 | 835 | 880 | 1,019 | |
SNP | Mark Smith | 8.44% | 488 | 676 | 676 | 678 | 682 | 683 | 690 | 711 | 720 | 780 | 826 | 827 | ||
Conservative | Alexander Inglis | 6.54% | 378 | 380 | 383 | 386 | 394 | 413 | 415 | 464 | 465 | 541 | ||||
Independent | Ruth Simpson | 5.79% | 335 | 340 | 340 | 340 | 343 | 355 | 356 | 386 | 391 | |||||
Liberal Democrats | Kenneth Elder (incumbent) | 4.10% | 237 | 244 | 245 | 248 | 252 | 255 | 259 | |||||||
Scottish Socialist | Frances Curran | 1.42% | 82 | 86 | 86 | 86 | 87 | 89 | ||||||||
UKIP | Neil Craig | 0.85% | 49 | 51 | 56 | 57 | 65 | |||||||||
Scottish Christian | Murdo MacLeod | 0.74% | 43 | 44 | 44 | 46 | ||||||||||
Glasgow First | Iain Firth | 0.22% | 13 | 14 | 15 | |||||||||||
Britannica Party | Charles Baillie | 0.21% | 12 | 13 | ||||||||||||
Electorate: 20,981 Valid: 5,783 Spoilt: 113 Quota: 1,157 Turnout: 28.10% |
2007: 1×SNP; 1×Lib Dem; 1×Lab; 1×GRN
2012: 2×SNP; 1×Lab; 1×GRN
2007–2012 change: SNP gain one seat from Lib Dem
Party | Candidate | FPv% | Count | |||||||||||||
---|---|---|---|---|---|---|---|---|---|---|---|---|---|---|---|---|
1 | 2 | 3 | 4 | 5 | 6 | 7 | 8 | 9 | 10 | 11 | 12 | 13 | ||||
Labour | Aileen Colleran (incumbent) [lower-alpha 1] | 19.97% | 1,884 | 1,885 | 1,890 | |||||||||||
Scottish Green | Martin Bartos | 14.71% | 1,388 | 1,388 | 1,392 | 1,392 | 1,395 | 1,409 | 1,418 | 1,478 | 1,662 | 1,946 | ||||
SNP | Feargal Dalton | 18.63% | 1,757 | 1,757 | 1,758 | 1,758 | 1,759 | 1,760 | 1,767 | 1,776 | 1,813 | 1,913 | ||||
SNP | Kenny McLean (incumbent) | 14.87% | 1,403 | 1,403 | 1,403 | 1,403 | 1,405 | 1,410 | 1,421 | 1,434 | 1,479 | 1,538 | 1,553 | 1,575 | 1,813 | |
Labour | Michael Shanks | 12.13% | 1,144 | 1,144 | 1,147 | 1,149 | 1,153 | 1,156 | 1,167 | 1,190 | 1,258 | 1,380 | 1,394 | 1,395 | ||
Conservative | John Anderson | 10.33% | 974 | 977 | 979 | 979 | 995 | 1,017 | 1,041 | 1,041 | 1,161 | |||||
Liberal Democrats | James Paris | 5.54% | 523 | 525 | 526 | 526 | 532 | 534 | 540 | 540 | ||||||
Scottish Socialist | Andrew Gray | 1.19% | 112 | 112 | 113 | 113 | 113 | 113 | 114 | |||||||
Scottish Christian | Donald Williamson | 0.96% | 91 | 91 | 91 | 91 | 95 | 102 | ||||||||
UKIP | Stuart Maskell | 0.68% | 64 | 65 | 65 | 65 | 77 | |||||||||
Scottish Unionist | Catherine Findlay | 0.43% | 41 | 59 | 60 | 60 | ||||||||||
Glasgow First | Nicholas Black | 0.29% | 27 | 27 | ||||||||||||
Scottish Unionist | Robert Findlay | 0.27% | 25 | |||||||||||||
Electorate: 25,686 Valid: 9,433 Spoilt: 198 Quota: 1,887 Turnout: 9,631 (37.50%) |
2007: 3×Lab; 1×SNP
2012: 3×Lab; 1×SNP
2007–2012 change: No change
Party | Candidate | FPv% | Count | |||||||||||||
---|---|---|---|---|---|---|---|---|---|---|---|---|---|---|---|---|
1 | 2 | 3 | 4 | 5 | 6 | 7 | 8 | 9 | 10 | 11 | 12 | 13 | ||||
Labour | Liz Cameron (incumbent) | 28.0 | 2,295 | |||||||||||||
Labour | Paul Rooney (incumbent) | 27.0 | 2,220 | |||||||||||||
SNP | Graeme Hendry (incumbent) | 22.2 | 1,820 | |||||||||||||
Labour | John Kelly | 6.6 | 541 | 993.4 | 1,417 | 1,422.1 | 1,427.4 | 1,432.9 | 1,439.4 | 1,459.3 | 1,491.9 | 1,512.2 | 1,541.4 | 1,606.6 | 1,712.3 | |
SNP | David Wilson | 4.9 | 400 | 430.4 | 465.1 | 604.1 | 609.1 | 612.4 | 620.6 | 632 | 654.8 | 689.1 | 716 | 791.5 | ||
Scottish Green | Martin Schmierer | 2.7 | 221 | 240.6 | 252.1 | 259.6 | 263.9 | 273.8 | 279.3 | 303 | 309.3 | 350.6 | 400.8 | |||
Conservative | Susan McCourt | 2.6 | 215 | 226.7 | 231.6 | 233.5 | 235.9 | 235.9 | 249.9 | 267.9 | 286.7 | 311.6 | ||||
Independent | Phil Jarvis | 1.8 | 151 | 164.7 | 174 | 176.9 | 177.8 | 180 | 205 | 211.2 | 239.2 | |||||
Scottish Christian | John Cormack | 1.6 | 135 | 149.2 | 154.7 | 156.7 | 156.7 | 157.7 | 164.1 | 169.2 | ||||||
Liberal Democrats | James Speirs | 1.1 | 90 | 98.3 | 103.5 | 105.7 | 106.8 | 109.8 | 112.5 | |||||||
UKIP | Ian Cumming | 0.8 | 69 | 80.4 | 84 | 86.4 | 86.7 | 89.7 | ||||||||
TUSC | Ryan Stuart | 0.4 | 29 | 31.6 | 32.3 | 32.5 | 35.2 | |||||||||
Glasgow First | Mark Muir | 0.3 | 22 | 23.9 | 27.6 | 28.4 | ||||||||||
Electorate: 21,743 Valid: 8,208 Spoilt: 258 Quota: 1,642 Turnout: 8,466 (39.94%) |
2007: 3×Lab; 1×SNP
2012: 3×Lab; 1×SNP
2007–2012 change: No change
Party | Candidate | FPv% | Count | ||||||||||
---|---|---|---|---|---|---|---|---|---|---|---|---|---|
1 | 2 | 3 | 4 | 5 | 6 | 7 | 8 | 9 | 10 | ||||
Labour | Paul Carey (incumbent) | 30.65% | 2,075 | ||||||||||
Labour | Jon Findlay (incumbent) | 17.70% | 1,198 | 1,552 | |||||||||
SNP | Malcolm Balfour | 19.82% | 1,342 | 1,388 | |||||||||
Labour | Judith Fisher | 13.01% | 881 | 1,079 | 1,235 | 1,236 | 1,241 | 1,243 | 1,247 | 1,274 | 1,328 | 1,378 | |
SNP | John Docherty | 9.44% | 639 | 665 | 676 | 705 | 709 | 713 | 717 | 747 | 807 | 854 | |
Conservative | Martyn McIntyre | 3.62% | 245 | 248 | 251 | 252 | 253 | 255 | 260 | 292 | 315 | ||
Scottish Green | Alastair Whitelaw | 2.63% | 178 | 183 | 187 | 188 | 196 | 199 | 216 | 251 | |||
Liberal Democrats | Paul McGarry | 1.96% | 133 | 139 | 142 | 143 | 143 | 146 | 150 | ||||
Independent | James Trolland | 0.50% | 34 | 34 | 35 | 35 | 39 | 45 | |||||
Glasgow First | Gerrard O'Neill McCue | 0.30% | 20 | 26 | 28 | 28 | 30 | ||||||
TUSC | Eric Stevenson | 0.37% | 25 | 26 | 27 | 27 | |||||||
Electorate: 21,288 Valid: 6,770 Spoilt: 180 Quota: 1,355 Turnout: 32.65% |
2007: 2×Lab; 1×SNP; 1×Lib Dem
2012: 2×Lab; 2×SNP;
2007–2012 change: SNP gain one seat from Lib Dem
Party | Candidate | FPv% | Count | ||||||||
---|---|---|---|---|---|---|---|---|---|---|---|
1 | 2 | 3 | 4 | 5 | 6 | 7 | 8 | ||||
Labour | Martin Rhodes | 23.6% | 1,792 | ||||||||
SNP | John Letford | 23.2% | 1,761 | ||||||||
Labour | Mohammed Razaq (incumbent) | 16.0% | 1,215 | 1,425 | 1,436 | 1,466 | 1,509 | 1,652 | |||
SNP | Franny Scally | 11.2% | 854 | 863 | 1,044 | 1,073 | 1,098 | 1,260 | 1,283 | 1,574 | |
Liberal Democrats | Alex Dingwall (incumbent) | 9.2% | 703 | 715 | 724 | 733 | 1,007 | 1,217 | 1,236 | ||
Scottish Green | Steen Parish | 7.3% | 555 | 564 | 580 | 645 | 716 | ||||
Conservative | Euan Erskine | 7.7% | 582 | 585 | 589 | 593 | |||||
Scottish Socialist | Liam Turbett | 1.9% | 143 | 146 | 148 | ||||||
Electorate: 22,610 Valid: 7,605 Spoilt: 179 Quota: 1,522 Turnout: 34.43% |
2007: 2×Lab; 1×SNP; 1×GRN
2012: 2×Lab; 1×SNP; 1×GRN
2007–2012 change: No change
Party | Candidate | FPv% | Count | ||||||||||||
---|---|---|---|---|---|---|---|---|---|---|---|---|---|---|---|
1 | 2 | 3 | 4 | 5 | 6 | 7 | 8 | 9 | 10 | 11 | 12 | ||||
Labour | Chris Kelly [lower-alpha 1] | 29.61% | 1,869 | ||||||||||||
SNP | Billy McAllister (incumbent) [lower-alpha 2] | 22.83% | 1,441 | ||||||||||||
Labour | Helen Stephen | 14.89% | 940 | 1,424 | |||||||||||
Scottish Green | Kieran Wild (incumbent) | 9.27% | 585 | 596 | 601 | 622 | 623 | 634 | 667 | 724 | 767 | 797 | 846 | 1,159 | |
SNP | Gavin Roberts | 8.44% | 533 | 547 | 696 | 708 | 709 | 715 | 735 | 747 | 758 | 775 | 813 | ||
Socialist Labour | Jim Berrington | 4.29% | 271 | 289 | 293 | 310 | 311 | 313 | 342 | 345 | 351 | 372 | |||
Scottish Unionist | Brian Brown | 3.91% | 247 | 254 | 256 | 261 | 275 | 278 | 290 | 292 | 332 | ||||
Conservative | Margaret Walker | 2.34% | 148 | 151 | 151 | 154 | 157 | 160 | 160 | 184 | |||||
Liberal Democrats | Caroline Johnston | 1.84% | 116 | 119 | 121 | 126 | 126 | 127 | 129 | ||||||
TUSC | Angela McCormick | 1.70% | 107 | 113 | 116 | 121 | 122 | 127 | |||||||
Glasgow First | Fay Dornan | 0.54% | 34 | 36 | 38 | 41 | 43 | ||||||||
Scottish Unionist | Graham Nicholls | 0.33% | 21 | 24 | 25 | 27 | |||||||||
Electorate: 23,679 Valid: 6,312 Spoilt: 255 Quota: 1,263 Turnout: 27.73 % |
2007: 2×Lab; 1×SNP
2012: 2×Lab; 1×SNP
2007–2012 change: No change
Party | Candidate | FPv% | Count | |||||||||||
---|---|---|---|---|---|---|---|---|---|---|---|---|---|---|
1 | 2 | 3 | 4 | 5 | 6 | 7 | 8 | 9 | ||||||
Labour | Gilbert Davidson | 40.5 | 1,643 | |||||||||||
Labour | Allan Stewart (incumbent) | 17.2 | 699 | 1,184.4 | ||||||||||
SNP | Phil Greene (incumbent) | 21.9 | 888 | 932.6 | 948 | 949 | 951.1 | 960.4 | 971.1 | 978.5 | 1,039.5 | |||
SNP | James Oakes | 8.1 | 330 | 342.6 | 349.7 | 351.8 | 353.9 | 355.5 | 372.8 | 384.9 | 419.8 | |||
Independent | Joe Chambers | 5.9 | 240 | 257.2 | 273. | 278.9 | 283.1 | 295.2 | 316.5 | 343.3 | ||||
Conservative | Jason Eccles | 2.7 | 111 | 115.9 | 120.6 | 120.6 | 122.1 | 134.2 | 139.3 | |||||
Scottish Green | John Stuart | 1.5 | 61 | 65.6 | 76.8 | 87.6 | 92.1 | 101 | ||||||
Liberal Democrats | Sophie Bridger | 1.1 | 45 | 49.6 | 53.9 | 53.9 | 61.5 | |||||||
Glasgow First | Christopher Henderson | 0.5 | 21 | 28.3 | 35.8 | 36.1 | ||||||||
TUSC | Luke Ivory | 0.5 | 22 | 24.3 | 26.9 | |||||||||
Electorate: 15,717 Valid: 4,060 Spoilt: 191 Quota: 1,016 Turnout: 4,251 (27.05%) |
2007: 3×Lab; 1×SNP
2012: 3×Lab; 1×SNP
2007–2012 changes: No change
Party | Candidate | FPv% | Count | |||||||||||
---|---|---|---|---|---|---|---|---|---|---|---|---|---|---|
1 | 2 | 3 | 4 | 5 | 6 | 7 | 8 | 9 | 10 | 11 | ||||
Labour | Frank Docherty (incumbent) | 26.4 | 1,846 | |||||||||||
SNP | Jennifer Dunn (incumbent) | 21.8 | 1,523 | |||||||||||
Labour | Elaine McDougall (incumbent) | 18.2 | 1,272 | 1,581.4 | ||||||||||
Labour | Russell Robertson [lower-alpha 1] | 14.0 | 981 | 1,043.9 | 1,176.6 | 1,179.7 | 1,184.6 | 1,199.6 | 1,207.6 | 1,245.7 | 1,285.1 | 1,383.5 | 1,527.7 | |
SNP | Colin Rullkotter | 5.9 | 414 | 423.2 | 427.3 | 523.5 | 526.5 | 532.6 | 540 | 566.3 | 605 | 735.5 | ||
Scottish Green | Nina Ballantyne | 4.8 | 335 | 351 | 356.5 | 363.6 | 371.5 | 390.3 | 404.8 | 460.9 | 520.8 | |||
Conservative | Keenan Alexander | 4.0 | 280 | 283.4 | 285.3 | 286.6 | 288.9 | 302.7 | 328.1 | 334.5 | ||||
Scottish Socialist | Daniel O'Donnell | 2.2 | 154 | 159.3 | 162.2 | 166.1 | 168.2 | 171.5 | 176.8 | |||||
UKIP | Steven Laird | 1.2 | 82 | 84.2 | 85.3 | 86.5 | 94.6 | 94.9 | ||||||
Liberal Democrats | Alan Lee | 0.9 | 62 | 66.4 | 67.4 | 69.3 | 74.9 | |||||||
Glasgow First | Fraser Paterson | 0.6 | 39 | 42.9 | 45.8 | 47 | ||||||||
Electorate: 22,939 Valid: 6,988 Spoilt: 198 Quota: 1,398 Turnout: 7,186 (31.33%) |
2007: 3×Lab; 1×SNP
2012: 3×Lab; 1×SNP
2007–2012 change: No change
Party | Candidate | FPv% | Count | |||||||||
---|---|---|---|---|---|---|---|---|---|---|---|---|
1 | 2 | 3 | 4 | 5 | 6 | 7 | 8 | 9 | ||||
Labour | Frank McAveety | 28.3 | 1,989 | |||||||||
Labour | George Ryan (incumbent) | 20.1 | 1,415 | |||||||||
SNP | John McLaughlin (incumbent) | 17.8 | 1,251 | 1,283.1 | 1,283.2 | 1,285.2 | 1,288.8 | 1,301.1 | 1,331.4 | 1,358.4 | 2,168.1 | |
Labour | Anne Simpson | 12.1 | 852 | 1,289.1 | 1,293.9 | 1,300.9 | 1,317.8 | 1,333.6 | 1,359.8 | 1,400.5 | 1,444.9 | |
SNP | Adam Miller | 13.1 | 921 | 937.9 | 938.1 | 942.1 | 950.4 | 964.9 | 980.9 | 1,006.2 | ||
Conservative | Alan Sullivan | 4.2 | 294 | 298.9 | 299 | 313.3 | 314.3 | 332.9 | 344.9 | |||
Scottish Green | Stuart Leckie | 1.5 | 105 | 115.5 | 115.6 | 126.6 | 144.1 | 165.3 | ||||
Glasgow First | Andy Muir | 1.4 | 98 | 109.7 | 109.7 | 111 | 119.3 | |||||
Scottish Socialist | Colin Rutherford | 0.9 | 63 | 69.1 | 69.2 | 71.2 | ||||||
Liberal Democrats | Marjory Watt | 0.7 | 52 | 52.9 | 52.9 | |||||||
Electorate: 21,408 Valid: 7,040 Spoilt: 174 Quota: 1,409 Turnout: 7,214 (33.70%) |
2007: 2×Lab; 2×SNP
2012: 2×Lab; 2×SNP
2007–2012 changes: No change
Party | Candidate | FPv% | Count | |||||||||
---|---|---|---|---|---|---|---|---|---|---|---|---|
1 | 2 | 3 | 4 | 5 | 6 | 7 | 8 | 9 | ||||
Labour | Jim Coleman (incumbent) | 36.3% | 2,894 | |||||||||
SNP | David Turner (incumbent) | 20.2% | 1,615 | |||||||||
Labour | Marie Garrity | 14.5% | 1,154 | 2,233 | ||||||||
SNP | Austin Sheridan | 17% | 1,357 | 1,395 | 1,463 | 1,478 | 1,493 | 1,505 | 1,529 | 1,572 | 1,636 | |
Conservative | Raymond McCrae | 5.2% | 413 | 424 | 451 | 451 | 466 | 486 | 492 | 504 | 538 | |
Glasgow First | Andy Muir (incumbent) | 1.8% | 146 | 175 | 226 | 227 | 234 | 252 | 280 | 346 | ||
Scottish Green | David Weir | 1.8% | 143 | 153 | 202 | 203 | 218 | 236 | 269 | |||
Scottish Socialist | Margaret Bean | 1.3% | 103 | 115 | 160 | 161 | 164 | 168 | ||||
UKIP | Arthur Thackeray | 1.1% | 91 | 96 | 106 | 107 | 109 | |||||
Liberal Democrats | James McHale | 0.8% | 65 | 70 | 92 | 92 | ||||||
Electorate: 24,426 Valid: 7,981 Spoilt: 203 Quota: 1,597 Turnout: 33.51% |
2007: 3×Lab; 1×SNP
2012: 3×Lab; 1×SNP
2007–2012 changes: No change
Party | Candidate | FPv% | Count | ||
---|---|---|---|---|---|
1 | 2 | ||||
Labour | Maureen Burke | 29.18% | 1,958 | ||
SNP | Gerry Boyle | 20.53% | 1,378 | ||
Labour | Gerry Leonard (incumbent) | 20.04% | 1,345 | ||
Labour | Sohan Singh | 14.39% | 966 | 1,411 | |
SNP | Tony Kenny | 9.12% | 612 | 647 | |
Conservative | Kim Schmulian | 3.13% | 210 | 215 | |
Scottish Green | Stuart Clay [lower-alpha 1] | 1.76% | 118 | 141 | |
Liberal Democrats | John C. MacPherson | 1.13% | 76 | 85 | |
TUSC | Jamie Cocozza | 0.72% | 48 | 58 | |
Electorate: 25,247 Valid: 6,711 Spoilt: 242 Quota: 1,343 Turnout: 27.54% |
On 23 July 2013 SNP councillor Allison Hunter died from cancer. A by-election was held on 10 October 2013 and was won by Labour's John Kane. [12]
Party | Candidate | FPv% | Count | |||||||||||||
---|---|---|---|---|---|---|---|---|---|---|---|---|---|---|---|---|
1 | 2 | 3 | 4 | 5 | 6 | 7 | 8 | 9 | 10 | 11 | 12 | 13 | ||||
Labour | John Kane | 43.4 | 2,055 | 2,055 | 2,056 | 2,058 | 2,062 | 2,075 | 2,082 | 2,108 | 2,137 | 2,149 | 2,180 | 2,216 | 2,417 | |
SNP | Helen Walker | 30.1 | 1,424 | 1,425 | 1,426 | 1,431 | 1,435 | 1,449 | 1,456 | 1,466 | 1,485 | 1,497 | 1,541 | 1,575 | 1,678 | |
No Bedroom Tax | John Flanagan | 9.4 | 446 | 446 | 449 | 455 | 466 | 479 | 483 | 487 | 501 | 515 | 539 | 562 | ||
Conservative | Richard Sullivan | 4.5 | 215 | 215 | 216 | 216 | 216 | 218 | 229 | 237 | 243 | 269 | 293 | |||
UKIP | Janice MacKay | 2.4 | 113 | 113 | 116 | 116 | 116 | 116 | 119 | 120 | 126 | |||||
Scottish Green | Moira Crawford | 2.4 | 112 | 112 | 113 | 116 | 125 | 129 | 131 | 142 | 150 | 158 | ||||
Independent | George Laird | 2.2 | 103 | 102 | 102 | 104 | 104 | 105 | 113 | 117 | ||||||
Liberal Democrats | Ewan Hoyle | 1.5 | 73 | 73 | 74 | 75 | 76 | 76 | 84 | |||||||
Scottish Christian | John Cormack | 1.3 | 60 | 60 | 61 | 62 | 65 | 65 | ||||||||
Independent | Thomas Rannachan | 1.1 | 52 | 52 | 52 | 52 | 53 | |||||||||
Communist | Ryan Boyle | 0.7 | 35 | 35 | 35 | 37 | ||||||||||
Solidarity | Joyce Drummond | 0.6 | 28 | 28 | 29 | |||||||||||
Britannica Party | Charles Baillie | 0.4 | 19 | |||||||||||||
SDA | James Trolland | 0.0 | 1 | |||||||||||||
Electorate: 24,203 Valid: 4,736 Spoilt: 120 Quota: 2,369 Turnout: 4,856 (20.06%) |
On 7 October 2013 Shettleston Labour councillor George Ryan died suddenly. A by-election was held on 5 December 2013 and the seat was retained by Labour's Martin Neill. [14]
Party | Candidate | FPv% | Count | |
---|---|---|---|---|
1 | ||||
Labour | Martin Neill | 53.6 | 2026 | |
SNP | Laura Docherty | 28.7 | 1086 | |
Conservative | Raymond McCrae | 5.9 | 224 | |
UKIP | Arthur Misty Thackeray | 3.4 | 129 | |
TUSC | Jamie Cocozza | 1.8 | 68 | |
Liberal Democrats | James Speirs | 1.4 | 53 | |
No Bedroom Tax | John Flanagan | 1.3 | 50 | |
Scottish Green | Alasdair Duke | 1.1 | 41 | |
Scottish Socialist | Tommy Ball | 0.9 | 35 | |
Christian | Victor Murphy | 0.9 | 34 | |
Britannica Party | Charlie Baillie | 0.8 | 31 | |
SDA | James Trolland | 0.2 | 6 | |
Electorate: 21,926 Valid: 3,783 Spoilt: 65 Quota: 1,892 Turnout: 3,777 (17.55) |
On 14 May 2015, Green Party councillor Liam Hainey (Langside) resigned his seat for family and health reasons. [16] On the same day, SNP councillors Alison Thewliss (Calton) and Martin Docherty (Anderston/City) resigned their seats after having been elected as MPs for the constituencies of, respectively, Glasgow Central [17] and West Dunbartonshire. [18] Finally, on 10 June 2015, SNP councillor Iris Gibson (Craigton) retired due to ill health. [19] By-elections for all of these were held on 6 August 2015.
Party | Candidate | FPv% | Count | ||||||
---|---|---|---|---|---|---|---|---|---|
1 | 2 | 3 | 4 | 5 | 6 | ||||
SNP | Eva Bolander | 48.1% | 1,441 | 1,444 | 1,446 | 1,457 | 1,473 | 1,750 | |
Labour | Katie Ford | 28.6% | 857 | 857 | 866 | 881 | 943 | 1,024 | |
Scottish Green | Christy Mearns | 13.8% | 414 | 414 | 421 | 442 | 467 | ||
Conservative | Ary Jaff | 5.5% | 164 | 166 | 173 | 184 | |||
Liberal Democrats | Gary McLelland | 2.2% | 66 | 68 | 70 | ||||
UKIP | Janice MacKay | 1.4% | 43 | 45 | |||||
Scottish Libertarian | Stevie Creighton | 0.4% | 12 | ||||||
Electorate: 23,285 Valid: 2997 Spoilt: 39 Quota: 1499 Turnout: 3036 (14.5%) |
Party | Candidate | FPv% | Count | |
---|---|---|---|---|
1 | ||||
SNP | Greg Hepburn | 55.5% | 1,507 | |
Labour | Thomas Rannachan | 30% | 814 | |
Conservative | Thomas Kerr | 4.7% | 129 | |
UKIP | Karen King | 3.8% | 103 | |
Scottish Green | Malachy Clarke | 3.6% | 99 | |
Independent | Tommy Ramsay | 1.7% | 47 | |
Liberal Democrats | Chris Young | 0.7% | 18 | |
Electorate: 19,333 Valid: 2,717 Spoilt: 50 Quota: 1,359 Turnout: 2,767 (16.17%) |
Party | Candidate | FPv% | Count | |
---|---|---|---|---|
1 | ||||
SNP | Alex Wilson | 54.2% | 2,674 | |
Labour | Kevin O'Donnell | 33.3% | 1,643 | |
Conservative | Philip Charles | 6.1% | 300 | |
Scottish Green | Katie Noble | 2.8% | 136 | |
UKIP | Arthur Misty Thackeray | 1.9% | 95 | |
Liberal Democrats | Isabel Nelson | 1.8% | 87 | |
Electorate: 24,119 Valid: 4,935 Spoilt: 71 Quota: 2,468 Turnout: 5,006 (21.64%) |
Party | Candidate | FPv% | Count | ||
---|---|---|---|---|---|
1 | 2 | ||||
SNP | Anna Richardson | 49.9% | 2134 | 2,143 | |
Labour | Eileen Dinning | 21.8% | 932 | 945 | |
Scottish Green | Robert Pollock | 13.5% | 579 | 598 | |
Conservative | Kyle Thornton | 8.9% | 379 | 379 | |
Liberal Democrats | Will Millinship | 2.9% | 125 | 125 | |
UKIP | Cailean Mongan | 1.5% | 65 | 66 | |
TUSC | Ian Leech | 1.4% | 62 | ||
Electorate: 20,938 Valid: 4,276 Spoilt: 27 Quota: 2,139 Turnout: 4,303 (21.7%) |
On 14 March 2016, Labour councillor Matheson resigned his seat as he had been appointed a visiting professor at Strathclyde University. [20] As a result, a by-election happened on 5 May 2016: it was won by the SNP's Angus Millar.
Party | Candidate | FPv% | Count | |||||
---|---|---|---|---|---|---|---|---|
1 | 2 | 3 | 4 | 5 | ||||
SNP | Angus Millar | 43.03% | 3,467 | 3,480 | 3,509 | 3,586 | 4,436 | |
Labour | Steven Livingston | 21.07% | 1,698 | 1,715 | 1,793 | 2,112 | 2,603 | |
Scottish Green | Christy Mearns | 20.12% | 1,621 | 1,637 | 1,710 | 1,869 | ||
Conservative | Philip Charles | 10.79% | 869 | 908 | 965 | |||
Liberal Democrats | Ryan Ross | 3.08% | 248 | 256 | ||||
UKIP | Karen King | 1.91% | 154 | |||||
Electorate: 20,995 Valid: 8,057 Spoilt: 133 Quota: 4,030 Turnout: 8,190 (39.18%) |
On 25 July 2016, Labour councillor John Kelly died as a result of motor neuron disease. [22] A by-election was held on 6 October 2016 and was won by the SNP's Chris Cunningham.
Party | Candidate | FPv% | Count | ||||||
---|---|---|---|---|---|---|---|---|---|
1 | 2 | 3 | 4 | 5 | 6 | ||||
SNP | Chris Cunningham | 42.6% | 2,135 | 2,140 | 2,150 | 2,275 | 2,321 | 2,906 | |
Labour | Ian Cruikshank | 38.8% | 1,944 | 1,953 | 1,984 | 2,037 | 2,204 | ||
Conservative | Ary Jaff | 10.2% | 510 | 536 | 553 | 564 | |||
Scottish Green | Gillian MacDonald | 4.8% | 242 | 247 | 261 | ||||
Liberal Democrats | James Speirs | 1.9% | 97 | 105 | |||||
UKIP | Donald MacKay | 1.7% | 83 | ||||||
Electorate: 21,419 Valid: 5,011 Spoilt: 83 Quota: 2,506 Turnout: 5,094 (23.8%) |
The 2012 Highland Council election took place on 3 May 2012 to elect members of Highland Council. The election used the twenty-two wards created as a result of the Local Governance (Scotland) Act 2004, with each ward electing three or four Councillors using the single transferable vote system and 80 Councillors being elected.
Elections to Angus Council were held on 3 May 2012 the same day as the other Scottish local government elections. The election used the eight wards, created as a result of the Local Governance (Scotland) Act 2004, with each ward electing three or four councillors using the single transferable vote system form of proportional representation, with 29 Councillors being elected.
Elections to Dundee City Council were held on 3 May 2012 on the same day as the other Scottish local government elections. The election used the eight wards created as a result of the Local Governance (Scotland) Act 2004, with each ward electing three or four Councillors using the single transferable vote system form of proportional representation, with 29 Councillors elected.
Elections to Aberdeenshire Council were held on 3 May 2012, on the same day as the other Scottish local government elections. The election used the 19 wards created as a result of the Local Governance (Scotland) Act 2004, with each ward electing three or four Councillors using the single transferable vote system form of proportional representation, with 68 Councillors being elected.
The 2012 Aberdeen City Council election took place on 3 May 2012 to elect members of Aberdeen City Council. The election used the 13 wards created as a result of the Local Governance (Scotland) Act 2004, with each ward electing three or four Councillors using the single transferable vote system a form of proportional representation, with 43 Councillors elected.
Elections to the City of Edinburgh Council were held on 3 May 2012, the same day as the 2012 Scottish local elections. The election was the second using 17 new wards created as a result of the Local Governance (Scotland) Act 2004, each ward elected three or four Councillors using the single transferable vote system form of proportional representation system of election.
Elections to Fife Council were held on 3 May 2012, the same day as the other Scottish local government elections. The election used the 23 wards created as a result of the Local Governance (Scotland) Act 2004, with each ward electing three or four Councillors using the single transferable vote system form of proportional representation, with 78 Councillors elected.
Elections to Stirling Council were held on 3 May 2012, the same day as the 31 other local authorities in Scotland. The election used the seven wards created under the Local Governance (Scotland) Act 2004, with 22 councillors being elected. Each ward will elect either three or four members, using the STV electoral system.
Elections to Inverclyde Council were held on 3 May 2012, the same day as the other 31 local authorities in Scotland. The election used the six wards created as a result of the Local Governance (Scotland) Act 2004, with each ward electing three or four Councillors using the single transferable vote system form of proportional representation, with 20 Councillors being elected in total.
The 2012 Midlothian Council election took place on 3 May 2012 to elect members of Midlothian Council. The election used the six wards created as a result of the Local Governance (Scotland) Act 2004, with each ward electing three or four Councillors using the single transferable vote system form of proportional representation, with 18 Councillors being elected.
2012 Elections to East Lothian Council were held on 3 May 2012, on the same day as the other Scottish local government elections. The election used the 7 wards created as a result of the Local Governance (Scotland) Act 2004, with each ward electing three or four councillors using the single transferable vote system form of proportional representation, with 23 councillors elected.
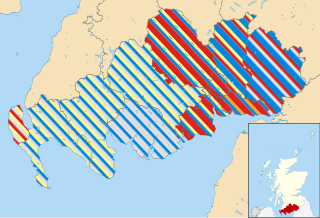
The 2012 Dumfries and Galloway Council election took place on 3 May 2012 to elect members of Dumfries and Galloway Council. The election used the thirteen wards created as a result of the Local Governance (Scotland) Act 2004, with each ward electing three or four councillors using the single transferable vote system form of proportional representation, with 47 councillors being elected.
Elections to North Lanarkshire Council were held on 3 May 2012 on the same day as the 31 other local authorities in Scotland. The election used the twenty wards created under the Local Governance (Scotland) Act 2004, with 70 Councillors being elected. Each ward elected either 3 or 4 members, using the STV electoral system.
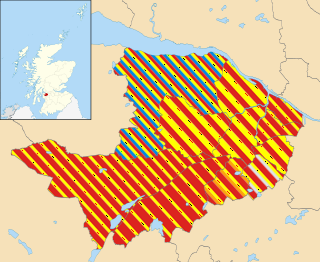
The 2012 Renfrewshire Council election took place on 3 May 2012 to elect members of Renfrewshire Council. The election used the eleven wards created as a result of the Local Governance (Scotland) Act 2004, with each ward electing three or four Councillors using the single transferable vote system a form of proportional representation, with 40 Councillors being elected.
Elections to East Dunbartonshire Council were held on 3 May 2012, the same day as the 31 other local authorities in Scotland. The election used the eight wards created under the Local Governance (Scotland) Act 2004, with 24 Councillors being elected. Each ward elected 3 members, using the STV electoral system.
The Glasgow City Council election of 2017 was held on 4 May 2017, the same day as the 31 other Scottish local government elections. The election was the first to use 23 new wards, created as a result of the Local Government Boundary Commission for Scotland's 5th Review. Each ward elected three or four councillors using the single transferable vote system, a form of proportional representation used since the 2007 election and according to the Local Governance (Scotland) Act 2004.
Elections to Dundee City Council were held on 4 May 2017 on the same day as the other Scottish local government elections. The election used the eight wards created as a result of the Local Governance (Scotland) Act 2004, with each ward electing three or four Councillors using the single transferable vote system. A total of 29 Councillors were elected.
Elections to Fife Council were held on 4 May 2017, the same day as the other Scottish local government elections. The election used the 22 wards created as a result of the Local Government Commission for Scotland's 5th review which was published in September 2016, with each ward electing three or four councillors using the single transferable vote system form of proportional representation, with 75 councillors elected; a decrease of three seats from 2012 as one ward, The Lochs, was abolished.
Elections to Aberdeenshire Council were held on 4 May 2017, on the same day as the other Scottish local government elections. The election used the 19 wards created as a result of the Local Governance (Scotland) Act 2004, with each ward electing three or four councillors using the single transferable vote system form of proportional representation, with 70 councillors being elected, an increase of two members compared to 2012.
The 2017 Highland Council election was held on 4 May 2017 to elect members of the Highland Council. The election used the 21 wards created under the Local Governance (Scotland) Act 2004; each ward elected three or four councillors using the single transferable vote system. A total of 74 councillors were elected, six less than in 2012.