The fourth election to the Powys County Council following local government reorganisation was held in May 2008. [1] It was preceded by the 2004 election and followed by the 2012 election. The election resulted once again in a majority of Independent councillors
There was an Independent Majority.
Party | Seats | Gains | Losses | Net gain/loss | Seats % | Votes % | Votes | +/− | |
---|---|---|---|---|---|---|---|---|---|
Independent | 45 | 0 | 9 | -9 | |||||
Liberal Democrats | 15 | 0 | 0 | 0 | |||||
Conservative | 9 | 9 | 0 | +9 | |||||
Labour | 4 | 0 | 0 | 0 | |||||
Plaid Cymru | 0 | 0 | 0 | 0 | 0.0 | ||||
Green | 0 | 0 | 0 | 0 | 0.0 |
Party | Candidate | Votes | % | ±% | |
---|---|---|---|---|---|
Labour | Cyril Gwyn Gwillim* | unopposed | |||
Labour hold | Swing | ||||
Party | Candidate | Votes | % | ±% | |
---|---|---|---|---|---|
Liberal Democrats | Claire Elizabeth Powell | 259 | |||
Independent | Stephen Davies* | 203 | |||
Conservative | Alastair John Scott | 116 | |||
Majority | |||||
Turnout | 59.0 | +59.0 | |||
Liberal Democrats gain from Independent | Swing | ||||
Party | Candidate | Votes | % | ±% | |
---|---|---|---|---|---|
Independent | Avril York | 607 | |||
Independent | Lily Jarman-Harris* | 324 | |||
Majority | |||||
Turnout | 49.0 | +49.0 | |||
Independent hold | Swing | ||||
Party | Candidate | Votes | % | ±% | |
---|---|---|---|---|---|
Liberal Democrats | Susan Kathryn Silk* | 286 | |||
Conservative | Alastair John Scott | 185 | |||
Majority | |||||
Turnout | 64.0 | +64.0 | |||
Liberal Democrats hold | Swing | ||||
Party | Candidate | Votes | % | ±% | |
---|---|---|---|---|---|
Liberal Democrats | John Gerwyn Morris* | 646 | |||
Conservative | David Thomas | 491 | |||
Majority | |||||
Turnout | 49.0 | +49.0 | |||
Liberal Democrats hold | Swing | ||||
Party | Candidate | Votes | % | ±% | |
---|---|---|---|---|---|
Labour | Sandra Christine Davies* | unopposed | |||
Labour hold | Swing | ||||
Party | Candidate | Votes | % | ±% | |
---|---|---|---|---|---|
Independent | Tony Thomas | 234 | |||
Independent | John Frederick Pratt | 173 | |||
Independent | John Rowland Price | 126 | |||
Majority | |||||
Turnout | 50.0 | +50.0 | |||
Independent hold | Swing | ||||
Party | Candidate | Votes | % | ±% | |
---|---|---|---|---|---|
Independent | Geraint George Hopkins* | unopposed | |||
Independent hold | Swing | ||||
Party | Candidate | Votes | % | ±% | |
---|---|---|---|---|---|
Conservative | Gareth William Ratcliffe | 395 | |||
Liberal Democrats | Charles James Gibson-Watt* | 325 | |||
Majority | 70 | ||||
Turnout | 56.0 | +12.0 | |||
Conservative gain from Liberal Democrats | Swing | ||||
Party | Candidate | Votes | % | ±% | |
---|---|---|---|---|---|
Independent | David Rowland Price* | unopposed | |||
Independent hold | Swing | ||||
Party | Candidate | Votes | % | ±% | |
---|---|---|---|---|---|
Liberal Democrats | Jeff Holmes | 184 | |||
Conservative | Andrew Lennox Stuart | 182 | |||
Majority | 2 | ||||
Turnout | 44.0 | -4.5 | |||
Liberal Democrats gain from Independent | Swing | ||||
Party | Candidate | Votes | % | ±% | |
---|---|---|---|---|---|
Liberal Democrats | Melanie Jade Brookes Tunnicliffe* | unopposed | |||
Liberal Democrats hold | Swing | ||||
Party | Candidate | Votes | % | ±% | |
---|---|---|---|---|---|
Independent | Muriel Rosemarie Harris* | unopposed | |||
Independent hold | Swing | ||||
Party | Candidate | Votes | % | ±% | |
---|---|---|---|---|---|
Independent | Timothy John Van Rees* | 573 | |||
Plaid Cymru | Thomas Gareth Morris | 110 | |||
Independent | Robert Douglas Nicholson | 67 | |||
Majority | |||||
Turnout | 51.0 | -7.0 | |||
Independent hold | Swing | ||||
Party | Candidate | Votes | % | ±% | |
---|---|---|---|---|---|
Independent | Evan Thomas Morgan* | unopposed | |||
Independent hold | Swing | ||||
Party | Candidate | Votes | % | ±% | |
---|---|---|---|---|---|
Independent | Andrew Martin Charles Weale* | 372 | |||
Conservative | Andrew Powell | 137 | |||
Majority | |||||
Turnout | 41.0 | +41.0 | |||
Independent hold | Swing | ||||
Party | Candidate | Votes | % | ±% | |
---|---|---|---|---|---|
Independent | David William Meredith | 528 | |||
Labour | Matthew James Dorrance | 430 | |||
Liberal Democrats | William Bryan Bufton* | 252 | |||
Conservative | Barbara Patricia Burgess | 250 | |||
Majority | |||||
Turnout | 54.0 | +12.0 | |||
Independent gain from Liberal Democrats | Swing | ||||
Party | Candidate | Votes | % | ±% | |
---|---|---|---|---|---|
Liberal Democrats | Paul James Ashton* | 350 | |||
Independent | Sharon Elaine Williams | 304 | |||
Conservative | Gareth Jones | 303 | |||
Majority | |||||
Turnout | 51.0 | +51.0 | |||
Liberal Democrats hold | Swing | ||||
Party | Candidate | Votes | % | ±% | |
---|---|---|---|---|---|
Liberal Democrats | William Denston Powell | Unopposed | N/A | N/A | |
Liberal Democrats hold | |||||
Party | Candidate | Votes | % | ±% | |
---|---|---|---|---|---|
Liberal Democrats | Liam Fitzpatrick | 513 | |||
Independent | Geraint James | 322 | |||
Majority | |||||
Turnout | 53.0 | +53.0 | |||
Liberal Democrats gain from Independent | Swing | ||||
Party | Candidate | Votes | % | ±% | |
---|---|---|---|---|---|
Independent | Krishn Pathak* | 483 | |||
Labour | David Arnold Thomas | 397 | |||
Majority | |||||
Turnout | 51.0 | +2.0 | |||
Independent hold | Swing | ||||
Party | Candidate | Votes | % | ±% | |
---|---|---|---|---|---|
Labour | Susan McNicholas* | unopposed | |||
Labour hold | Swing | ||||
Party | Candidate | Votes | % | ±% | |
---|---|---|---|---|---|
Independent | Dorothy Gillian Thomas* | 358 | |||
Independent | Richard Brown | 82 | |||
Majority | |||||
Turnout | 53.0 | +53.0 | |||
Independent hold | Swing | ||||
Party | Candidate | Votes | % | ±% | |
---|---|---|---|---|---|
Labour | John Steadman* | ||||
Independent | Joyce Thomas | 397 | |||
Majority | |||||
Turnout | 43.0 | +43.0 | |||
Labour hold | Swing | ||||
Party | Candidate | Votes | % | ±% | |
---|---|---|---|---|---|
Independent | Eluned Beryl Maud Vaughan* | unopposed | |||
Independent hold | Swing | ||||
Party | Candidate | Votes | % | ±% | |
---|---|---|---|---|---|
Independent | David Edward Davies | 298 | |||
Independent | John Allan Lawton* | 179 | |||
Liberal Democrats | Penny Vingoe | 70 | |||
Independent | David Terry Evans | 57 | |||
Majority | |||||
Turnout | 57.0 | +1.0 | |||
Independent hold | Swing | ||||
Party | Candidate | Votes | % | ±% | |
---|---|---|---|---|---|
Independent | Gwilym Thomas Evans* | 630 | |||
Independent | John Cradduck | 437 | |||
Majority | |||||
Turnout | 59.0 | +59.0 | |||
Independent hold | Swing | ||||
Party | Candidate | Votes | % | ±% | |
---|---|---|---|---|---|
Independent | Elizabeth Rachel Davies* | 668 | |||
Independent | Wyn Davies | 270 | |||
Majority | |||||
Turnout | 50.0 | +50.0 | |||
Independent hold | Swing | ||||
Party | Candidate | Votes | % | ±% | |
---|---|---|---|---|---|
Independent | Michael John Jones* | unopposed | |||
Independent hold | Swing | ||||
Party | Candidate | Votes | % | ±% | |
---|---|---|---|---|---|
Independent | Wynne Thomas Jones* | unopposed | |||
Independent hold | Swing | ||||
Party | Candidate | Votes | % | ±% | |
---|---|---|---|---|---|
Independent | Linda Veronica Corfield | unopposed | |||
Independent gain from Liberal Democrats | Swing | ||||
Party | Candidate | Votes | % | ±% | |
---|---|---|---|---|---|
Independent | Gwilym Pughe Vaughan* | unopposed | |||
Independent hold | Swing | ||||
Party | Candidate | Votes | % | ±% | |
---|---|---|---|---|---|
Independent | David Richard Jones* | unopposed | |||
Independent hold | Swing | ||||
Party | Candidate | Votes | % | ±% | |
---|---|---|---|---|---|
Independent | Kathryn Mary Roberts-Jones* | unopposed | |||
Independent hold | Swing | ||||
Party | Candidate | Votes | % | ±% | |
---|---|---|---|---|---|
Independent | Robert William Morgan* | unopposed | |||
Independent hold | Swing | ||||
Party | Candidate | Votes | % | ±% | |
---|---|---|---|---|---|
Independent | Leonard Roche Elvet Davies* | unopposed | |||
Independent hold | Swing | ||||
Party | Candidate | Votes | % | ±% | |
---|---|---|---|---|---|
Independent | Richard Graham Brown* | unopposed | |||
Independent hold | Swing | ||||
Party | Candidate | Votes | % | ±% | |
---|---|---|---|---|---|
Independent | Evan Arwel Jones* | 310 | |||
Independent | Nick Savage | 156 | |||
Conservative | Mark Frederik Johannsen | 125 | |||
Majority | |||||
Turnout | 42.0 | +42.0 | |||
Independent hold | Swing | ||||
Party | Candidate | Votes | % | ±% | |
---|---|---|---|---|---|
Independent | Viola Elizabeth Evans* | unopposed | |||
Independent hold | Swing | ||||
Party | Candidate | Votes | % | ±% | |
---|---|---|---|---|---|
Independent | William Barry Thomas* | unopposed | |||
Independent hold | Swing | ||||
Party | Candidate | Votes | % | ±% | |
---|---|---|---|---|---|
Conservative | Peter Edward Lewis | 281 | |||
Independent | John Ellis Bowen* | 186 | |||
Independent | David Barry Goodman | 89 | |||
Majority | |||||
Turnout | 48.0 | -1.0 | |||
Conservative gain from Independent | Swing | ||||
Party | Candidate | Votes | % | ±% | |
---|---|---|---|---|---|
Liberal Democrats | Gareth Morgan* | 632 | |||
Independent | Nickolas Venti | 465 | |||
Independent | Robert Vaughan Parker-Munn | 146 | |||
Majority | |||||
Turnout | 55.0 | +55.0 | |||
Liberal Democrats hold | Swing | ||||
Party | Candidate | Votes | % | ±% | |
---|---|---|---|---|---|
Conservative | Aled Wyn Davies | 582 | |||
Independent | Ethel Maureen Wilde | 267 | |||
Liberal Democrats | Simon Robert Spencer | 126 | |||
Majority | |||||
Turnout | 55 | -7.0 | |||
Conservative gain from Independent | Swing | ||||
Party | Candidate | Votes | % | ±% | |
---|---|---|---|---|---|
Independent | Tegwyn Jones* | unopposed | |||
Independent hold | Swing | ||||
Party | Candidate | Votes | % | ±% | |
---|---|---|---|---|---|
Conservative | Simon Robert Maurice Baynes | unopposed | |||
Conservative gain from Independent | Swing | ||||
Party | Candidate | Votes | % | ±% | |
---|---|---|---|---|---|
Independent | John Michael Williams* | unopposed | |||
Independent hold | Swing | ||||
Party | Candidate | Votes | % | ±% | |
---|---|---|---|---|---|
Independent | Eldrydd Mary Jones* | unopposed | |||
Independent hold | Swing | ||||
Party | Candidate | Votes | % | ±% | |
---|---|---|---|---|---|
Independent | Stephen Murray Hayes* | 358 | |||
Conservative | Richard Horne | 138 | |||
Majority | |||||
Turnout | 47.0 | -9.0 | |||
Independent hold | Swing | ||||
Party | Candidate | Votes | % | ±% | |
---|---|---|---|---|---|
Conservative | Russell Ian George | 314 | |||
Liberal Democrats | Dougie Bancroft | 211 | |||
Independent | Reginald Taylor | 110 | |||
Independent | Robert Alan Lloyd | 29 | |||
Independent | John Andrew McCall | 26 | |||
Majority | |||||
Turnout | 30.0 | +1.0 | |||
Conservative gain from Independent | Swing | ||||
Party | Candidate | Votes | % | ±% | |
---|---|---|---|---|---|
Liberal Democrats | Richard John White | 210 | |||
Independent | Nur Uddin | 145 | |||
Majority | |||||
Turnout | 23.0 | +23.0 | |||
Liberal Democrats hold | Swing | ||||
Party | Candidate | Votes | % | ±% | |
---|---|---|---|---|---|
Conservative | Francis Alexander Torrens | 378 | |||
Liberal Democrats | Richard Noyce* | 288 | |||
Majority | |||||
Turnout | 38.0 | 0.0 | |||
Conservative gain from Liberal Democrats | Swing | ||||
Party | Candidate | Votes | % | ±% | |
---|---|---|---|---|---|
Conservative | Peter Harris | 367 | |||
Independent | Robert Thomas Davey* | 166 | |||
Liberal Democrats | Stephen John Page | 121 | |||
Majority | |||||
Turnout | 38.0 | 0.0 | |||
Conservative gain from Independent | Swing | ||||
Party | Candidate | Votes | % | ±% | |
---|---|---|---|---|---|
Independent | Robert Henry Mills* | 332 | |||
Liberal Democrats | Sue Callery | 103 | |||
Independent | Philip Bowell Watkins | 37 | |||
Majority | |||||
Turnout | 37.0 | -1.0 | |||
Independent hold | Swing | ||||
Party | Candidate | Votes | % | ±% | |
---|---|---|---|---|---|
Independent | Joyce Gethin Shearer* | unopposed | |||
Independent hold | Swing | ||||
Party | Candidate | Votes | % | ±% | |
---|---|---|---|---|---|
Independent | Dawn Bailey* | 308 | |||
Independent | John William Evams | 154 | |||
Majority | |||||
Turnout | 43.0 | +43.0 | |||
Independent hold | Swing | ||||
Party | Candidate | Votes | % | ±% | |
---|---|---|---|---|---|
Independent | Philip Charles Pritchard | 277 | |||
Conservative | Stephen Thomas Kaye | 151 | |||
Majority | |||||
Turnout | 28.0 | -18.0 | |||
Independent hold | Swing | ||||
Party | Candidate | Votes | % | ±% | |
---|---|---|---|---|---|
Liberal Democrats | Francesca Helen Jump* | 443 | |||
Independent | David John Delwyn Williams | 350 | |||
Majority | |||||
Turnout | 42.0 | +3.0 | |||
Liberal Democrats hold | Swing | ||||
Party | Candidate | Votes | % | ±% | |
---|---|---|---|---|---|
Independent | Ann Florence Holloway* | 426 | |||
Liberal Democrats | Mark Howells | 353 | |||
Majority | |||||
Turnout | 46.0 | +12.0 | |||
Independent hold | Swing | ||||
Party | Candidate | Votes | % | ±% | |
---|---|---|---|---|---|
Independent | John Harold Brunt* | 273 | |||
Independent | Christopher Robert Thomas | 246 | |||
Independent | Geoff Morgan | 163 | |||
Independent | Jan Harris | 51 | |||
Majority | |||||
Turnout | |||||
Independent hold | Swing | ||||
Party | Candidate | Votes | % | ±% | |
---|---|---|---|---|---|
Liberal Democrats | Leslie Gwyn Davies* | 286 | |||
Conservative | Gwilym Williams | 238 | |||
Independent | Geraint Evans | 86 | |||
Majority | |||||
Turnout | |||||
Liberal Democrats hold | Swing | ||||
Party | Candidate | Votes | % | ±% | |
---|---|---|---|---|---|
Independent | Margaret Elizabeth Morris* | unopposed | |||
Independent hold | Swing | ||||
Party | Candidate | Votes | % | ±% | |
---|---|---|---|---|---|
Liberal Democrats | Kenneth Albert Harris* | 445 | |||
Independent | Christine Brandford | 359 | |||
Independent | Peter Reynolds | 341 | |||
Majority | |||||
Turnout | |||||
Liberal Democrats hold | Swing | ||||
Party | Candidate | Votes | % | ±% | |
---|---|---|---|---|---|
Independent | Fred Barker* | 302 | |||
Independent | John Powell | 230 | |||
Majority | |||||
Turnout | |||||
Independent hold | Swing | ||||
Party | Candidate | Votes | % | ±% | |
---|---|---|---|---|---|
Independent | Gary David Price* | unopposed | |||
Independent hold | Swing | ||||
Party | Candidate | Votes | % | ±% | |
---|---|---|---|---|---|
Conservative | Mike Hodges | 391 | |||
Independent | Keith Francis Tampin* | 302 | |||
Majority | 31 | ||||
Turnout | 49.0 | ||||
Conservative gain from Independent | Swing | ||||
Party | Candidate | Votes | % | ±% | |
---|---|---|---|---|---|
Conservative | Sarah Jayne Millington | 405 | |||
Liberal Democrats | David John Peter* | 397 | |||
Majority | 18 | ||||
Turnout | 50.0 | ||||
Conservative gain from Independent | Swing | ||||
Party | Candidate | Votes | % | ±% | |
---|---|---|---|---|---|
Liberal Democrats | Maureen Mackenzie | 283 | |||
Conservative | Peter John Holtorp | 177 | |||
Independent | Robert Southcott | 95 | |||
Majority | |||||
Turnout | 58.0 | ||||
Liberal Democrats gain from Independent | Swing | ||||
Party | Candidate | Votes | % | ±% | |
---|---|---|---|---|---|
Independent | Wilfred Geoffrey Lewis* | unopposed | |||
Independent hold | Swing | ||||
Party | Candidate | Votes | % | ±% | |
---|---|---|---|---|---|
Independent | John Evans | unopposed | |||
Independent hold | Swing | ||||
Party | Candidate | Votes | % | ±% | |
---|---|---|---|---|---|
Independent | David Owen Evans* | 357 | |||
Conservative | Catrin Edwards | 326 | |||
Majority | |||||
Turnout | |||||
Independent hold | Swing | ||||
Party | Candidate | Votes | % | ±% | |
---|---|---|---|---|---|
Independent | Evan Michael Jones* | 415 | |||
Liberal Democrats | David Barwick | 244 | |||
Majority | |||||
Turnout | |||||
Independent hold | Swing | ||||
Party | Candidate | Votes | % | ±% | |
---|---|---|---|---|---|
Liberal Democrats | Garry Richard Banks* | unopposed | |||
Liberal Democrats hold | Swing | ||||
Party | Candidate | Votes | % | ±% | |
---|---|---|---|---|---|
Liberal Democrats | Kelvyn Watson Curry | 260 | |||
Independent | Edward Narborough | 226 | |||
UKIP | John Andreas Bufton | 169 | |||
Conservative | Carolyn Flynn | 145 | |||
Independent | Daniel Richard Butler | 66 | |||
Majority | |||||
Turnout | |||||
Liberal Democrats hold | Swing | ||||
A number of by-elections were held during this period.
Brecon and Radnorshire was a county constituency in Wales of the House of Commons of the Parliament of the United Kingdom. Created in 1918, it elected one Member of Parliament (MP) by the first-past-the-post system of election. The constituency was represented by Fay Jones of the Conservative Party, who defeated incumbent Jane Dodds of the Liberal Democrats at the 2019 general election.
The Borough of Brecknock was one of the three local government districts of the county of Powys, Wales from 1974 until 1996. It covered the majority of the former administrative county of Brecknockshire. The borough was abolished in 1996, with Powys County Council taking over its functions.
The District of Montgomeryshire or Montgomery was one of three local government districts of the county of Powys, Wales, from 1974 until 1996. The district had an identical area to the previous administrative county of Montgomeryshire. The district was abolished in 1996, with Powys County Council taking over its functions.
The District of Radnorshire was one of three local government districts of the county of Powys, Wales, from 1974 until 1996. The district had an identical area to the previous administrative county of Radnorshire. The district was abolished in 1996, with Powys County Council taking over its functions.
Powys County Council is the local authority for Powys, one of the administrative areas of Wales. The County Hall is in Llandrindod Wells.
The fifth election to Carmarthenshire County Council was held on 1 May 2012. It was preceded by the 2008 election and was followed by the 2017 election. Plaid Cymru won 28 seats whilst Labour and the Independents won 23 each. The main feature of the election was a Labour recovery in the Llanelli area, and to some extent in the Gwendraeth and Ammanford area also, mainly at the expense of Independent candidates. Plaid Cymru lost ground to Labour in the Llanelli area but gained seats elsewhere, becoming the largest party. An Independent-Labour coalition was again formed, but with Labour as the leading partner. As a result, Kevin Madge replaced Meryl Gravell as the leader of the council.
The fifth election to the Powys County Council since local government reorganization in Wales in 1995 was held on 1 May 2012. It was preceded by the 2008 election and was followed by the 2017 election. The Independent group retained a majority on the authority
The first election to the Powys County Council following local government reorganisation was held in May 1995. It was followed by the 1999 election.
The second election to the Powys County Council following local government reorganisation was held in May 1999. It was preceded by the 1995 election and followed by the 2004 election. The election resulted once again in a majority of Independent councillors.
The third election to the Powys County Council following local government reorganisation was held in May 2004. It was preceded by the 1999 election and followed by the 2008 election. The election resulted once again in a majority of Independent councillors
The sixth election to the Powys County Council since local government reorganization in Wales in 1995 was held on 4 May 2017, along with other local government elections. It was preceded by the 2012 election and was followed by the 2022 election.
Dinas Powys is the name of an electoral ward in the Vale of Glamorgan, Wales. It covers its namesake community of Dinas Powys and the neighbouring Michaelston-le-Pit and Leckwith to the north. The ward elects four county councillors to the Vale of Glamorgan Council.
The 2017 Vale of Glamorgan Council election took place on Thursday 4 May 2017 to elect members of Vale of Glamorgan Council in Wales. There were 47 council seats available, across 23 wards. This was the same day as other United Kingdom local elections.
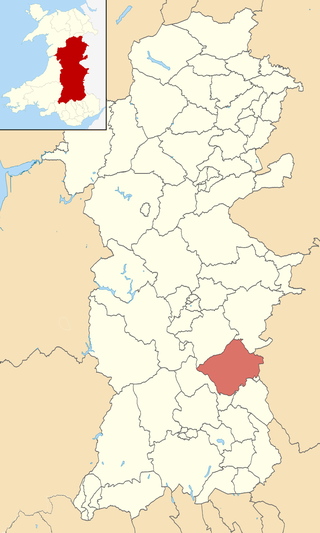
Glasbury is the name of an electoral wards in central Powys, Wales. It covers the community of Glasbury as well as the neighbouring communities of Clyro and Painscastle. The ward elects a county councillor to Powys County Council.
Newtown West is the name of an electoral ward in the community of Newtown and Llanllwchaiarn, Powys, Wales.
Brecon East, formerly St Mary, is the name of an electoral ward in the town of Brecon, Powys, Wales. It covers the town centre and elects councillors to Brecon Town Council and Powys County Council.
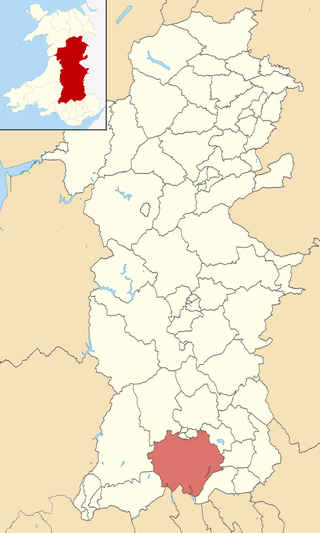
Talybont-on-Usk is the name of an electoral ward in the south of Powys, Wales. It covers three local government communities and elects a councillor to Powys County Council.
A by-election was held in the UK Parliament constituency of Brecon and Radnorshire on 1 August 2019 after Chris Davies, who had held the seat for the Conservatives since the 2015 general election, was unseated by a recall petition. The by-election was won by Jane Dodds of the Liberal Democrats.
The 2022 Welsh local elections took place on 5 May 2022 to elect members of all twenty-two local authorities in Wales. They were held alongside other local elections in the United Kingdom. The previous elections were held in 2017.
The 2022 Powys Council election took place on 5 May 2022 to elect 68 members to Powys County Council. On the same day, elections were held to the other 21 local authorities and to community councils in Wales as part of the 2022 Welsh local elections. The previous Powys all-council election took place in May 2017 and future elections will take place every five years.