Killultagh (District Electoral Area)

Last updated

Killultagh
Lisburn and Castlereagh City Council DEA constituency
Current constituency
Created1985
Seats7 (1985-1989)
5 (1993-)
Councillors
  •   Thomas Beckett (DUP)
  •   Claire Kemp (APNI)
  •   Gary McCleave (SF)
  •   Ross McLernon (UUP)
  •   James Tinsley (DUP)
Killultagh DEA within Lisburn and Castlereagh Lisburn and Castlereagh Killultagh highlight.svg
Killultagh DEA within Lisburn and Castlereagh
Killultagh DEA (1993-2014) within Lisburn Lisburn 1993 Killultagh highlight.svg
Killultagh DEA (1993-2014) within Lisburn

Killultagh is one of the seven district electoral areas (DEA) in Lisburn and Castlereagh, Northern Ireland. [1] The district elects five members to Lisburn and Castlereagh City Council and contains the wards of Ballinderry, Glenavy, Maghaberry, Stonyford and White Mountain. [2] Killultagh forms part of the Lagan Valley constituencies for the Northern Ireland Assembly and UK Parliament, and part of the South Antrim constituencies for the Northern Ireland Assembly and UK Parliament.

Contents

It was created for the 1985 local elections, replacing Lisburn Area A and part of Lisburn Area C which had existed since 1973, where it originally contained seven wards (Ballymacash, Ballymacoss, Glenavy, Knockmore, Lisnagarvy, Magheragall and Moira). For the 1993 local elections it was reduced to five wards, losing Ballymacash, Ballymacoss and Lisnagavy to the new Lisburn North DEA, and gaining Ballinderry and Maghaberry. For the 2014 local elections, Moira moved to the new Downshire West DEA, and Knockmore moved to Lisburn South DEA, while Killultagh gained Stonyford and White Mountain.

Councillors

ElectionCouncillor
(Party)
Councillor
(Party)
Councillor
(Party)
Councillor
(Party)
Councillor
(Party)
Councillor
(Party)
Councillor
(Party)
2023 Gary McCleave
(Sinn Féin)
Claire Kemp
(Alliance)
Ross McLernon
(UUP)
Thomas Beckett
(DUP)
James Tinsley
(DUP)
5 seats
1993–present
5 seats
1993–present
May 2022 Co-Option Sian Mulholland
(Alliance)
2019 David Honeyford
(Alliance)
July 2018 Co-Option Máiría Cahill
(SDLP)
William Leathem
(DUP)
Alexander Redpath
(UUP)
April 2018 Co-OptionChristine Robb
(SDLP)
May 2017 Co-OptionConor Quinn
(SDLP)
June 2016 Co-Option Pat Catney
(SDLP)
2014 Robbie Butler
(UUP)
2011 John Palmer
(DUP)
Jim Dillon
(UUP)
2005 Peter O'Hagan
(SDLP)
Cecil Calvert
(DUP)
2001 Samuel Johnston
(UUP)
1997 David Greene
(UUP)/
(Ind. Conservative)
Kenneth Watson
(UUP)
1993
1989 William Lewis
(UUP)
Ronnie Crawford
(UUP)
David Campbell
(UUP)
1985 Paddy Ritchie
(SDLP)
Robert McNeice
(DUP)
Henry McGiffin
(UUP)
Ronald Campbell
(UUP)

2023 Election

2019: 2 x DUP, 1 x Alliance, 1 x UUP, 1 x Sinn Féin

2023: 2 x DUP, 1 x Sinn Féin, 1 x Alliance, 1 x UUP

2019–2023 Change: No change

Killultagh - 5 seats [3]
PartyCandidateFPv%Count
123456
Sinn Féin Gary McCleave*23.36%1,958     
Alliance Claire Kemp22.22%1,862     
DUP Thomas Beckett*18.01%1,509     
DUP James Tinsley*15.48%1,2971,297.68 1,312.26 1,325.80 1,415.05 
UUP Ross McLernon*7.80%654657.74 732.80 765.65 776.78 1,398.14
SDLP Jack Patton4.34%364888.28 1,145.86 1,178.05 1,178.47 1,192.49
UUP Laura Turner7.86%659664.10 728.63 748.84 752.69  
Independent Stuart Brown0.93%7893.64 136.57    
Electorate: 15,956  Valid: 8,381 (52.53%)  Spoilt: 68  Quota: 1,397  Turnout: 8,449 (52.95%)  

    2019 Election

    2014: 3 x DUP, 1 x UUP, 1 x SDLP

    2019: 2 x DUP, 1 x UUP, 1 x Alliance, 1 x Sinn Féin

    2014-2019 Change: Alliance and Sinn Féin gain from DUP and SDLP

    Killultagh - 5 seats [4]
    PartyCandidateFPv%Count
    1234567
    Alliance David Honeyford 20.30%1,524      
    UUP Ross McLernon9.40%707729 775.8 1,313.8   
    Sinn Féin Gary McCleave13.22%994996 1,022.8 1,024.8 1,025.22 1,438.22 
    DUP Thomas Beckett*14.18%1,0061,018 1,024.6 1,047.4 1,058.88 1,091.66 1,115.66
    DUP James Tinsley*13.03%979988 993.8 1,032.8 1,057.3 1,079.28 1,102.28
    DUP William Leathem*10.87%871885 891.2 909.4 923.4 925.16 944.16
    SDLP Ally Haydock9.25%695717 863.3 884.6 891.46   
    UUP Alexander Redpath*8.41%632639 667.2     
    Independent Stuart Brown1.42%107      
    Electorate: 14,361  Valid: 7,515 (52.33%)  Spoilt: 76  Quota: 1,253  Turnout: 7,591 (52.86%)  

      2014 Election

      2011: 3 x DUP, 1 x UUP, 1 x SDLP

      2014: 3 x DUP, 1 x UUP, 1 x SDLP

      2011-2014: No change

      Killultagh - 5 seats [5]
      PartyCandidateFPv%Count
      12345
      DUP Thomas Beckett*18.78%1,216    
      UUP Robbie Butler 18.22%1,180    
      SDLP Pat Catney * †††10.78%698700.42 703.12 774.97 1,072.61
      DUP William Leathem12.49%809897.44 936.86 980.51 1,040.93
      DUP James Tinsley*13.34%864896.67 929.7 965.66 1,018.47
      Sinn Féin Mary Quinn13.19%854854.33 854.42 870.51 900.62
      Alliance Jonnie McCrea7.03%455458.96 466.7 654.73  
      NI21 David Honeyford 6.16%399402.19 414.7   
      Electorate: 12,863  Valid: 6,475 (50.34%)  Spoilt: 59  Quota: 1,080  Turnout: 6,534 (50.80%)  

        2011 Election

        2005: 3 x DUP, 1 x UUP, 1 x SDLP

        2011: 3 x DUP, 1 x UUP, 1 x SDLP

        2005-2011 Change: No change

        Killultagh - 5 seats [6]
        PartyCandidateFPv%Count
        123456
        DUP Thomas Beckett*20.54%1,756     
        DUP James Tinsley*18.24%1,559     
        SDLP Pat Catney 10.50%898902.37 902.93 923.23 1,526.23 
        UUP Jim Dillon*8.91%762788.03 794.91 917.97 919.97 1,425.97
        DUP John Palmer8.94%7641,007.01 1,108.05 1,211.76 1,216.49 1,342.28
        Alliance Owen Gawith10.42%891897.46 899.86 978.92 1,036.27 1,102.27
        UUP Roy Hanna7.91%676693.1 698.3 790.95 795.22  
        Sinn Féin Mary-Kate Quinn9.03%772773.14 773.7 778.08   
        Independent Cecil Calvert*2.68%229249.33 253.17    
        NI Conservatives Steve McIlwrath2.83%242250.17 251.53    
        Electorate: 16,299  Valid: 8,549 (52.45%)  Spoilt: 140  Quota: 1,425  Turnout: 8,689 (53.31%)  

          2005 Election

          2001: 2 x UUP, 2 x DUP, 1 x SDLP

          2005: 3 x DUP, 1 x UUP, 1 x SDLP

          2001-2005 Change: DUP gain from UUP

          Killultagh - 5 seats [7]
          PartyCandidateFPv%Count
          1234567
          DUP Thomas Beckett20.77%1,751      
          SDLP Peter O'Hagan*11.59%977978.33 986.33 1,003.33 1,531.33  
          UUP Jim Dillon*12.41%1,0461,054.17 1,164.17 1,243.55 1,246.74 1,252.34 1,560.34
          DUP Cecil Calvert *12.44%1,0491,304.74 1,322.69 1,373.26 1,379.26 1,379.61 1,436.61
          DUP James Tinsley*15.17%1,2791,333.15 1,343.72 1,367.1 1,367.1 1,370.25 1,471.25
          Alliance Owen Gawith6.86%578579.52 600.71 678.71 714.71 824.96 928.96
          UUP Samuel Johnston*5.46%460463.8 584.56 654.56 656.56 661.11  
          Sinn Féin Chris Donnelly7.73%652652.38 652.38 653.38    
          NI Conservatives Neil Johnston3.95%333334.71 348.71     
          UUP David Greene3.63%306308.85      
          Electorate: 14,029  Valid: 8,431 (60.10%)  Spoilt: 122  Quota: 1,406  Turnout: 8,553 (60.97%)  

            2001 Election

            1997: 3 x UUP, 1 x DUP, 1 x SDLP

            2001: 2 x DUP, 2 x UUP, 1 x SDLP

            1997-2001 Change: DUP gain from UUP

            Killultagh - 5 seats [8]
            PartyCandidateFPv%Count
            123456789
            UUP Jim Dillon*21.71%1,923        
            SDLP Peter O'Hagan*14.88%1,3181,323.06 1,333.52 1,351.52 1,751.32    
            DUP Cecil Calvert *15.60%1,3821,414.43 1,417.43 1,471.12 1,473.12 1,475.12 1,516.12  
            DUP James Tinsley14.26%1,2631,277.03 1,278.03 1,352.72 1,353.72 1,354.72 1,389.41 1,415.41 1,445.87
            UUP Samuel Johnston*6.06%537782.87 785.1 827.02 827.25 828.25 978.76 986.76 1,210.82
            UUP Kenneth Watson*7.43%658749.77 753.23 811.38 811.84 818.84 905.49 906.49 1,053.48
            Alliance Alison Gawith4.96%439449.12 552.58 576.81 584.81 777.81 889.81 890.91  
            NI Conservatives Neil Johnston4.73%419442.46 446.69 472.69 472.69 483.69    
            Sinn Féin Ita Gray5.16%457457.69 458.69 462.69      
            Independent Gordon Ross3.75%332335.91 336.91       
            Alliance Owen Gawith1.48%131133.3        
            Electorate: 14,118  Valid: 8,859 (62.75%)  Spoilt: 160  Quota: 1,477  Turnout: 9,019 (63.88%)  

              1997 Election

              1993: 3 x UUP, 1 x DUP, 1 x SDLP

              1997: 3 x UUP, 1 x DUP, 1 x SDLP

              1993-1997 Change: No change

              Killultagh - 5 seats [9]
              PartyCandidateFPv%Count
              1234
              UUP Jim Dillon*26.23%1,432   
              SDLP Peter O'Hagan*17.05%931   
              DUP Cecil Calvert *16.56%904949.72  
              UUP David Greene*10.09%551919.64  
              UUP Kenneth Watson*10.82%591668.4 686.12 973.12
              Alliance Trevor Lunn 8.96%489496.92 605.64 621.64
              DUP James Tinsley7.55%412422.44 426.44  
              NI Women's Coalition Sybil Moses2.75%150151.44   
              Electorate: 12,966  Valid: 5,460 (42.11%)  Spoilt: 84  Quota: 911  Turnout: 5,544 (42.76%)  

                1993 Election

                1989: 4 x UUP, 1 x DUP, 1 x SDLP, 1 x Independent Conservative

                1993: 3 x UUP, 1 x DUP, 1 x SDLP

                1989-1993 Change: UUP loss (two seats) due to the reduction of two seats, Independent Conservative joins UUP

                Killultagh - 5 seats [10]
                PartyCandidateFPv%Count
                1234
                UUP Jim Dillon*27.83%1,550   
                DUP Cecil Calvert *17.33%965   
                SDLP Peter O'Hagan*15.98%890890.8 890.89 1,064.89
                UUP David Greene*7.61%424827.6 834.86 977.86
                UUP Kenneth Watson12.91%719863 867.44 966.44
                DUP William Stevenson8.98%500538 553.54 581.02
                Alliance Eileen Drayne9.36%521543.8 544.73  
                Electorate: 11,781  Valid: 5,569 (47.27%)  Spoilt: 115  Quota: 929  Turnout: 5,684 (48.25%)  

                  1989 Election

                  1985: 4 x UUP, 2 x DUP, 1 x SDLP

                  1989: 4 x UUP, 1 x DUP, 1 x SDLP, 1 x Independent Conservative

                  1985-1989 Change: Independent Conservative gain from DUP

                  Killultagh - 7 seats [11]
                  PartyCandidateFPv%Count
                  1234567
                  UUP David Campbell 21.39%2,072      
                  UUP Ronnie Crawford9.46%9171,371.69     
                  UUP Jim Dillon*12.50%1,2111,352.86     
                  DUP Cecil Calvert *12.41%1,2021,294.66     
                  UUP William Lewis*9.56%9261,021.12 1,141.92 1,250.6   
                  SDLP Peter O'Hagan10.92%1,0581,059.64 1,059.8 1,059.8 1,083.8 1,086.96 1,091.28
                  Ind. Conservative David Greene7.76%752765.53 775.13 783.49 788.9 827.19 1,024.49
                  Alliance Eileen Drayne7.64%740752.71 758.63 761.71 794.12 813.92 845.02
                  DUP William Stevenson5.20%504524.91 533.87 545.75 548.91 653.91  
                  Ulster Democratic Richard Haggan2.43%235241.97 253.81 261.29 264.29   
                  Workers' Party Anne-Marie Lowry0.74%7272.82 73.62 73.62    
                  Electorate: 18,323  Valid: 9,689 (52.88%)  Spoilt: 141  Quota: 1,212  Turnout: 9,830 (53.65%)  

                    1985 Election

                    1985: 4 x UUP, 2 x DUP, 1 x SDLP

                    Killultagh - 7 seats [12]
                    PartyCandidateFPv%Count
                    12345
                    UUP Ronald Campbell*26.22%2,386    
                    DUP Cecil Calvert 14.63%1,331    
                    UUP William Lewis12.78%1,163    
                    UUP Jim Dillon*10.96%9971,968.49   
                    UUP Henry McGiffin3.30%300447.34 1,124.84  
                    DUP Robert McNeice*6.13%558613.12 685.12 808.87 1,338.87
                    SDLP Paddy Ritchie11.76%1,0701,073.71 1,074.71 1,074.71 1,079.29
                    Alliance Eileen Drayne7.74%704731.03 765.03 768.78 805.72
                    DUP Henry Stevenson6.49%591625.45 664.95 707.1  
                    Electorate: 15,793  Valid: 9,100 (57.62%)  Spoilt: 133  Quota: 1,138  Turnout: 9,233 (58.46%)  

                      Related Research Articles

                      <span class="mw-page-title-main">Balmoral (District Electoral Area)</span>

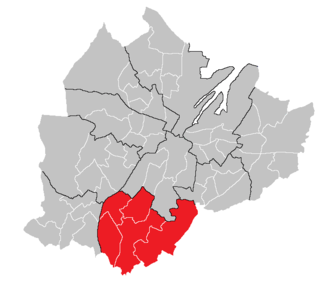
                      Balmoral is the most southern of ten district electoral areas (DEA) in Belfast, Northern Ireland. The district elects five members to Belfast City Council and contains the wards of Belvoir; Finaghy; Malone; Musgrave; Windsor; and Upper Malone. Balmoral, along with neighbouring Botanic, forms the greater part of the Belfast South constituencies for the Northern Ireland Assembly and UK Parliament.

                      <span class="mw-page-title-main">Oldpark (District Electoral Area)</span> Electoral division in Belfast, Northern Ireland

                      Oldpark is one of the ten district electoral areas (DEA) in Belfast, Northern Ireland. Located in the north of the city, the district elects six members to Belfast City Council and contains the wards of Ardoyne; Ballysillan; Cliftonville; Legoniel; New Lodge and Water Works. Oldpark forms part of the Belfast North constituency for the Northern Ireland Assembly and UK Parliament.

                      Elections to Lisburn City Council were held on 5 May 2011 on the same day as the other Northern Irish local government elections. The election used five district electoral areas to elect a total of 30 councillors.

                      Elections to Lisburn Borough Council were held on 21 May 1997 on the same day as the other Northern Irish local government elections. The election used five district electoral areas to elect a total of 30 councillors.

                      Elections to Cookstown District Council were held on 5 May 2005 on the same day as the other Northern Irish local government elections. The election used three district electoral areas to elect a total of 16 councillors.

                      <span class="mw-page-title-main">Castlereagh South (District Electoral Area)</span> Electoral area in Northern Ireland

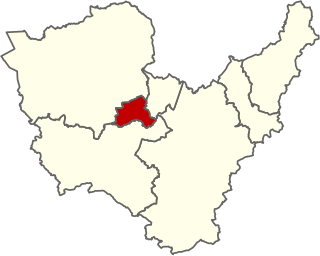
                      Castlereagh South is one of the seven district electoral areas (DEA) in Lisburn and Castlereagh, Northern Ireland. The district elects five members to Lisburn and Castlereagh City Council and contains the wards of Beechill, Cairnshill, Carryduff East, Carryduff West, Galwally, Knockbracken and Newtownbreda. Castlereagh South forms part of the Belfast South constituencies for the Northern Ireland Assembly and UK Parliament.

                      <span class="mw-page-title-main">Lisburn North (District Electoral Area)</span> District electoral area in Northern Ireland

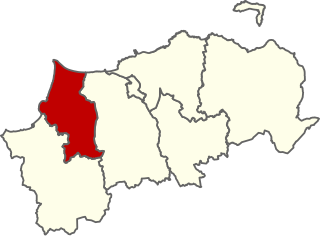
                      Lisburn North is one of the seven district electoral areas (DEA) in Lisburn and Castlereagh, Northern Ireland. The district elects six members to Lisburn and Castlereagh City Council and contains the wards of Derryaghy, Harmony Hill, Hilden, Lambeg, Magheralave and Wallace Park. Lisburn North forms part of the Lagan Valley constituencies for the Northern Ireland Assembly and UK Parliament.

                      <span class="mw-page-title-main">Lisburn South (District Electoral Area)</span> District electoral area in Northern Ireland

                      Lisburn South is one of the seven district electoral areas (DEA) in Lisburn and Castlereagh, Northern Ireland. The district elects six members to Lisburn and Castlereagh City Council and contains the wards of Ballymacash, Ballymacoss, Knockmore, Lagan Valley, Lisnagarvey and Old Warren. Lisburn South forms part of the Lagan Valley constituencies for the Northern Ireland Assembly and UK Parliament.

                      <span class="mw-page-title-main">Dunmurry Cross (District Electoral Area)</span> District electoral areas in Ards, Northern Ireland

                      Dunmurry Cross was one of the district electoral areas in Lisburn, Northern Ireland which existed from 1985 to 2014. It was one of four Lisburn DEAs until 1993, and one of five until 2014. The district elected seven members to Lisburn City Council and formed part of Belfast West constituencies for the Northern Ireland Assembly and UK Parliament and part of the Lagan Valley constituencies for the Northern Ireland Assembly and UK Parliament.

                      Antrim Line was one of the district electoral areas in Newtownabbey, Northern Ireland which existed from 1985 to 2014, one of five DEAs until 1993 and one of four DEAs until 2014. The district elected five members to Newtownabbey Borough Council until 1993 and seven members until 2014, and formed part of the South Antrim constituencies for the Northern Ireland Assembly and UK Parliament and part of the Belfast North constituencies for the Northern Ireland Assembly and UK Parliament.

                      <span class="mw-page-title-main">Bannside (District Electoral Area)</span> District electoral area in Northern Ireland

                      Bannside is one of the seven district electoral areas (DEA) in Mid and East Antrim, Northern Ireland. The district elects six members to Mid and East Antrim District Council and contains the wards of Ahoghill, Cullybackey, Galgorm, Grange, Maine and Portglenone. Bannside forms part of the North Antrim constituencies for the Northern Ireland Assembly and UK Parliament.

                      <span class="mw-page-title-main">Bann Valley (District Electoral Area)</span> District electoral areas in Ballymoney, Northern Ireland

                      Bann Valley was one of the three district electoral areas in Ballymoney, Northern Ireland which existed from 1985 to 2014. The district elected six members to Ballymoney Borough Council, and formed part of the North Antrim constituencies for the Northern Ireland Assembly and UK Parliament.

                      <span class="mw-page-title-main">Bann (District Electoral Area)</span> District electoral area in Northern Ireland

                      Bann is one of the seven district electoral areas (DEA) in Causeway Coast and Glens, Northern Ireland. The district elects five members to Causeway Coast and Glens Borough Council and contains the wards of Aghadowey, Castlerock, Garvagh, Kilrea and Macosquin. Bann forms part of the East Londonderry constituencies for the Northern Ireland Assembly and UK Parliament.

                      <span class="mw-page-title-main">Limavady (District Electoral Area)</span> District electoral area in Northern Ireland

                      Limavady is one of the seven district electoral areas (DEA) in Causeway Coast and Glens, Northern Ireland. The district elects five members to Causeway Coast and Glens Borough Council and contains the wards of Coolessan, Drumsurn, Greystone, Magilligan and Roeside. Limavady forms part of the East Londonderry constituencies for the Northern Ireland Assembly and UK Parliament.

                      <span class="mw-page-title-main">Lurgan (District Electoral Area)</span> District electoral area in Northern Ireland

                      Lurgan is one of the seven district electoral areas (DEA) in Armagh City, Banbridge and Craigavon, Northern Ireland. The district elects seven members to Armagh City, Banbridge and Craigavon Borough Council and contains the wards of Aghagallon, Knocknashane, Lough Road, Magheralin, Mourneview, Parklake and Shankill. Lurgan forms part of the Upper Bann constituencies for the Northern Ireland Assembly and UK Parliament.

                      <span class="mw-page-title-main">The Mournes (District Electoral Area)</span> District electoral area in Northern Ireland

                      The Mournes is one of the seven district electoral areas (DEA) in Newry, Mourne and Down, Northern Ireland. The district elects seven members to Newry, Mourne and Down District Council and contains the wards of Annalong, Binnian, Donard, Kilkeel, Lisnacree, Murlough and Tollymore. The Mournes forms part of the South Down constituencies for the Northern Ireland Assembly and UK Parliament.

                      <span class="mw-page-title-main">Moyola (District Electoral Area)</span> District electoral area in Northern Ireland

                      Moyola is one of the seven district electoral areas (DEA) in Mid Ulster, Northern Ireland. The district elects five members to Mid Ulster District Council and contains the wards of Ballymaguigan, Bellaghy, Castledawson, Draperstown and Tobermore. Moyola forms part of the Mid Ulster constituencies for the Northern Ireland Assembly and UK Parliament.

                      <span class="mw-page-title-main">Cookstown (District Electoral Area)</span> District electoral area in Northern Ireland

                      Cookstown is one of the seven district electoral areas (DEA) in Mid Ulster, Northern Ireland, encompassing the town of the same name and nearby villages. The district elects seven members to Mid Ulster District Council and contains the wards of Coagh, Cookstown East, Cookstown South, Cookstown West, Loughry, Oaklands and Pomeroy. Cookstown forms part of the Mid Ulster constituencies for the Northern Ireland Assembly and UK Parliament.

                      <span class="mw-page-title-main">Ballinderry (District Electoral Area)</span> District electoral areas in Cookstown, Northern Ireland

                      Ballinderry was one of the three district electoral areas in Cookstown, Northern Ireland which existed from 1985 to 2014. The district elected six members to Cookstown District Council, and formed part of the Mid Ulster constituencies for the Northern Ireland Assembly and UK Parliament.

                      Lisburn Area A was one of the five district electoral areas in Lisburn, Northern Ireland which existed from 1973 to 1985. The district elected four members to Lisburn Borough Council, and formed part of the South Antrim constituencies for the Northern Ireland Assembly and UK Parliament.

                      References

                      1. Final Northern Ireland super council recommendations, BBC News, 13 December 2013, accessed 24 May 2014
                      2. , ARK, accessed 8 July 2023
                      3. "Local Council Elections 2023 - Results". EONI. Retrieved 8 July 2023.
                      4. "Local Council Elections 2019 - Results by Stage". 2 May 2019. Retrieved 21 January 2022.
                      5. "Local Council Elections 2014 - Results by Stage" . Retrieved 21 January 2022.
                      6. "Killultagh Result Sheet" (PDF). EONI. Retrieved 8 July 2021.
                      7. "Local Government Results 2005". EONI. Retrieved 8 July 2021.
                      8. "Local Government Results 2001". EONI. Retrieved 8 July 2021.
                      9. "Local Government Results 1997". EONI. Retrieved 8 July 2021.
                      10. "Local Government Results 1993". EONI. Retrieved 8 July 2021.
                      11. "Local Government Results 1989". EONI. Retrieved 8 July 2021.
                      12. "Local Government Results 1985". EONI. Retrieved 8 July 2021.