Results maps
 1982 results map
 1986 results map
 2012 results map
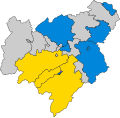
 2017 results map
Scottish Borders Council in Scotland holds elections every five years, previously holding them every four years from its creation as a single-tier authority in 1995 to 2007.
| Year | Conservative | SNP | Liberal [a] | Borders Independent | Independent |
|---|---|---|---|---|---|
| 1974 | 7 | 0 | 3 | 0 | 13 |
| 1978 | 9 | 1 | 1 | 0 | 12 [b] |
| 1982 [c] | 8 | 0 | 3 | 0 | 12 |
| 1986 | 6 | 1 | 2 | 1 | 13 |
| 1990 | 3 | 2 | 6 | 0 | 12 |
| 1994 [d] | 2 | 6 | 8 | 0 | 11 |
| Year | Conservative | SNP | Liberal Democrats | Green | Borders | Labour | Independent |
|---|---|---|---|---|---|---|---|
| 1995 | 3 | 8 | 15 | 0 | 0 | 2 | 30 |
| 1999 [a] | 1 | 4 | 14 | 0 | 0 | 1 | 14 |
| 2003 | 10 | 1 | 9 | 0 | 0 | 0 | 14 |
| 2007 [b] | 11 | 6 | 10 | 0 | 2 | 0 | 5 |
| 2012 | 10 | 9 | 6 | 0 | 2 | 0 | 7 |
| 2017 [c] | 15 | 9 | 2 | 0 | 0 | 0 | 8 |
| 2022 | 14 | 9 | 3 | 1 | 0 | 0 | 7 |


| Party | Candidate | Votes | % | ±% | |
|---|---|---|---|---|---|
| Conservative | Andrew Thomson [6] | 371 | 43.8 | +4.0 | |
| Liberal Democrats | 320 | 37.7 | +37.7 | ||
| SNP | 157 | 18.5 | +18.5 | ||
| Majority | 51 | 6.0 | |||
| Turnout | 848 | ||||
| Conservative gain from Independent | Swing | ||||
| Party | Candidate | Votes | % | ±% | |
|---|---|---|---|---|---|
| SNP | Bill Herd [8] | 372 | 33.7 | +6.9 | |
| Conservative | 325 | 29.4 | +8.0 | ||
| Independent | 206 | 18.7 | +18.7 | ||
| Liberal Democrats | 181 | 16.4 | +16.4 | ||
| Independent | 20 | 1.8 | +1.8 | ||
| Majority | 47 | 4.3 | |||
| Turnout | 1,104 | ||||
| SNP gain from Independent | Swing | ||||
| Party | Candidate | FPv% | Count | ||||||
|---|---|---|---|---|---|---|---|---|---|
| 1 | 2 | 3 | 4 | 5 | 6 | ||||
| Borders | Iain Gillespie | 23.5 | 814 | 844 | 900 | 1,118 | 1,444 | 2,066 | |
| Conservative | Rachael Hamilton | 27.6 | 956 | 975 | 982 | 1,038 | 1,283 | ||
| Liberal Democrats | John Paton-Day | 21.5 | 744 | 756 | 816 | 983 | |||
| SNP | Harry Cummings | 17.7 | 613 | 623 | 666 | ||||
| Labour | Robin Tatler | 6.8 | 235 | 238 | |||||
| UKIP | Sherry Fowler | 3.0 | 105 | ||||||
| Borders hold | |||||||||
| Valid: 3,467 Spoilt: 20 Quota: 1,734 | |||||||||
| Party | Candidate | FPv% | Count | |||||||
|---|---|---|---|---|---|---|---|---|---|---|
| 1 | 2 | 3 | 4 | 5 | 6 | 7 | ||||
| Conservative | Keith Cockburn | 42.7 | 1,155 | 1,165 | 1,176 | 1,193 | 1,255 | 1,288 | 1,616 | |
| Liberal Democrats | Nancy Norman | 25.0 | 677 | 682 | 690 | 759 | 858 | 1,034 | ||
| SNP | Morag Kerr | 13.3 | 359 | 369 | 373 | 409 | 444 | |||
| Borders | David Pye | 8.4 | 228 | 237 | 245 | 272 | ||||
| Labour | Veronica McTernan | 7.5 | 203 | 204 | 207 | |||||
| UKIP | Mars Goodman | 1.6 | 43 | 44 | ||||||
| Independent | David Cox | 1.6 | 43 | |||||||
| Conservative hold | ||||||||||
| Valid: 2,708 Spoilt: 21 Quota: 1,355 Turnout: 2,729 | ||||||||||
| Party | Candidate | FPv% | Count | |||||||
|---|---|---|---|---|---|---|---|---|---|---|
| 1 | 2 | 3 | 4 | 5 | 6 | 7 | ||||
| Independent | Watson McAteer | 25.5 | 732 | 750 | 803 | 900 | 1,010 | 1,222 | 1,505 | |
| Conservative | Trevor Adams | 21.6 | 622 | 627 | 638 | 665 | 692 | 798 | ||
| Liberal Democrats | Ian Turnbull | 15.7 | 450 | 455 | 485 | 545 | 637 | |||
| SNP | Harry Stoddart | 14.6 | 419 | 423 | 461 | 505 | ||||
| Independent | Marion Short | 11.3 | 326 | 334 | 385 | |||||
| Independent | Davie Paterson | 8.7 | 250 | 269 | ||||||
| Independent | Craig Bryson | 2.6 | 74 | |||||||
| Independent gain from Conservative | ||||||||||
| Valid: 2,873 Spoilt: 47 Quota: 1,437 Turnout: 2,920 | ||||||||||
| Party | Candidate | FPv% | Count | |||||||
|---|---|---|---|---|---|---|---|---|---|---|
| 1 | 2 | 3 | 4 | 5 | 6 | 7 | ||||
| Independent | Caroline Penman | 29.7 | 1,040 | 1,049 | 1,080 | 1,125 | 1,231 | 1,522 | 2,028 | |
| Conservative | Trevor Adams | 39.9 | 1,380 | 1,251 | 1,262 | 1,276 | 1,307 | 1,342 | ||
| SNP | John Mitchell | 19.8 | 691 | 717 | 729 | 758 | 797 | |||
| Independent | Kenneth Gunn | 6.3 | 219 | 226 | 238 | 249 | ||||
| Labour | Scott Redpath | 3.8 | 134 | 144 | 158 | |||||
| Liberal Democrats | Jack Clark | 2.7 | 95 | 103 | ||||||
| Green | Barbra Harvie | 2.0 | 70 | |||||||
| Independent gain from Conservative | ||||||||||
| Valid: 3,496 Spoilt: 44 Quota: 1,749 Turnout: 3,536 | ||||||||||
| Party | Candidate | FPv% | Count | |||||||
|---|---|---|---|---|---|---|---|---|---|---|
| 1 | 2 | 3 | 4 | 5 | 6 | 7 | ||||
| Conservative | Jenny Linehan | 39.9 | 1,380 | 1,389 | 1,399 | 1,406 | 1,451 | 1,653 | 1,969 | |
| SNP | John Paton-Day | 30.2 | 1,042 | 1,051 | 1,069 | 1,120 | 1,156 | 1,297 | ||
| Liberal Democrats | Jonny Adamson | 15.6 | 538 | 542 | 566 | 615 | 682 | |||
| Independent | Mary Douglas | 4.6 | 159 | 177 | 194 | 224 | ||||
| Green | Michael Needham | 4.4 | 152 | 155 | 175 | |||||
| Labour | Scott Redpath | 3.3 | 115 | 120 | ||||||
| Independent | Karen Wilks | 2.0 | 69 | |||||||
| Conservative gain from SNP | ||||||||||
| Valid: 3,455 Spoilt: 25 Quota: 1,728 Turnout: 3,480 | ||||||||||
| Party | Candidate | FPv% | Count | |
|---|---|---|---|---|
| 1 | ||||
| Conservative | John Bathgate | 58.5 | 1,377 | |
| SNP | Phil Dixon | 17.4 | 410 | |
| Labour | Kaymarie Hughes | 10.2 | 241 | |
| Liberal Democrats | Ray Georgeson | 7.1 | 166 | |
| Green | Charles Strang | 5.7 | 135 | |
| Scottish Eco-Federalists | James Clark | 1.1 | 25 | |
| Conservative gain from SNP | ||||
| Valid: 2,354 Spoilt: 20 Quota: 1,178 Turnout: 2,374 | ||||