The demography of Scotland includes all aspects of population, past and present, in the area that is Scotland. Scotland had a population of 5,463,300 in 2019. The population growth rate in 2011 was estimated as 0.6% per annum according to the 2011 GROS Annual Review.[1]
Covering an area of 78,782 square kilometres (30,418sqmi), Scotland has a population density of 67.2/km2 (174/sqmi). Around 70% of the country's population (3.5 million) live in the Central Belt —a region stretching in a northeast–southwest orientation between the major Scottish cities of Edinburgh and Glasgow, and including the major settlements of Paisley, Stirling, Falkirk, Perth and Dundee, in the Central Lowlands (80%). Other concentrations of population include the northeast coast of Scotland, principally the regions around the cities of Aberdeen and Inverness, and the west coast around the town of Ayr. The Scottish Highlands and the island group of Eilean Siar have the lowest population densities at 9/km2 (23/sqmi). Glasgow has the highest population density at 3,289/km2 (8,520/sqmi).[2]
In the United Kingdom, a census was taken every ten years from 1801 onwards; with the exception of 1941 due to the Second World War. Population data for years prior to that is provided from directories and gazetteers[4][5][6]
Year
Population
1500
500,000
1600
800,000
1707
1,000,000
1755
1,265,380
1801
1,608,420
1811
1,805,864
1821
2,091,521
1831
2,364,386
1841
2,620,184
1851
2,888,742
1861
3,062,294
1871
3,360,018
1881
3,735,578
1891
4,025,647
1901
4,472,103
1911
4,760,904
1921
4,882,407
1931
4,842,989
1939a
5,006,700
1951
5,095,969
1961b
5,179,000
1971
5,229,000
1981
5,035,000
1991c
5,083,000
2001
5,062,000
2011
5,295,000
2022
5,436,000
Notes
a. There was no census in 1941 however there was a National Register of the Civilian Population in 1939
b. Data for 1961 onwards rounded to nearest thousand
The proportion of people residing in Scotland born outside the UK was 10.2% in 2022, compared with 7.0% in 2011, 3.8% in 2001 and 3.0% in 1991. Below are the fifteen largest overseas-born groups in Scotland according to the 2022 census, alongside the three previous censuses.[16]
Map showing the percentage of the population that identifies itself as "Scottish only" according to the 2011 census.Map showing the percentage of the population that identifies itself as "Scottish and British" and "British only" according to the 2011 census.
A question on national identity was asked in the 2011 census: "what do you feel is your national identity?".[26] Respondents could identify themselves as having more than one national identity.
18% identified themselves as 'Scottish' and 'British'
8% identified themselves as 'British only'
2% identified themselves as 'Scottish' together with other non-British identity
10% identified themselves with other national/ethnic identities only (neither Scottish nor British)
The council areas with at least 90% of the population stating some 'Scottish' national identity were North Lanarkshire, Inverclyde, East Ayrshire and West Dunbartonshire. The lowest proportions of people stating some 'Scottish' national identity were in Edinburgh (70%) and Aberdeen (75%).[28]
The council areas with the highest proportions of people stating 'British' as their only national identity were Argyll and Bute and Shetland, each with 12%.[28]
Below is a table of national identity sorted by council area based on the results of the 2011 census:
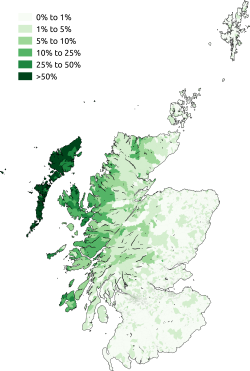
Distribution of those who stated they could speak a regional language in the 2011 census
Scottish Gaelic
Scots
Over 170 languages are spoken in Scotland. The 4 most commonly spoken non-English languages at home (by people aged 3 and over) are: Scots (55,817), Polish (54,186), Chinese (27,381), and Urdu (23,394).[39]
Stone houses at Knap of Howar, evidence of a settled agricultural population and the beginnings of demographic growth, c. 3500 BC
At times during the last interglacial period (130,000–70,000 BC) Europe had a climate warmer than today's, and early humans may have made their way to what is now Scotland, though archaeologists have found no traces of this. Glaciers then scoured their way across most of Britain, and only after the ice retreated did Scotland again become habitable, around 9600 BC.[40]Mesolithic hunter-gatherer encampments formed the first known settlements, and archaeologists have dated a site near Biggar to around 8500 BC.[41] Numerous other sites found around Scotland build up a picture of highly mobile boat-using people making tools from bone, stone and antlers, probably with a very low density of population.[42]Neolithic farming brought permanent settlements, such as the stone house at Knap of Howar on Papa Westray dating from 3500 BC, and greater concentrations of population. Extensive analyses of Black Loch in Fife indicate that arable land spread at the expense of forest from about 2000 BC until the period of the first century AD Roman advance into lowland Scotland, suggesting an expanding settled population. Thereafter, there was re-growth of birch, oak and hazel for a period of five centuries, suggesting that the Roman invasions had a negative impact on the native population.[43]
There are almost no written sources from which to re-construct the demography of early medieval Scotland. Estimates have been made of a population of 10,000 inhabitants in Dál Riata and 80–100,000 for Pictland, which was probably the largest region.[44] This does not include figures for parts of Northumbria now in Scotland. It is likely that the 5th and 6th centuries saw higher mortality rates due to the appearance of bubonic plague, which may have reduced net population.[45] The examination of burial sites for this period like that at Hallowhill, St Andrews indicate a life expectancy of only 26–29.[44] The known conditions have been taken to suggest it was a high fertility, high mortality society, similar to many developing countries in the modern world, with a relatively young demographic profile, and perhaps early childbearing, and large numbers of children for women. This would have meant that there were a relatively small proportion of available workers to the number of mouths to feed. This would have made it difficult to produce a surplus that would allow demographic growth and more complex societies to develop.[46] From the formation of the kingdom of Alba in the tenth century, to before the Black Death reached the country in 1349, estimates based on the amount of farmable land, suggest that population may have grown from half a million to a million.[47] Although there is no reliable documentation on the impact of the plague, there are many anecdotal references to abandoned land in the following decades. If the pattern followed that in England, then the population may have fallen to as low as half a million by the end of the 15th century.[48] Compared with the situation after the redistribution of population in the later clearances and the industrial revolution, these numbers would have been relatively evenly spread over the kingdom, with roughly half living north of the Tay.[49] Perhaps ten per cent of the population lived in one of many burghs that grew up in the later medieval period, mainly in the east and south. It has been suggested that they would have had a mean population of about 2,000, but many would be much smaller than 1,000 and the largest, Edinburgh, probably had a population of over 10,000 by the end of the era.[50]
Calculations based on Hearth Tax returns for 1691 indicate a population of 1,234,575, but this figure may have been seriously affected by the famines of the 1690s. The first reliable information is a census conducted by the Reverend Alexander Webster in 1755, which shows the inhabitants of Scotland as 1,265,380.[51] By the time of the first decadal census in 1801, the population was 1,608,420. Scotland grew steadily in the 19th century, to 2,889,000 in 1851 and 4,472,000 in 1901.[52] Even with the growth of industry there were insufficient good jobs, as a result, during the period 1841–1931, about 2 million Scots emigrated to North America and Australia, and another 750,000 Scots relocated to England.[53]
With a population of 4.8 million in 1911, Scotland sent 690,000 men to First World War, of whom 74,000 died in combat or from disease, and 150,000 were seriously wounded.[54][55] Thus, although Scots were only 10 per cent of the British population, they made up 15 per cent of the national armed forces and eventually accounted for 20 per cent of the dead.[56] While emigration began to tail off in England and Wales after the First World War,[57] it continued apace in Scotland, with 400,000 Scots, ten per cent of the population, estimated to have left the country between 1921 and 1931.[58] When the Great Depression hit in the 1930s there were no easily available jobs in the US and Canada and emigration fell to less than 50,000 a year, bringing to an end the period of mass migrations that had opened in the mid-18th century.[59] This contributed to the growth of the population, which reached a peak of 5,240,800 in 1974. Thereafter it began to fall slowly, moving down to 5,062,940 in 2000. There was also a decrease in some urban populations as a result of policies of slum clearance, overspill and relocation to new towns, with the population of Glasgow falling from over a million in 1951 to 629,000 in 2001. Rural areas also saw a loss of population, particularly the Highlands and Hebrides.[60]
Scotland's population grew most years between the first census in 1855 up to around 5.2 million in 1974.[61] However, from 1974 to 2000 there was a natural decrease in population, with both an excess of deaths over births and of emigration over immigration - particularly to the rest of the United Kingdom. Since 2000 the population has increased most years and is projected to peak in 2028 at 5.48 million and thereafter decline to 5.39 million in 2045.[62][63]
Fertility and morbidity rates
Both the Scottish Government and leading academics in Scotland had expressed some concern over the historic falling annual number of births in Scotland.[64] There were 49,863 live births registered in 2019, the lowest count since records began in 1855.[65] In 2004, for example, there were 4,012 more deaths than births, although for the subsequent five years this process had been reversed with 4,342 more births than deaths in 2008. The long-term reversal in the declining birth rate of the 1990s was confirmed in 2009 when the Registrar General for Scotland reported that with 60,000 births recorded in 2008, this was the highest recorded fertility rate since 1995.[66]
The population of children under age 5 grew by 6% (293,000) over the ten-year period between 2001 and 2011. However, the number of children aged 5–14 fell by 11% (69,000). The population of people over 65 also grew by 11% (85,000) and they now represent 17% of the total population and for the first time there are more people over 65 than under 15 years of age. Significantly, in 2011 there were 230,000 people over 80 years of age.[67]
Fertility statistics
Live births per 1,000 women by age grouping in Scotland
Live births per 1,000 women in single year ages in Scotland
Stillbirth rate in Scotland over time
Migration
The 2021 United Kingdom census recorded 648,418 people who were born in Scotland but now living in England and Wales (1.1% of the total population). The South East of England (118,021 people), North West of England (89,025) and Greater London (75,004) were the three most popular destinations, together accounting for around 43% of the Scotland-born population in England and Wales.[68] In the equivalent census conducted in 2022, there were 506,207 England-born and 18,219 Wales-born residents living in Scotland, for a total of 524,426 (9.6% of the total population).[16] Politicians and academics also noted that in the first years of the 21st century the previous trend of a net migration away from Scotland had reversed with significant immigration to Scotland from the rest of the United Kingdom. Between 2001 and 2011 Scotland's population grew by 5% (233,000), the fastest rate of growth for at least 100 years.[67] Similarly, since 2004 there had also been a growing influx of arrivals from the new EUaccession states such as Poland, Czech Republic, Lithuania and Latvia, contributing to the recent growth of the population. Consequently, since 2002 the birth rate gradually increased with 53,957 births recorded in 2004, and in 2008 the number of live births was 60,041.[69] Between 2001 and 2022, the number of non-UK born residents living in Scotland increased from 191,571 (3.8% of the total population in Scotland) to 554,883 (10.2% of the total population).[16]
In its 2011 review the GROS predicted that Scotland's population would rise by 10% to 5.76 million by 2035 and to 6.2m by 2085. Until 2028 both net inward migration and the birth rate exceeding the death rate would contribute to this growth, however beyond this date population increase would be due only to a positive net migration as the ageing population would result in more deaths than births. This later trend would be dramatic with the number of children under 16 projected to rise by only 3% while the number of people over 65 is projected to increase by 63% (from 0.88m to 1.43m).[1]
In its 2022 annual population review the National Records of Scotland projected that the Scottish population would continue to rise until 2028 - peaking at 5.48 million - and would then fall by 1.8% by 2045 to 5.39 million.[71]
Sex ratio: at birth: 1.04 male(s)/female under 15 years: 1.04 male(s)/female 15-64 years: 0.94 male(s)/female 65 years and over: 0.88 male(s)/female total population: 0.94 male(s)/female (mid-2011 est.)
Infant mortality rate: 4.1 deaths/1,000 live births (2011 est.)[74]
Life expectancy at birth (2011):[1] total population: 78.4 years for those born in 2010 (cf. 72.2 in 1981) male: 76.1 years for those born in 2010 (cf. 69.1 in 1981) female: 80.6 years for those born in 2010 (cf. 75.3 in 1981)
General fertility rate:[1] The general Fertility Rate (GFR) is based on the rate of births per 1000 females of child-bearing age (i.e. 15–44 years of age).
In 2011 it was 56.4 births per 1000 women. For comparison, during the latter part of the 20th century it was at its highest during the 'baby boom' of the 1960s. The GFR reached a peak of 99.5 births per 1000 women in 1962. In 2001 the GFR had fallen to its lowest post World War II level of 50 births per 1000 women.
Marriages:[1] In 2011 there were 29,135 marriages in Scotland. This is a 2.3% increase on 2010.
By way of historical comparison, the highest ever recorded was 53,522 in 1940. In the 1970s there were on average between 40 and 45,000 marriages per annum. The lowest annual figure in recent years was 27,524 in 2009 and lowest on record was 19,655 in 1858.
Of specific interest were the number of so-called 'tourist marriages', where neither partner was resident in Scotland. In 2011 there were 6,829 such marriages, of which 48% took place at Gretna, the most popular of all wedding venues.
Civil partnerships:[1] The Civil Partnership Act 2004 came into force in December 2005. In 2006 the number of civil partnership registrations was 1,047. A one-off figure given the number of long-standing relationships which already existed which could be registered. Since then the number of ceremonies each year fell from 688 in 2007 to 465 registrations in 2010. 2011 saw the first increase since 2006 with 554 registrations.
Literacy: definition: age 15 and over can read and write total population: 99% male: 99% female: 99% (2005 est)
12"1991 census - local base statistics". Nomis: Official Census and Labour Market Statistics. Retrieved 14 June 2023.Tables L01 to L18: Demographic and economic characteristics > L07 Country of birth
↑Office of Population Censuses and Surveys; General Register Office for Scotland; Registrar General for Northern Ireland (1997): 1991 Census aggregate data. UK Data Service (Edition: 1997). DOI: http://dx.doi.org/10.5257/census/aggregate-1991-1 This information is licensed under the terms of the Open Government Licence
↑"Religion (detailed)"(PDF). Scotland's Census 2011. National Records of Scotland. Retrieved 12 April 2015. The census choices were None, Church of Scotland, Roman Catholic, Other Christian, Muslim, Buddhist, Sikh, Jewish, Hindu, and Another religion or body. Those answering Other Christian or Another religion were asked to write which one.
↑P. J. Ashmore, Neolithic and Bronze Age Scotland: An authoritative and Lively Account of an Enigmatic Period of Scottish Prehistory (2003).
↑T. C. Smout, R. MacDonald and F. Watson, A History of the Native Woodlands of Scotland 1500–1920. Edinburgh University PressISBN9780748632947, p. 34.
12L. R. Laing, The Archaeology of Celtic Britain and Ireland, c. AD 400-1200 (Cambridge: Cambridge University Press, 2006), ISBN0521547407, pp. 21–22.
↑P. Fouracre and R. McKitterick, eds, The New Cambridge Medieval History: c. 500-c. 700 (Cambridge: Cambridge University Press, 2005), ISBN0521362911, p. 234.
↑A. Woolf, From Pictland to Alba: 789–1070 (Edinburgh: Edinburgh University Press, 2007), ISBN0748612343, pp. 17–20.
↑R. E. Tyson, "Population Patterns", in M. Lynch, ed., The Oxford Companion to Scottish History (New York, 2001), pp. 487–88.
↑S. H. Rigby, ed., A Companion to Britain in the Later Middle Ages (Oxford: Wiley-Blackwell, 2003), ISBN0631217851, pp. 109–11.
↑J. Wormald, Court, Kirk, and Community: Scotland, 1470-1625 (Edinburgh: Edinburgh University Press, 1991), ISBN0748602763, p. 61.
↑E. Gemmill and N. J. Mayhew, Changing Values in Medieval Scotland: a Study of Prices, Money, and Weights and Measures (Cambridge: Cambridge University Press, 1995), ISBN0521473853, pp. 8-10.
↑K. J. Cullen, Famine in Scotland: The 'Ill Years' of The 1690s (Edinburgh: Edinburgh University Press, 2010), ISBN0748638873, pp. 123-24.
↑A. K. Cairncross, The Scottish Economy: A Statistical Account of Scottish Life by Members of the Staff of Glasgow University (Glasgow: Glasgow University Press, 1953), p. 10.
↑R. A. Houston and W. W. Knox, eds, The New Penguin History of Scotland (London: Penguin, 2001), ISBN0140263675, p. xxxii.
↑I. F. W. Beckett and K. R. Simpson, eds. A Nation in Arms: a Social Study of the British Army in the First World War (Manchester: Manchester University Press, 1985), ISBN0719017378, p. 11.
↑R. A. Houston and W. W. Knox, eds, The New Penguin History of Scotland (London: Penguin, 2001), ISBN0140263675, p. 426.
↑J. Buchanan, Scotland (Langenscheidt, 3rd edn., 2003), p. 49.
↑F. M. L. Thompson, The Cambridge Social History of Britain, 1750-1950: People and Their Environment (Cambridge: Cambridge University Press, 1990), ISBN0521438136, pp. 9-10.
↑J. Buchanan, Scotland (Langenscheidt, 3rd edn., 2003), p. 51.
↑S. M. Millett, The Scottish Settlers of America: the 17th and 18th Centuries (Genealogical Publishing Com, 2009), p. 64.
↑C. G. Brown, "Charting everyday experience", in L. Abrams and C. G. Brown, A History of Everyday Life in Twentieth-Century Scotland (Edinburgh: Edinburgh University Press, 2010), ISBN0748624317, p. 20.
↑"Migration: helping Scotland prosper". Scottish Government. p.4. Retrieved 1 September 2020. Migration to Scotland supports economic growth and the delivery of public services. It helps to address the serious issue of long term demographic change and enhances and sustains our communities. All of our future population growth is projected to come from migration and any reduction in migration – whether that's from the rest of the UK, the EU or internationally – will impact on the size of our working age population.
↑"Vital Events Reference Tables 2019". National Records of Scotland. 23 June 2020. p.7. Archived from the original on 3 September 2020. Retrieved 1 September 2020. Births have been falling over the long term and fell to their lowest point in 2002 before increasing to reach a recent high point of 60,041 in 2008 and have decreased steadily since then.
This page is based on this Wikipedia article Text is available under the CC BY-SA 4.0 license; additional terms may apply. Images, videos and audio are available under their respective licenses.


 Scottish Gaelic
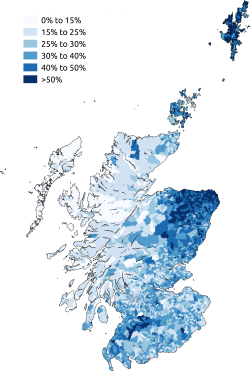 Scots
Scots


