Including Russian occupied territory in 2022: 41,130,432 (State Statistics Service of Ukraine)[1] Excluding Russian occupied territory: 36,744,636 (UN Department of Economic and Social Affairs)[2] 33,443,000 estimate in 2024 (International Monetary Fund[3])
In July 2023, Reuters reported that due to refugee outflows, the population of Ukrainian-controlled areas may have decreased to 28 million,[6] a steep decline from Ukraine's 2020 population of almost 42 million.[7][8]
This drop is in large part due to the ongoing Ukrainian refugee crisis and loss of territory caused by Russia's invasion of Ukraine, which resulted in mass emigration from the Ukrainian people. The demographic decline is also affected by a very low birth rate and a high death rate. The most recent (and only) census of post-Soviet Ukraine occurred in 2001, and much of the information presented is potentially inaccurate or outdated.[9]
Since 2021, the Ukrainian fertility rate has fallen below 1.3, and is now one of the lowest in the world. By 2024, it was one of the ten lowest in the world, falling under 1.00.[10]
History
Historical population
There were roughly four million Ukrainians at the end of the 17th century.[11] However, population estimates from this period are approximate and may vary depending on methodology and available records.
The estimated population figures for Ukraine in the early 20th century are based on various sources. The 1931 population statistics were estimated by Professor Zenon Kuzelia,[12] as an official census was not conducted in Soviet Ukraine during that year.
Population change
The following graph represents Ukraine's population trends since the early 20th century.
Data for 1926–2001 is based on official Soviet and Ukrainian censuses.[13] The 2014 and 2020 figures are adjusted estimates, excluding Crimea and occupied territories in Donbas.[14]
Natural change and migration
The natural population change, migration trends, and fertility rates are shown below:
Natural population change and migration data are sourced from the Ukrainian State Statistics Service.[15] The fertility rate figures are derived from United Nations estimates.[16]
Notes
The population estimate for the 17th century is approximate and based on historical demographic models.
The 1931 population figure is not from an official census but from an academic estimate.
Post-2014 population figures exclude Crimea and parts of Donetsk and Luhansk regions under occupation.
Famines and migration
Demographic impact of the Holodomor and World War II
The Ukrainian famines of the 1930s and the devastation of World War II created a demographic catastrophe for Ukraine. In 1933, life expectancy at birth dropped to as low as 10 years for females and 7 years for males. During 1941–1944, life expectancy plateaued around 25 years for females and 15 years for males.[17]
According to The Oxford Companion to World War II, over 7 million Ukrainians — more than one-sixth of the pre-war population — were killed during the conflict.[18]
Migration trends in independent Ukraine
Following Ukraine's independence, significant migration occurred:
1991–1992: Over 1 million people moved into Ukraine, primarily from other former Soviet republics.
1991–2004: A total of 2.2 million immigrants arrived in Ukraine, with 2 million of these coming from other former Soviet Union states.
Between 1991 and 2004, 2.5 million emigrated from Ukraine, with 1.9 million migrating to other former Soviet Union republics.[19]
As of 2015, immigrants made up an estimated 11.4% of the total population of Ukraine, equating to 4.8 million people.[20]
Ukrainian diaspora
In 2006, there were approximately 1.2 million Canadians of Ukrainian descent,[21] giving Canada the third-largest Ukrainian population worldwide, behind Ukraine and Russia. Significant Ukrainian diaspora communities also exist in Poland, the United States, Brazil, Kazakhstan, and Argentina.
Recent migration trends and economic impact
Since about 2015, a growing number of Ukrainians have worked in the European Union, particularly in Poland. According to Eurostat, 662,000 Ukrainians received EU residence permits in 2017, with 585,439 of these residing in Poland.
World Bank statistics from 2019 revealed that remittances sent back to Ukraine had approximately doubled from 2015 to 2018, making up about 4% of Ukraine's GDP.[22][23]
Ukraine records only citizens who apply for foreign citizenship, not those who seek foreign residency.[24]
Migration during the Russian invasion of Ukraine
With the Russian invasion of Ukraine, approximately 8 million people fled Ukraine during the ensuing Ukrainian refugee crisis, Europe's largest refugee crisis since World War II. Most refugees sought asylum in Central Europe.
Population Decline
Population of Ukraine from 1950
According to estimates by the State Statistics Service of Ukraine, the population of Ukraine (excluding Crimea) on 1 May 2021 was 41,442,615.[1]
The country's population has been declining since the 1990s because of a high emigration rate, coupled with high death rates and low birth rates. The population has been shrinking by an average of over 300,000 annually since 1993.
In 2007, the country's rate of population decline was the fourth highest in the world.[27] But between 2008 and 2010, over 1.5 million children were born in Ukraine, compared with fewer than 1.2 million in 1999–2001. In 2008, Ukraine posted record-breaking birth rates not seen since its 1991 independence. Infant mortality rates also dropped from 10.4 deaths to 8.3 per 1,000 children under one year of age, a lower rate than in 153 other countries.[28]
In 2019, the Ukrainian government conducted an electronic census using multiple sources, including mobile phone and pension data, and estimated that Ukraine's population, excluding Crimea and parts of the Donbas, to be 37.3 million. About 20 million were of active working age.[29][30]
"Regardless of how long the war lasts and whether or not there is further military escalation, Ukraine is unlikely to recover demographically from the consequences of the war. Even in 2040 it will have only about 35 million inhabitants, around 20% fewer than before the war (2021: 42.8 million) and the decline in the working-age population is likely to be the most severe and far-reaching."
The study examined different scenarios, from a "best case", in which the war ended in 2023 without significant further escalation, to a "worst case", ending in 2025 after further escalation. Flight from war particularly affects the southern and eastern regions and especially educated women of child-bearing age and their children. With an estimate of more than 20% of refugees not returning, the author of the study Maryna Tverdostup concludes that this will lead to long-term shrinking and will significantly impair the conditions for reconstruction.[31]
Fertility and natalist policies
As of 2020, the birth rate in Ukraine was 8.1 live births/1,000 population, and the death rate 14.7 deaths/1,000 population.[4]
Lowest-low fertility, defined as total fertility below 1.3, is being encountered across Europe, attributed by many to postponement of the initiation of childbearing. Ukraine, where total fertility (1.1 in 2001), was one of the world's lowest, shows that there is more than one pathway to lowest-low fertility. Although Ukraine underwent immense political and economic transformations from 1991 to 2004, it maintained a young age at first birth and nearly universal childbearing. Analysis of official national statistics and the Ukrainian Reproductive Health Survey show that fertility declined to very low levels without a transition to a later pattern of childbearing. Findings from focus group interviews suggest that the early fertility pattern was explained by the persistence of traditional norms for childbearing and the roles of men and women, concerns about medical complications and infertility at a later age, and the link between early fertility and early marriage.[32] Ukraine subsequently has one of the oldest populations in the world, with an average age of 40.8 years.[33]
To help mitigate population decline, the government increased child support payments, providing one-time payments of 12,250 hryvnias for the first child, 25,000 hryvnias for the second and 50,000 hryvnias for the third and fourth, along with monthly payments of 154 hryvnias per child.[34][35] The demographic trend showed signs of improvement as the birth rate grew steadily from 2001 to 2013.[36] Five of the country's 24 provinces showed net population growth over the first nine months of 2007, and nationwide population decline showed signs of stabilization. In 2007, the highest birth rates were in the western oblasts.[37] In 2008, Ukraine emerged from lowest-low fertility, and the upward trend continued to 2012, with population decline slowing year after year. If early 2010s trends had persisted, the population could have returned to positive growth later that decade. Similar trends occurred in Russia and Belarus, which experienced population growth in the 2010s.
In 2014, the strong drop in births returned, and 2018 saw fewer than half the number of births of 1989 (see demographic tables). In 2020, the number of births decreased to 293,000, reaching rates not seen in a quarter century.
Mass emigration and property destruction caused by the Russian invasion led Ukraine's birth to drop still further: it was 28% lower in the first half of 2023 than the first half of 2021.[38] However, a small but meaningful increase in births may occur in the future, with a projected fertility rate increase to 1.60 children per woman in the year 2030, higher than the 2012 peak of 1.53.[39]
Population
Life expectancy in Ukraine since 1900Life expectancy in Ukraine since 1960 by gender
(a) Information is given for Ukraine's territory within its old boundaries up to 17 September 1939 (b) Information is given for Ukraine's territory within its present-day boundaries, after the Soviet annexation of Eastern Galicia and Volhynia in September 1939.
After WWII (1945-present)
Source: State Statistics Service of Ukraine[46] Note: This table uses the sticky table format to make scrolling easier. If you prefer, you can disable it.
Note: Russia occupied and later annexed the Crimean Peninsula in 2014. The annexation is internationally recognized only by a small number of nations. Following the occupation, the Ukrainian statistics service could no longer provide accurate data on Crimea. Thus, as of 2014, the territories of the Autonomous Republic of Crimea and the city of Sevastopol are not included in the Demographics of Ukraine but in the Demographics of Russia. All data from State Statistics Service of Ukraine.
Structure of the population
Population Estimates by Sex and Age Group (01.I.2021) (The government of Ukraine has informed the United Nations that it is not in a position to provide statistical data on the Autonomous Republic of Crimea or the city of Sevastopol.): [51]
Age group
Male
Female
Total
%
Total
19 195 376
22 223 341
41 418 717
100
0–4
871 807
817 549
1 689 356
4.08
5–9
1 184 223
1 113 485
2 297 708
5.55
10–14
1 179 905
1 112 800
2 292 705
5.54
15–19
978 279
923 149
1 901 428
4.59
20–24
1 029 297
969 836
1 999 133
4.83
25–29
1 323 862
1 255 946
2 579 808
6.23
30–34
1 705 251
1 646 672
3 351 923
8.09
35–39
1 758 922
1 739 010
3 497 932
8.45
40–44
1 533 807
1 583 673
3 117 480
7.53
45–49
1 420 874
1 541 601
2 962 475
7.15
50–54
1 269 395
1 447 927
2 717 322
6.56
55–59
1 285 999
1 603 824
2 889 823
6.98
60–64
1 225 350
1 685 084
2 910 434
7.03
65–69
921 671
1 454 610
2 376 281
5.74
70–74
656 532
1 190 134
1 846 666
4.46
75–79
323 037
740 699
1 063 736
2.57
80–84
335 863
874 371
1 210 234
2.92
85–89
113 869
308 482
422 351
1.02
90–94
54 945
164 392
219 337
0.53
95–99
15 892
37 973
53 865
0.13
100+
6 596
12 124
18 720
0.05
Age group
Male
Female
Total
Percent
0–14
3 235 935
3 043 834
6 279 769
15.16
15–64
13 531 036
14 396 722
27 927 758
67.43
65+
2 428 405
4 782 785
7 211 190
17.41
Regional data
Population by oblast
Population of Ukraine by Oblast as of December 2021
Name of Oblast
Population as of Dec 2021
According to the electronic census on December 1, 2019
Note: Recent data for Donetsk and Luhansk Oblasts have been affected by the war in Donbas, and may only include births within the government-held parts of the oblasts.[52]
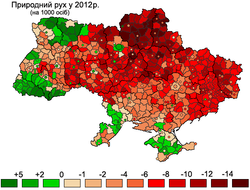
Compared to 2012, the amount of attrition increased in 2013 by 16,278 persons, or 3.1 to 3.5 persons per 1,000 inhabitants (real). Natural decreases were observed in 23 oblasts of the country, while natural increases were recorded only in Kyiv and in the Zakarpattya, Rivne and Volyn oblasts (5,302, 3,689, 2,889 and 1,034 people, respectively).
Some regions registered a low natural decline, such as Chernivtsi, Ivano-Frankivsk, Sevastopol, Lviv, Ternopil, Crimea, Kherson and Odesa (−55, −642, −863, −2,124, −2,875, −2,974, −3,748 and −4,448 people, respectively). The largest declines were recorded in Donetsk, Luhansk, Dnipro, Kharkiv, Poltava and Chernihiv (−28,311, −15,291, −15,007, −12,765, −10,062 and −10,057, respectively), regions which share a low birth rate and high mortality of a large urban population and rapid aging of the rural population.
Net migration rate
−5.4 migrant(s)/1,000 population (2015).
Infant mortality rate
9.1 deaths/1,000 infants live births for 4,564 deaths (2010)
9.0 deaths/1,000 infants live births for 4,511 deaths (2011)
8.4 deaths/1,000 infants live births for 4,371 deaths (2012)
8.0 deaths/1,000 infants live births for 4,030 deaths (2013)
8.9 deaths/1,000 infants live births for 2,193 death for January–June 2011
8.6 deaths/1,000 infants live births for 2,190 death for January–June 2012
7.8 deaths/1,000 infants live births for 1,993 deaths for January–June 2013[53]
None of the oblasts in 2013 recorded a higher fertility rate than 2.10 children per woman, though rural areas saw higher rates in the Rivne Oblast (2.50) and Volyn Oblast (2.20). While close-to-generational renewal rates were achieved in the Odesa (2.04), Zakarpattia (2.00), Mykolaiv (1.95), Chernivtsi (1.93) and Zhytomyr (1.91) oblasts, they were weaker in the Luhansk (1.41), Sumy (1.47) and Cherkasy (1.53) oblasts.
Population pyramid of Ukraine in 1897Population pyramid of Ukraine in 1926Population pyramid of Ukraine in 2017Population change, 1970–2010Population change, 1970–1979Population change, 1989–2001Population change, 1989–2012Population change of urban settlements, 1970–1989Population change of urban settlements, 1989–2010
Demographic statistics according to the CIA World Factbook, unless otherwise indicated[33]
1.55 children born/woman (2018 est.) Country comparison to the world: 190th
1.54 children born/woman (2017 est.)
Net migration rate
4.6 migrant(s)/1,000 population (2018 est.) Country comparison to the world: 29th
0 migrant(s)/1,000 population (2017 est.)
Mother's mean age at first birth
24.9 years (2014 est.)
Population growth rate
0.04% (2018 est.) Country comparison to the world: 187th
−0.41% (2017 est.)
Life expectancy at birth
total population: 72.4 years. Country comparison to the world: 148th
male: 67.7 years
female: 77.4 years (2018 est.)
Ethnic groups
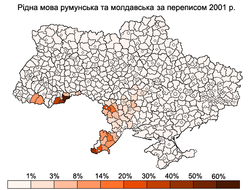
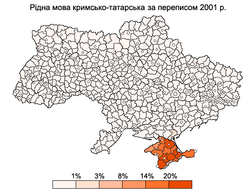
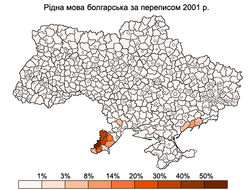
Ukrainian 77.8%, Russian 17.3%, Belarusian 0.6%, Moldovan 0.5%, Crimean Tatar 0.5%, Bulgarian 0.4%, Hungarian 0.3%, Romanian 0.3%, Polish 0.3%, Jewish 0.2%, other 1.8% (2001 est.)
Languages
Ukrainian (official) 67.5%, Russian (regional language) 29.6%, other (includes small Crimean Tatar-, Moldovan/Romanian-, and Hungarian-speaking minorities) 2.9% (2001 est.) Note: in February 2018, the Constitutional Court ruled that 2012 language legislation entitling a language spoken by at least 10% of an oblast's population to be given the status of "regional language" – allowing for its use in courts, schools, and other government institutions – was unconstitutional, thus making the law invalid; Ukrainian remains the country's only official nationwide language.
Religions
Orthodox (includes Ukrainian Autocephalous Orthodox (UAOC), Ukrainian Orthodox – Kyiv Patriarchate (UOC-KP), Ukrainian Orthodox – Moscow Patriarchate (UOC-MP)), Ukrainian Greek Catholic, Roman Catholic, Protestant, Muslim, Jewish Note: Ukraine's population is overwhelmingly Christian; the vast majority – up to two-thirds – identify themselves as Orthodox, but many do not specify a particular branch; the UOC-KP and the UOC-MP each represent less than a quarter of the country's population, the Ukrainian Greek Catholic Church accounts for 8–10%, and the UAOC accounts for 1–2%; Muslim and Jewish adherents each compose less than 1% of the total population (2013 est.).
During the post-WW2 period, the Russification of ethnic Ukrainians, as well as the mass immigration of ethnic Russians, significantly changed the ethnic and linguistic composition of Ukraine's population. The change was especially evident in Donbas, where Ukrainian speakers became a minority.
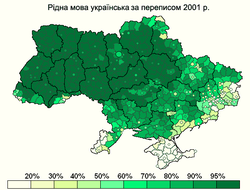
According to the 2001 census, the following languages are common in Ukraine: Ukrainian 67.5%, Russian 29.6%, Crimean Tatar, Urum (Turkic Greeks), Bulgarian, Moldovan/Romanian, Polish, Hungarian. The table below lists the total population of various ethnic groups in Ukraine and their native language, according to the 2001 census.[54]
Regional distribution of people in Ukraine by ethno-linguistic group in 2003.
Share of the rural population of Ukraine's regions that indicated Ukrainian as their native language from 1959 to 2001.
Share of the urban population of Ukraine's regions that indicated Ukrainian as their native language from 1959 to 2001.
Change in the proportion of the population of Ukraine's regions who consider Ukrainian their native language, from census to census between 1959 and 2001.
A 2018 survey conducted by the Razumkov Centre found that 71.7% of the population declared themselves believers in any religion, while 4.7% declared themselves non-believers, and 3.0% declared themselves atheists.[68] Of the total Ukrainian population, 87.4% declared they were Christians, comprising 67.3% who declared themselves Eastern Orthodox, 10.2% Catholics (split into 9.4% Ukrainian Greek Catholics and 0.8% Latin Catholics), 7.7% "Christians", and 2.2% Protestants. Judaism comprises 0.4% of the population. In earlier surveys, between 1 and 2% of the population stated that it adhered to Islam.
According to data from 2018, among those Ukrainians declaring themselves Orthodox Christians, 28.7% said they were members of the Ukrainian Orthodox Church of the Kyivan Patriarchate (incorporated as of 5 January 2019 into the Orthodox Church of Ukraine), while 12.8% said they were members of the Ukrainian Orthodox Church of the Moscovian Patriarchate (an autonomous Eastern Orthodox church under the Russian Orthodox Church). A further 0.3% said they were members of the Ukrainian Autocephalous Orthodox Church, which, like the Kyivan Patriarchate, was incorporated in 2019 into the Orthodox Church of Ukraine. Among the remaining Orthodox Ukrainians, 23.4% declared themselves "simply Orthodox", without affiliation to any patriarchate, while a further 1.9% declared that they "did not know" which patriarchate or Orthodox church they belonged to.[68]
Regional differences
Regional differences in population change
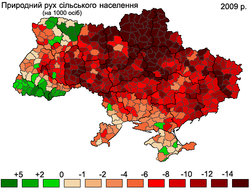
Natural population growth rates by oblast, 2009
Between the Soviet census of 1989 and the Ukrainian census of 2001, Ukraine's population declined from 51,706,600 to 48,457,020,[69] a loss of 2,926,700 people, or 5.7% of the 1989 population. However, this trend was quite uneven and subject to regional variation. Two oblasts in western Ukraine, Rivne and Zakarpattia, saw slight population increases of 0.3% and 0.5%, respectively. A third western Ukrainian oblast, Volyn, lost less than 0.1% of its population between 1989 and 2001.[69] Collectively, between 1989 and 2001, the seven westernmost Ukrainian oblasts lost 167,500 people, or 1.7% of their 1989 population. The total population of these oblasts in 2001 was 9,593,800.[69]
Between 1989 and 2001, the population of Kyiv City increased by 0.3%[69] due to positive net migration.[citation needed] Outside Kyiv, the central, southern and eastern oblasts experienced a severe population declines. Between 1989 and 2001, the Donetsk Oblast lost 491,300 people, or 9.2% of its 1989 population, while the neighbouring Luhansk Oblast lost 11% of its population.[69]Chernihiv Obast, in central Ukraine (northeast of Kyiv), lost 170,600 people, or 12% of its 1989 population, the highest percentage loss in of any Ukrainian oblast. In southern Ukraine, Odesa Oblast lost 173,600 people, or 6.6% of its 1989 population.
By 2001, Crimea's population declined by 29,900, representing only a 1.4% loss of its 1989 population.[69] This however was due to the influx of approximately 200,000 Crimean Tatars– equivalent to approximately 10% of Crimea's 1989 population– who arrived in Crimea after 1989 and whose population in that region increased by a factor of 6.4 (from 38,000 to 243,400 between 1989 and 2001).[70] Collectively, the net population loss in Ukraine outside the westernmost oblasts was 2,759,200, or 6.6% of the 1989 population. The total population of these regions in 2001 was 39,186,100.[69]
Overall in 1989–2001, the pattern of population change was one of slight growth in Kyiv, slight declines in western Ukraine, large declines in eastern, central and southern Ukraine, and a relatively small decline in Crimea due to a large influx of Crimean Tatars.
Natural population growth
All population, 2012
Urban population, 2009
Rural population, 2009
Regional differences in birth and fertility rates
Ukraine's total fertility rate is one of the lowest in Europe.[71][72] However, significant regional differences in birth rates may account for some of the demographic differences. In the third quarter of 2007, for instance, the highest birth rate among Ukrainian oblasts occurred in Volyn Oblast, with a birth rate of 13.4/1,000 people, compared to the Ukrainian countrywide average of 9.6/1,000 people.[73] Volyn's birthrate was higher than the average birth rate of any European country except Iceland and Albania.[74]
In 2007, for the first time since 1990, five Ukrainian oblasts (Zakarpattia, Rivne, Volyn, Lviv, and Kyiv oblasts) experienced more births than deaths.[75] This demonstrated a positive trend of increasing birthrates in the preceding years throughout Ukraine. The ratio of births to deaths in those oblasts in 2007 was 119%, 117%, 110%, 100.7%, and 108%, respectively.[75]
With the exception of the Kyiv Oblast, all of the oblasts with more births than deaths were in the less-industrially developed oblasts of western Ukraine. According to a spokesperson for Ukraine's Ministry of Justice, the overall ratio of births to deaths in Ukraine improved from 1 to 1.7 in 2004–2005 to 1 to 1.4 in 2008. However, the worst birth-to-death ratios in the country were in the eastern and central oblasts of Donetsk, Luhansk, Cherkasy and Poltava. These areas saw 2.1 deaths for every birth.[76]
While abortion rates in the North, South, East and Center of Ukraine are relatively homogeneous, the Western region differs greatly. Overall, the abortion rate in western Ukraine is three times lower than in other regions. This is not due to increased use of modern contraceptive methods in the West, but to the fact that pregnant women in the Western regions are more likely to keep their babies.[77] Donetsk and Dniproptrovsk oblasts in eastern and central Ukraine have the country's highest abortion rate.[78]
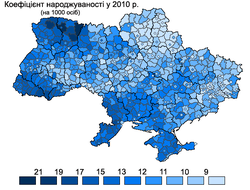
Natural population growth
The birth rate in Ukraine, 2003.
The birth rate in Ukraine, 2010.
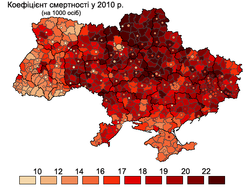
The death rate in Ukraine, 2010.
Regional differences in death rates and health
Death rate from suicides per 100.000 people
Death rates also vary widely by region; eastern and southern Ukraine have the highest death rates in the country, and the life expectancy for children born in Chernihiv, Dnipropetrovsk, Donetsk, Kherson, Kropyvnytskyi, Luhansk, Mikolaiv, and Odesa oblasts is 1.5 years lower than the national average.[79]
Ukraine had a suicide rate of 16.5 per 100,000 population in 2017, a significant decrease from the suicide rate of 29.6 per 100,000 in 1998. Suicides were more frequent in the central part of the country (the highest suicide rate was in Kirovohrad Oblast; in western Ukraine, the suicide rate was lower than the national average. Lviv Oblast had the lowest suicide rate (5.3).[80]
Southern and eastern Ukraine also suffered from the highest rates of HIV and AIDS, which impacts life expectancy. In late 2000, 60% of all AIDS cases in Ukraine were concentrated in the Odesa, Dnipropetrovsk, and Donetsk oblasts.[81] A major reason behind the higher rates was that the urbanized and industrialized oblasts in the East and South of Ukraine suffered most from the economic crisis in the 1990s, leading to the increased spread of unemployment, alcoholism, and drug abuse, setting the conditions for a wider spread of the epidemic.[82]
Regional differences in income
Average monthly salary by oblast in US dollars, 2019.
The western and central oblasts of Ukraine had lower GDP per capita than Kyiv and the industrialized eastern oblasts of Ukraine. In December 2019, the average monthly salary in Ukraine was 12,264 hryvnias (519 US dollars). Chernihiv Oblast (northern Ukraine) and Kirovohrad Oblast (central Ukraine) had the lowest monthly salary of 8,851 and 9,450 hryvnias, respectively. In contrast, the monthly wage in the city of Kyiv was 18,869 hryvnias per month, and in Kyiv Oblast, 13,259 per month.[83] In 2013, outside of the capital city of Kyiv, the wealthiest oblast was Donetsk with an annual income of 31,048 hryvnias. But as of 2017, it ranked second poorest after Luhansk Oblast, with annual incomes 25,278 hryvnias and 16,416 hryvnias, respectively.[84] Both are in eastern Ukraine and sustained direct losses as a consequence of military actions.
Ukraine recorded one of the sharpest declines in poverty of any transition economy in 2001–2016. The poverty rate, measured against an absolute poverty line (below $1.25 per day, based on World Bank numbers) fell from a high of 32 percent in 2001 to 8 percent in 2005. In terms of poverty rates, the central and northern oblasts have the country's highest poverty rates: 10.0%. The western and southern oblasts are 9.1% and 9%, respectively. Kyiv City had the lowest poverty rate: 1.4%.[85] The percent of the population living under $5.50 a day was 19% in 2005 and dropped to 4.0 percent in 2018.[86][87]
Urbanization
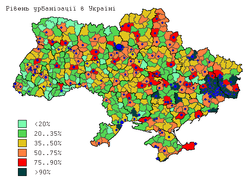
Urbanization rate, 2011
Population density, 2013
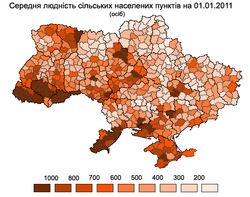
Median population of rural settlements, 2011
Migration
Migration growth rate per 1,000 people, 2012
Emigration
Ukraine is the major source of migrants for many EU member states. In the 1990s and early 2000s, Ukraine's sputtering economy and political instability contributed to rising emigration, especially to nearby Poland and Hungary, but also to other countries such as Italy, Portugal, Spain, Israel and Canada. Although estimates vary, approximately two to three million Ukrainian citizens were working abroad, in construction, service, housekeeping, and agriculture industries.
Between 1991 and 2004, the government counted 2,537,400 individuals who emigrated; 1,897,500 moved to other post-Soviet states, and 639,900 moved to other, mainly Western, states.[88]
By the early 2000s, Ukrainian embassies reported that 300,000 Ukrainian citizens were working in Poland, 200,000 in Italy, approximately 200,000 in the Czech Republic, 150,000 in Portugal, 100,000 in Spain, 35,000 in Turkey, 20,000 in the United States and smaller but significant numbers in Austria, Belgium, France, Germany, Greece, Sweden, Switzerland and the United Kingdom. The largest number of Ukrainian workers abroad, about one million, were in Russia. Since 1992, 232,072 persons born in Ukraine have emigrated to the United States.
Yet absolute numbers are less relevant to the economic impact on host countries than the volume of immigration as a proportion of the native population. Italy had the highest rate of Ukrainian emigrants as a proportion of the native population, while the far more populous Russia had the largest absolute confirmed number of Ukrainian emigrants (excluding Poland, Portugal and the Czech Republic, for which there was conflicting data).
Immigration
Between 1991 and 2003, about 100,000 illegal immigrants were detained at the western borders of Ukraine.[89] As of 2005, about 5,000 illegal immigrants were being detained yearly, mostly from China, India, Pakistan and Afghanistan.[89] At the time, about 3,000 officially registered refugees resided in Ukraine, of whom most were Afghans.[89]
Ukraine accepted some 62,000 refugees from Transnistria following its war in 1992.[89] That same decade, thousands more were also accepted from other post-Soviet conflict zones in Abkhazia, Chechnya and Tajikistan.[89]
Between the 1989 Soviet census and the 2001 census, an increased number of former CIS residents moved to Ukraine from war zones. The number of Armenians in Ukraine almost doubled to 99,900 people during this period, while the number of Georgians and Azerbaijanis also increased substantially.[89]
↑Державна служба статистикі України[State Statistics Committee of Ukraine]. State Statistics Committee of Ukraine (in Ukrainian). Archived from the original on 15 September 2002. Retrieved 14 December 2009.
12Особливості Релігійного І Церковно-Релігійного Самовизначення Українських Громадян: Тенденції 2010–2018[Features of Religious and Church – Religious Self-Determination of Ukrainian Citizens: Trends 2010–2018](PDF) (in Ukrainian), Kyiv: Razumkov Center in collaboration with the All-Ukrainian Council of Churches, 22 April 2018, pp.12, 13, 16, 31, archived(PDF) from the original on 26 April 2018 Sample of 2,018 respondents aged 18 years and over, interviewed 23–28 March 2018 in all regions of Ukraine except Crimea and the occupied territories of the Donetsk and Lugansk regions.
↑The International Encyclopedia of Sexuality of the Kinsey Institute. Tamara V. Hovorun, Ph.D., and Borys M. Vornyk, Ph.D. (Medicine). Rewritten and updated in 2003 by T. V. Hovorun and B. M. Vornyk(2003) UkraineArchived 23 January 2010 at the Wayback Machine
This page is based on this Wikipedia article Text is available under the CC BY-SA 4.0 license; additional terms may apply. Images, videos and audio are available under their respective licenses.