According to statistics from the European Union, the actual population has been reduced by at least 230,000 people who emigrated into European Union member states between 1998 and 2011.[8] Further Albanian news sources estimated at October 2012 that the real population is closer to the sum of 1,744,237 people who are accounted within all of the health funds of the country.[9][10] According to Bozhidar Dimitrov, the Bulgarian authorities have granted 87,000 to many of those emigrants a Bulgarian passport, as of 2012, which requires that they declare to be ethnic Bulgarians.[11][12] Since Bulgaria's entry into the European Union, and under pressure from fellow European Union members, Bulgaria imposed more stringent rules and measures for the acquisition of a Bulgarian citizenship and passport.
The provisions of the Ohrid agreement to elevate any minority language if the minority in question is above 20% of the population of any municipality into a co-official language for that municipality has created friction within the government, and between officials of different political and ethnic interests, resulting in the indefinite postponement of the census for almost twenty years until it was finally conducted in 2021.[13]
The process of industrialization and urbanization after the Second World War that caused the population growth to decrease involved the ethnic Macedonians to a greater extent than Muslims. Rates of increase were very high among rural Muslims: Turks and Torbesh (Macedonian Muslims) had rates 2.5 times those of the Macedonian majority, while Roma had rates 3 times as high. In 1994, Macedonians had a TFR of 2.07, while the TFR of others were: Albanian (2.10), Turkish (3.55), Roma (4.01), Serb (2.07), Vlachs (1.88) and Others (3.05). The TFR by religions was: Christian (2.17, with 2.20 for Catholics and 2.06 for Orthodox), Islam (4.02) and others (2.16).[28]
However, it is unlikely that this high minority TFR has continued since then in North Macedonia, as Balkan fertility elsewhere (Albania, Bosnia and Herzegovina, Kosovo) has dropped sharply toward the European average. A more recent survey[29] pegs Muslim fertility in North Macedonia at 1.7, versus 1.5 for non-Muslims.
Ethnic structure of SR Macedonia by settlements 1961.
Ethnic structure of SR Macedonia by settlements 1971.
Ethnic structure of SR Macedonia by settlements 1981.
Ethnic structure of SR Macedonia by settlements 1991.
Ethnic structure of SR Macedonia by settlements 1991.
Ethnic structure of R. Macedonia by settlements 1994.
Ethnic structure of R. Macedonia by settlements 2002.
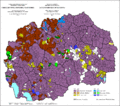
Ethnic structure of R. North Macedonia by settlements 2021.
Population of North Macedonia according to ethnic group 1948–2021[30]
1 Since 1994 residents who were permanently living abroad were no longer included
2Ashkali: 3,713 or 0.184%, Greeks: 422 or 0.021%, Russians: 368 or 0.018%, Slovenes: 365 or 0.018%, Poles: 162 or 0.008%, Ukrainians: 136 or 0.007%, Germans: 88 or 0.004%, Czechs: 60 or 0.005%, Slovaks: 60 or 0.005%, Jews: 53 or 0.003%, Italians: 46 or 0.002%, Austrians: 35 or 0.002%, Rusyns: 24 or 0.001%, Regionally affiliated: 829 or 0.041%, Non-declared: 404 or 0.02%, Others: 5332 or 0.264%
3 Regionally affiliated: 110 or 0.01%, Non-declared: 450* or 0.02%, Citizens for whom the data are taken from administrative sources, not included directly in the census (without ethnic declaration) 132,260 or 7.20%.*[clarification needed]
In 2017, 21,754 children were born in North Macedonia. The ethnic affiliation of these newborns was: 11,260 (51.76%) Macedonian; 7,404 (34.03%) Albanian; 940 (4.32%) Turkish; 1,276 (5.87%) Roma; 40 (0.18%) Vlach; 129 (0.59%) Serbian; 213 (0.98%) Bosniaks; 492 (2,26%) other ethnic affiliation and unknown.[32][33] In the school year 2016/2017 there were 192 715 students in elementary schools from which 104,756 (55%) were Macedonian, and 60,971 (32%) were Albanian, and in High schools there were 72 482 students from which 43,658 (60.1%) were Macedonian and 22 419 (30.9%) were Albanians. Furthermore, in 1999 Albanians accounted for 34.6% of newborns and 26.1% of students who finished high school in 2016, which was regulated by the Ministry of Education.
Newborns in North Macedonia according to ethnic group
12Under the terms of the Prespa agreement, the nationality of the country will be called "Macedonian/citizen of the Republic of North Macedonia" in full.
Other sources
Statistical Yearbook of the Republic of Macedonia 2004 (CD version)
This page is based on this Wikipedia article Text is available under the CC BY-SA 4.0 license; additional terms may apply. Images, videos and audio are available under their respective licenses.