This article needs to be updated. Please help update this article to reflect recent events or newly available information.(November 2022)
This article may need to be rewritten to comply with Wikipedia's quality standards. Relevant discussion may be found on the talk page. You can help. The talk page may contain suggestions.(April 2016)
The demographics of Poland include population density, ethnicity, education level, the health of the populace, economic status, religious affiliations, and other aspects of the population.
As of 31 December 2024, the population of Poland was 37,489,000,[1] while the usually resident population was 36,497,495.[3] The population has exhibited a negative growth rate of −0.42% per year. The population density was 119 people per square kilometer. The proportion of the population residing in urban areas was 59%, a figure that has been declining as a consequence of suburbanization. The sex ratio was 107 women per 100 men, 112 per 100 in urban areas, and 101 per 100 in rural areas. The median age was over 43 years (nearly 42 years for males and 45 years for females).[1]
According to the 2021 census by the Polish Central Statistical Office (GUS), as of March 31, 2021, Poland had an official population of 38,036,118,[4] a decrease of 0.9% since the 2011 census, and a usually resident population of 37,019,327,[5] a 2.7% decrease since the 2011 census. The difference between official and usually resident population comes from two different methodologies used by GUS for population counts.[6] In addition, Poland is home to a large number of foreigners, most of whom are not counted towards the official population of the country. As of the 2021 census, there were 1,433,779 of them in Poland.[7]
Poland's population has been growing quickly after World War II, during which the country lost millions of citizens. Population passed 38 million in the late 1980s and has since then stagnated within the 38.0-38.6 million range until the 2020s where the effects of the COVID-19 pandemic, the baby boom generation starting to die out and a baby bust started to overlap.
In 2018, the average life expectancy was 77.9 years; 74.1 for men and 82 for women. Population distribution is uneven, with densely populated south, moderately populated center and south-east and scarcely populated north.
Ethnically, Poland used to be one of the most multi-ethnic countries in Europe before World War II. It hosted the largest Jewish community in Europe, with Warsaw being the largest concentration of Jews in the world besides New York City. In the eastern parts of the country, Ukrainians and Belarusians often outnumbered Poles, while in the west there were large German communities. After the war, Poland became an ethnically homogeneous country. However, in the last decade Poland witnessed a mass-scale migration to the country, mostly from neighboring Ukraine and Belarus and increasingly from Central, South Asia and the Middle East.
In connection with the Russian invasion of Ukraine on 24 February 2022, as part of the Russo-Ukrainian War, by 2 August 2022, more than 10.4 million Ukrainian refugees left the territory of Ukraine, moving to the countries closest to the west of Ukraine, of which more than 5.1 million people fled to neighboring Poland initially.[13] As of September 2023, 958,120 Ukrainian refugees continue to reside in Poland.[14] They are also not counted towards official or usually resident population.
The population of Poland decreased from more than 35 million in 1939 to less than 24 million in 1946. Of that, around 6 million were killed during the Holocaust, Porajmos, and German and Soviet occupations, while the remaining decline can be mostly attributed to altered borders and associated population expulsions of Germans and Ukrainians and resettlement of Poles. As a result, Poland became one of the most ethnically homogeneous areas in Europe.
Poland's population has been rising consistently in the 1945-1989 period, to 37.96 million in 1989. This growth has been fully fueled by positive natural change (more births than deaths), as net international migration was negative for Poland every year between 1966 and 1989, even despite the socialist government's restrictions on leaving the country for any reason. 578,405 people emigrated from Poland between 1966 and 1989,[16] with the main destination countries being Germany (388,137) and United States (50,453).
1990–present
Since 1990, Poland's population stagnated at 38.0-38.6 million, with the median age rising due to low birth rates. Official population statistics are a point of debate in Poland,[17] though, with many academics criticizing the Polish Central Statistical Office (GUS) for failing to adapt to successfully capture internal and international migration in particular.[18][6] Already the 2002 census revealed Poland had 402,000 residents less than expected,[19] and subsequent censuses reflected neither the mass emigration of Poles after Poland's admission to the European Union in 2004, nor the mass immigration to Poland since 2014.[20]
Population
Population of Poland 500–2023
Structure of the population
Population pyramid of Poland from 1950 to 2020
Population Estimates by Sex and Age Group (01.VII.2012) (Data refer to usually resident population.):[21]
Age group
Male
Female
Total
%
Total
18 651 441
19 882 348
38 533 789
100
0–4
1 058 874
1 005 069
2 063 943
5.36
5–9
945 643
897 723
1 843 366
4.78
10–14
974 509
925 506
1 900 015
4.93
15–19
1 158 367
1 108 267
2 266 634
5.88
20–24
1 394 761
1 341 393
2 736 154
7.10
25–29
1 623 072
1 575 546
3 198 618
8.30
30–34
1 602 736
1 558 622
3 161 358
8.20
35–39
1 470 751
1 432 822
2 903 573
7.54
40–44
1 231 083
1 209 751
2 440 834
6.33
45–49
1 196 548
1 192 952
2 389 500
6.20
50–54
1 369 258
1 414 996
2 784 254
7.23
55–59
1 404 141
1 522 140
2 926 281
7.59
60–64
1 163 935
1 350 684
2 514 619
6.53
65–69
675 573
861 584
1 537 157
3.99
70–74
529 739
776 722
1 306 461
3.39
75–79
424 407
720 249
1 144 656
2.97
80–84
278 428
566 126
844 554
2.19
85–89
115 213
311 388
426 601
1.11
90–94
28 565
91 223
119 788
0.31
95–99
4614
18 265
22 879
0.06
100+
224
1320
1544
<0.01
Age group
Male
Female
Total
%
0–14
2 979 026
2 828 298
5 807 324
15.07
15–64
13 615 652
13 707 173
27 322 825
70.91
65+
2 056 763
3 346 877
5 403 640
14.02
Population Estimates by Sex and Age Group (30.VI.2015) (Data refer to usually resident population.):[21]
Age group
Male
Female
Total
%
Total
18 607 417
19 847 159
38 454 576
100
0–4
982 639
928 662
1 911 301
4.97
5–9
1 047 830
996 205
2 044 035
5.32
10–14
924 671
877 780
1 802 451
4.69
15–19
1 028 884
979 585
2 008 469
5.22
20–24
1 257 703
1 209 498
2 467 201
6.42
25–29
1 464 438
1 417 040
2 881 478
7.49
30–34
1 647 147
1 602 930
3 250 077
8.45
35–39
1 561 396
1 522 202
3 083 598
8.02
40–44
1 354 899
1 329 476
2 684 375
6.98
45–49
1 166 358
1 160 878
2 327 236
6.05
50–54
1 211 294
1 238 398
2 449 692
6.37
55–59
1 386 303
1 489 816
2 876 119
7.48
60–64
1 256 035
1 443 985
2 700 020
7.02
65–69
917 893
1 147 725
2 065 618
5.37
70–74
501 311
716 224
1 217 535
3.17
75–79
426 059
715 629
1 141 688
2.97
80–84
287 908
573 415
861 323
2.24
85+
184 649
497 711
682 360
1.77
Age group
Male
Female
Total
%
0–14
2 955 140
2 802 647
5 757 787
14.97
15–64
13 334 457
13 393 808
26 728 265
69.51
65+
2 317 820
3 650 704
5 968 524
15.52
Population Estimates by Sex and Age Group (01.I.2021) (Provisional Estimates):[21]
Age group
Male
Female
Total
%
Total
18 307 488
19 532 513
37 840 001
100
0–4
978 526
926 796
1 905 322
5.04
5–9
979 042
925 737
1 904 779
5.03
10–14
1 049 403
997 556
2 046 959
5.41
15–19
911 890
866 575
1 778 465
4.70
20–24
1 000 405
957 358
1 957 763
5.17
25–29
1 221 584
1 177 960
2 399 544
6.34
30–34
1 420 368
1 367 645
2 788 013
7.37
35–39
1 594 620
1 543 389
3 138 009
8.29
40–44
1 515 234
1 482 301
2 997 535
7.92
45–49
1 328 852
1 316 404
2 645 256
6.99
50–54
1 116 244
1 130 951
2 247 195
5.94
55–59
1 115 823
1 176 530
2 292 353
6.06
60–64
1 246 589
1 407 097
2 653 686
7.01
65–69
1 114 311
1 374 477
2 488 788
6.58
70–74
806 003
1 102 945
1 908 948
5.04
75–79
388 818
621 315
1 010 133
2.67
80–84
291 685
571 202
862 887
2.28
85–89
159 279
376 980
536 259
1.42
90–94
56 278
164 806
221 084
0.58
95–99
10 821
38 970
49 791
0.13
100+
1 713
5 519
7 232
0.02
Age group
Male
Female
Total
%
0–14
3 006 971
2 850 089
5 857 060
15.48
15–64
12 471 609
12 426 210
24 897 819
65.80
65+
2 828 908
4 256 214
7 085 122
18.72
Population density and distribution
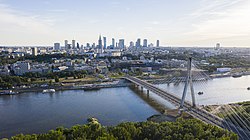
Population density in Poland in a 1x1 km square grid, 2021 censusWarsaw is the financial and commercial center of Poland
With an estimated usually resident population of 37 million, Poland is the 5th most-populous country in the European Union and 7th or 8th most-populous one in Europe (depending on how many people live in Ukraine, to which there are various estimates).
Depending on whether one uses the official population or usually resident population as a base, population density of Poland was 122 or 118.7 people per square kilometer (315.9 or 307.4 people per square mile) as of the 2021 census.
Population distribution is unequal. The south, particularly the area along the A4 highway between Gliwice and Rzeszów, is densely populated with over 250 people per square kilometer, while population density drops below 50 people per square kilometer in much of the north of the country. Silesian voivodeship is the densest, at over 350 people per square kilometer.
Urban areas
Poland is relatively rural for a country of its population and economic development. As of the 2021 census, 59.8% of total population lived in cities and town, a percentage well below European average. Poland has historically been a rural and agricultural country and while cities started rapidly growing in neighboring countries in the second half of the 19th century, many Polish cities were artificially limited in growth by the partitioners due to military reasons. After regaining independence in 1918, Polish authorities have started investment in urbanizing the country but it was quickly interrupted by World War II. Therefore, Poland has not started fully urbanizing until after the war.
Urbanization rate has also been declining, at an annual rate of -0.25% between 2015 and 2020 due to suburbanization. In Poland, many suburbs are officially rural areas even despite in reality might resemble a town or even a city neighborhood, such as the Poznań suburb of Koziegłowy.
New high-rises and cultural institutions on the former site of a coal mine near downtown Katowice are a testament to the city's successful economic transformation
In the Eurostat's urban-rural typology, Poland's urbanization rate is slightly higher, however still below the European average.[22] Eurostat estimates 61.2% of Poland's population to live in urban clusters (including 28.9% in dense urban centers), compared to the 70.4% average across the EU.
There is no one official delimitation of metropolitan areas in Poland, and various institutions use different definitions. However, both central institutions and academics are in agreement that the following are the major metropolitan areas of Poland:
Warsaw - the capital and largest city of Poland, with 1.9 million official residents in city proper and 2.7-3.1 million in the metropolitan area. Warsaw is the largest economy in Poland, with the Warsaw Stock Exchange, most major financial institutions, and CEE headquarters of international companies. Warsaw is also an important educational center, with the University of Warsaw, Warsaw School of Economics and Polish Academy of Sciences located there. Warsaw metropolitan area has been growing rapidly in recent decades, eclipsing the previously larger Katowice metropolitan area around 2015.
Kraków's old town is listed on the UNESCO World Heritage Site list and attracts millions of tourists every yearKatowice - the center of the large Katowice urban area, with 2.2-2.7 million in the metropolitan area. Katowice area developed initially as a hub of heavy industry and coal mining. Most of the industry has been closed since. Katowice and some other cities (Gliwice, Tychy) managed to successfully transform its economies becoming a major Polish hubs of information technology, healthcare, education, finance and manufacturing, however many other cities (Bytom, Sosnowiec) experience depopulation. Katowice metropolitan area is bordering Rybnik, Bielsko-Biała and Ostrava metropolitan areas from the south and southwest, which combined create a large Katowice-Ostrava metropolitan area with 4.5-5.2 million people.
Kraków - the historical capital of Poland, with 0.8 million residents in city proper and 1.2 million in the metropolitan area. Kraków is one of the main tourist destinations in Poland and a is often called a cultural capital of the country. In recent decades, Kraków emerged as a major international center of back office operations through the SSC/BPO industry. Kraków is also the second largest college city in Poland after Warsaw, with the Jagiellonian University dating back to the Middle Ages.
Łódź - a post-industrial city in the middle of Poland, with 0.7 million people in the city proper and 1-1.2 million in the urban area. Łódź has developed in the 19th century as a center for textile manufacturing, and has been a major manufacturing hub exporting mostly towards Russia and then Soviet Union. Following the market transformations in the early 1990s, most of the industry has collapsed and Łódź struggled with high unemployment rate. In recent years, the city has embraced its industrial past and exploits its location close to Warsaw.
Gdańsk - one of the three major cities of the Tricity area, Gdańsk has around 0.5 million people in the city proper and 1-1.2 million in the urban area. Gdańsk has been the largest cities in Poland for most of the Middle Ages, thanks to its seaside location that fostered trade with other cities and countries in the Baltic and North Seas. Being the largest urban area in the north of the country, Gdańsk benefits from internal migration from neighboring regions.
Poznań - with its 0.5 million residents in city proper and 0.8-1.1 million in the metropolitan area, Poznań emerged as one of the main hubs of trade and manufacturing in Poland. Poznań area is the most entrepreneurial part of Poland, with more than 1 in 10 residents running a business. Poznań is also the prime example of suburbanization in Poland, with the suburbs around as populous as the city proper.
Wrocław - in recent years emerged a major immigration center, with more than 100,000 immigrants residing in the city in addition to its official population of 0.7 million and 0.9-1.1 million in the metropolitan area. Similarly to Kraków, Wrocław is a major tourist destination thanks to its medieval old town, as well as a hub of back office operations particularly in the financial industry.
Szczecin - with a population of 0.4 million in the city proper and 0.7-0.9 million in the metropolitan area (partially stretching to Germany), Szczecin is the second-largest city in the country's north and a major port.
Poland is divided into 16 administrative divisions called voivodeship (województwa). These regions vary vastly in size, as the largest Masovian voivodeship is more than 5 times as populous and 3 times as big as the smallest Opole voivodeship.
Total fertility rate varies significantly by county in Poland. In 2021, Kashubia and Nowy Sącz regions had the highest fertility rate, along with metropolitan areas of Warsaw and Poznań. The lowest, sub-1 fertility was recorded in the Sudetes. Life expectancy at birth in Poland
Foreigners in Poland mostly settle in the largest metropolitan areas and in the western part of the country
Historically an emigrant country, Poland has seen an uptick in immigration only after 2014, when the growing economy started attracting foreign workforce, particularly from neighboring Ukraine whose economy has been affected by the 2014 war. Poland's official statistics regarding immigration are scattered and incomplete, and the complicated immigration system with many different routes to immigrate makes assessing true size of immigration to Poland challenging.[53]
Census data
Główny Urząd Statystyczny (GUS), the Polish central statistics office, published multiple separate counts of foreign nationals living in Poland for the 2021 census. GUS counted 445,176 foreign nationals towards Poland's usually resident population (1.2% share) and 111,814 foreign nationals towards Poland's official population (0.3% share).[54] It also counted 1,433,779 foreign nationals as temporarily living in Poland (of whom 309,309 lived in Poland for more than 12 months).[55] It is unclear what is the overlap of these populations.
Largest groups of foreign residents as of 31 December 2025 [56]
Most foreigners from outside of the European Union immigrate to Poland via various kinds of work schemes. There are two primary types: a work permit (zezwolenie na pracę)[58] and a "declaration of entrusting work to a foreigner" (oświadczenie o powierzeniu wykonywania pracy cudzoziemcowi).
Work permits can be issued to any foreigner from outside of the European Union who is not a refugee and does not already have a residence permit in Poland. Work permits require a labor market test and can be issued for up to 3 years. In 2022, 61.1% of work permits were issued for at least 12 months (including 49.2% issued for 24 months and more) while 38.5% were issued for 6–12 months. Less than 0.4% were issued for less than 6 months.
Work permits issued each year by country of citizenship[60]
In addition to work permits, there is a secondary, easier work migration scheme called declarations of entrusting work to a foreigner. Compared to the work permit system, employers seeking to entrust work to a foreigner do not need to subject the job to a labor market test. However, the work visa is only valid for up to 24 months instead of 36 months. Prior to 2022, the time limits were even stricter, with a 6-month maximum stay that had to be accompanied by a 6-month period outside of Poland until a new work visa could be obtained.[61][62] This system is only open to citizens of 5 post-Soviet countries,[63][64] though business leaders have called for an extension to other post-Soviet republics. Russian citizens are excluded from the program since October 2022,[65] following the invasion of Ukraine. Between 2007 and 2017, this scheme was known as a declaration of intention to entrust work to a foreigner, though it led to numerous abuses, since after submitting the statement, employers were not obliged to report whether the foreigner had come, and whether they had taken the job. Migrants would sometimes take up different work than previously indicated, use the permit to move to Western Europe, or not arrive at all. On 1 January 2018, it was replaced by the current scheme. Since then, employers are obliged to report the fact that the migrant has taken up employment. The change limits the comparability of the data from the previous periods.[66]
Registered declarations of entrusting work to a foreigner[67]
Since January 2018, employers may hire foreigners on a seasonal work permit, used specifically for agricultural and tourism-related work.[68] In 2020, 60.8% of hired foreigners were women, 42% were under 35 years old, and most worked in Poland from 31 to 90 days.[69] The vast majority of migrants come from Ukraine, as well as Belarus, Moldova, and Georgia, since the law doesn't require the employer to look for potential Polish workers before hiring a foreigner from said countries.
Polish social insurance provider, Zakład Ubezpieczeń Społecznych (ZUS), reported 1,094,148 foreigners paying towards pension insurance in Poland at the end of June 2023, an 8.1% increase since the year prior and more than double compared to 5 years ago. Foreigners were 6.74% of all insured in Poland, an increase from basically 0 just a few years earlier. Ukrainians and Belarusians were the largest groups of foreigners, at 68.4% and 11.1%, respectively. Other nationalities with more than 10,000 people insured in the Polish insurance system include: Georgians (27,434), Indians (18,620), Moldovans (14,654), and Russians (12,709).[70]
Poland has been at the forefront of the Ukrainian refugee crisis from the very beginning, as the country shares a long border with Ukraine and many Ukrainians have family members working or studying in Poland. As the refugee crisis became apparent, Polish authorities waived certain entry restrictions for people fleeing Ukraine, such as requirements for passports[71] and, along with millions of private citizens,[72] organized food and shelter for the arriving refugees. Poland's response to the Ukrainian refugee crisis has won the country international praise.[73][74]
As of September 2023, 958,120 refugees remain in Poland, of which 408,884 are under 18. More than 1 in 10 refugees lives in Warsaw (103,476), followed by Wrocław (45,942), Kraków (31,795) and Poznań (24,312).[75] Refugees are not counted towards the official population number by GUS as they are in a temporary residence status and temporary residents are not reported.[76]
Poland was a diverse country before World War II, with only around 2/3 of the population being ethnically Polish. Due to German and Soviet war-time resettlements and genocides, and after-war population transfers, post-war Poland was one of the most ethnically homogenous countries in Europe and has stayed that way in the 21st century.
Historically, Poland has been a religiously diverse country. However, after the war-related population transfers and the Holocaust, Poland became predominantly Catholic, with small Orthodox, Protestant and Jewish communities.
Religious makeup of Poland
Roman Catholic (71.3%)
Orthodox (0.40%)
Jehovah's Witnesses (0.29%)
Other denominations (0.58%)
No denomination (6.87%)
Refused to state (20.5%)
Unknown (0.04%)
The most recent census has shown a Catholic majority again, however with a significant drop in self-declared Catholics compared to a census 10 years earlier.[80]Roman Catholics constitute 71.3% of the population, down from 87.58% in 2011.[81]
↑In fertility rates, 2.1 and above is a stable population and has been marked blue, 2 and below leads to an aging population and the result is that the population decreases.
↑Note: Crude migration change (per 1000) is a trend analysis, an extrapolation based average population change (current year minus previous) minus natural change of the current year (see table vital statistics). As average population is an estimate of the population in the middle of the year and not end of the year.
This page is based on this Wikipedia article Text is available under the CC BY-SA 4.0 license; additional terms may apply. Images, videos and audio are available under their respective licenses.