Demographics of Denmark | |
---|---|
Population | 5,989,985 (2024 1 Oct. est.) |
Growth rate | 1.0085% (2022 est.) |
Birth rate | 9.85 births/1,000 population |
Death rate | 10.02 deaths/1,000 population |
Life expectancy | 81.66 years |
• male | 79.74 years |
• female | 83.71 years |
Fertility rate | 1.55 children born/woman (2022) [1] |
Infant mortality rate | 3.04 deaths/1,000 live births |
Net migration rate | 2.73 migrant(s)/1,000 population (2022 est.) |
Age structure | |
0–14 years | 16.42% |
65 and over | 19.91% |
Sex ratio | |
Total | 0.99 male(s)/female (2022 est.) |
At birth | 1.07 male(s)/female |
65 and over | 0.7 male(s)/female |
Nationality | |
Nationality | Dane |
Major ethnic | Danish |
Language | |
Spoken | Danish |
Demographic features of the population of Denmark proper, part of the Danish Realm, include ethnicity, education level, health of the populace, economic status, religious affiliations, and other aspects.
Since 1980, the number of people of Danish descent, defined as having at least one parent who was born in Denmark and has Danish citizenship, has remained constant at around 5 million in Denmark, and nearly all the population growth from 5.1 up to the 2018 total of 5.8 million was due to immigration. [2]
Demographic statistics according to the World Population Review in 2019. [3] Population numbers until 2100 will fall slightly. [4]
Year | Pop. | ±% p.a. |
---|---|---|
1870 | 1,784,741 | — |
1880 | 1,969,039 | +0.99% |
1890 | 2,172,380 | +0.99% |
1901 | 2,449,540 | +1.10% |
1911 | 2,747,076 | +1.15% |
1921 | 3,267,831 | +1.75% |
1930 | 3,550,656 | +0.93% |
1940 | 3,844,312 | +0.80% |
1950 | 4,281,275 | +1.08% |
1960 | 4,585,256 | +0.69% |
1970 | 4,937,579 | +0.74% |
1980 | 5,122,065 | +0.37% |
1990 | 5,135,409 | +0.03% |
2000 | 5,330,020 | +0.37% |
2010 | 5,534,738 | +0.38% |
2020 | 5,822,863 | +0.51% |
Source: Statistics Denmark 2020 estimate [5] |
Graphs are unavailable due to technical issues. There is more info on Phabricator and on MediaWiki.org. |
Year [7] | Population |
---|---|
1769 | 797,584 |
1787 | 841,806 |
1801 | 929,001 |
1834 | 1,230,964 |
1840 | 1,289,075 |
1845 | 1,356,877 |
1850 | 1,414,648 |
1855 | 1,507,222 |
1860 | 1,608,362 |
1870 | 1,784,741 |
1880 | 1,969,039 |
1890 | 2,172,380 |
1901 | 2,449,540 |
1906 | 2,588,919 |
1911 | 2,757,076 |
1916 | 2,921,362 |
1921 | 3,267,831 |
1925 | 3,434,555 |
1930 | 3,550,656 |
1935 | 3,706,349 |
1940 | 3,844,312 |
1945 | 4,045,232 |
1950 | 4,281,275 |
1955 | 4,448,401 |
1960 | 4,585,256 |
1965 | 4,767,597 |
1970 | 4,937,579 |
1971 | 4,950,598 |
1972 | 4,975,653 |
1973 | 5,007,538 |
1974 | 5,036,184 |
1975 | 5,054,410 |
The natural growth of the population (births minus deaths) was negative in 2022, that is, minus 1005 people. The previous last year there was a negative natural increase in the population was in 1988. During 2022, 58,430 children were born, 5,043 fewer than in 2021. In 2022, 59,435 people died, there were 2,283, or 4.0% more than in 2021. The total population in the age group 80 and over grew by 12,844 people, or 4.4%., from 2022 to 2023. [8]
During 2022, the Danish population grew by 59,234 people, so the population on January 1, 2023, consisted of 5,932,654 people. It was a population increase of 1.0 percent, which is higher than in 2021, when the population increase was 0.6 percent. [8]
In 2022, Denmark had a total fertility rate (TFR) of 1.55 children per woman in 2022. [9] It is the first time in history that immigrant women from non-Western countries now have fewer children on average than women of Danish roots in Denmark. On average, immigrant women have 1.76 children, the descendants have an average of 1.75 children, while women of Danish roots have 1.78 children. [10] This is because Ukrainians, who are categorized as non-Western, have come to Denmark in large numbers. In the same year, immigrant women from Syria had the highest TFR, they gave birth to an average of 3.7 children. They are followed by women from Somalia and Pakistan, 2020 figures show. [10]
In 2021 the number of childless women aged 50 was the highest in seven years; 12.3 percent of women aged 50 have never had a child, while 19.5 percent of 50-year-old men do not have children. [11]
The total fertility rate is the number of children born per woman. It is based on fairly good data for the entire period. Sources: Our World In Data and Gapminder Foundation. [12]
Year | 1850 | 1851 | 1852 | 1853 | 1854 | 1855 | 1856 | 1857 | 1858 | 1859 | 1860 [12] |
---|---|---|---|---|---|---|---|---|---|---|---|
Total fertility rate in Denmark | 4.24 | 4.06 | 4.48 | 4.27 | 4.41 | 4.31 | 4.37 | 4.44 | 4.48 | 4.53 | 4.4 |
Year | 1861 | 1862 | 1863 | 1864 | 1865 | 1866 | 1867 | 1868 | 1869 | 1870 [12] |
---|---|---|---|---|---|---|---|---|---|---|
Total fertility rate in Denmark | 4.27 | 4.17 | 4.17 | 4.06 | 4.21 | 4.32 | 4.09 | 4.18 | 3.96 | 4.1 |
Year | 1871 | 1872 | 1873 | 1874 | 1875 | 1876 | 1877 | 1878 | 1879 | 1880 [12] |
---|---|---|---|---|---|---|---|---|---|---|
Total fertility rate in Denmark | 4.06 | 4.09 | 4.16 | 4.17 | 4.31 | 4.4 | 4.36 | 4.27 | 4.3 | 4.28 |
Year | 1881 | 1882 | 1883 | 1884 | 1885 | 1886 | 1887 | 1888 | 1889 | 1890 [12] |
---|---|---|---|---|---|---|---|---|---|---|
Total fertility rate in Denmark | 4.34 | 4.36 | 4.29 | 4.5 | 4.39 | 4.37 | 4.28 | 4.25 | 4.21 | 4.11 |
Year | 1891 | 1892 | 1893 | 1894 | 1895 | 1896 | 1897 | 1898 | 1899 [12] |
---|---|---|---|---|---|---|---|---|---|
Total fertility rate in Denmark | 4.18 | 4 | 4.16 | 4.1 | 4.09 | 4.11 | 4.02 | 4.08 | 4.01 |
Total fertility rate
1.78 children born/woman (2018 est.) Country comparison to the world: 152nd
In 2021 the average age of the mother at her first birth in Denmark was of 29.8 years, and the father is of 31.5 years. [11]
Sources: Our World In Data and the United Nations.
1775–1950
Years | 1775 | 1835 | 1836 | 1837 | 1838 | 1839 | 1840 | 1841 | 1842 | 1843 | 1844 | 1845 | 1846 | 1847 | 1848 | 1849 | 1850 [13] |
---|---|---|---|---|---|---|---|---|---|---|---|---|---|---|---|---|---|
Life expectancy in Denmark | 33.0 | 38.4 | 40.0 | 41.5 | 43.1 | 41.9 | 41.1 | 42.6 | 42.5 | 43.9 | 44.0 | 43.4 | 40.4 | 40.4 | 40.8 | 39.5 | 43.5 |
Years | 1851 | 1852 | 1853 | 1854 | 1855 | 1856 | 1857 | 1858 | 1859 | 1860 [13] |
---|---|---|---|---|---|---|---|---|---|---|
Life expectancy in Denmark | 44.5 | 43.0 | 38.5 | 44.7 | 46.1 | 46.7 | 42.5 | 40.0 | 44.4 | 45.1 |
Years | 1861 | 1862 | 1863 | 1864 | 1865 | 1866 | 1867 | 1868 | 1869 | 1870 [13] |
---|---|---|---|---|---|---|---|---|---|---|
Life expectancy in Denmark | 47.6 | 47.6 | 47.2 | 40.2 | 39.8 | 42.9 | 44.9 | 45.6 | 46.1 | 46.0 |
Years | 1871 | 1872 | 1873 | 1874 | 1875 | 1876 | 1877 | 1878 | 1879 | 1880 [13] |
---|---|---|---|---|---|---|---|---|---|---|
Life expectancy in Denmark | 46.1 | 47.2 | 47.5 | 46.0 | 44.4 | 45.8 | 47.3 | 47.5 | 46.2 | 44.8 |
Years | 1881 | 1882 | 1883 | 1884 | 1885 | 1886 | 1887 | 1888 | 1889 | 1890 [13] |
---|---|---|---|---|---|---|---|---|---|---|
Life expectancy in Denmark | 48.3 | 46.7 | 48.5 | 48.5 | 49.6 | 49.0 | 48.7 | 46.7 | 47.8 | 47.2 |
Years | 1891 | 1892 | 1893 | 1894 | 1895 | 1896 | 1897 | 1898 | 1899 | 1900 [13] |
---|---|---|---|---|---|---|---|---|---|---|
Life expectancy in Denmark | 46.8 | 47.4 | 47.1 | 49.4 | 50.8 | 52.9 | 51.8 | 53.1 | 50.6 | 51.9 |
Years | 1901 | 1902 | 1903 | 1904 | 1905 | 1906 | 1907 | 1908 | 1909 | 1910 [13] |
---|---|---|---|---|---|---|---|---|---|---|
Life expectancy in Denmark | 52.6 | 54.7 | 54.8 | 55.7 | 54.3 | 56.5 | 56.1 | 54.9 | 57.4 | 58.0 |
Years | 1911 | 1912 | 1913 | 1914 | 1915 | 1916 | 1917 | 1918 | 1919 | 1920 [13] |
---|---|---|---|---|---|---|---|---|---|---|
Life expectancy in Denmark | 57.0 | 58.0 | 58.9 | 58.5 | 58.4 | 56.9 | 57.3 | 56.3 | 57.0 | 57.6 |
Years | 1921 | 1922 | 1923 | 1924 | 1925 | 1926 | 1927 | 1928 | 1929 | 1930 [13] |
---|---|---|---|---|---|---|---|---|---|---|
Life expectancy in Denmark | 61.7 | 60.6 | 61.2 | 61.1 | 61.9 | 61.7 | 61.2 | 61.9 | 61.9 | 62.3 |
Years | 1931 | 1932 | 1933 | 1934 | 1935 | 1936 | 1937 | 1938 | 1939 | 1940 [13] |
---|---|---|---|---|---|---|---|---|---|---|
Life expectancy in Denmark | 61.8 | 62.7 | 63.6 | 64.1 | 62.9 | 63.5 | 64.0 | 65.0 | 65.8 | 66.3 |
Years | 1941 | 1942 | 1943 | 1944 | 1945 | 1946 | 1947 | 1948 | 1949 | 1950 [13] |
---|---|---|---|---|---|---|---|---|---|---|
Life expectancy in Denmark | 66.0 | 67.1 | 67.4 | 66.4 | 66.1 | 67.2 | 68.5 | 70.1 | 70.1 | 70.3 |
1950–2015
Period [14] | Life expectancy in Years | Period | Life expectancy in Years |
---|---|---|---|
1950–1955 | 71.1 | 1985–1990 | 74.8 |
1955–1960 | 72.1 | 1990–1995 | 75.2 |
1960–1965 | 72.4 | 1995–2000 | 76.1 |
1965–1970 | 72.9 | 2000–2005 | 77.3 |
1970–1975 | 73.6 | 2005–2010 | 78.6 |
1975–1980 | 74.2 | 2010–2015 | 80.2 |
1980–1985 | 74.4 |
Non-indigenous ethnic minorities include:
Ethnic minorities in Denmark include a handful of groups:
A person has Danish origin if he or she has at least one parent who is both a Danish citizen and born in Denmark. Neither immigrants nor descendants have one parent who is both a Danish citizen and born in Denmark. The difference between immigrants and descendants is that immigrants were born abroad, while descendants were born in Denmark.
For asylum seekers and other persons applying for a residence permit in Denmark, there is no unambiguous connection between the time of a granted residence permit and immigration for the person who has been granted the residence permit. The number of residence permits granted in a quarter cannot be interpreted as the quarter's immigration. Citizens of Finland, Iceland, Norway and Sweden do not need a residence permit to live, work or study in Denmark.
In the modern minorities, Statistics Denmark counts first-generation immigrants, second-generation (Descendants in Danish statistics classification) and third-generation (Children of descendants in Danish classification). Children of descendants can be either of "Danish origin" (if both of their parents were born in Denmark with Danish citizenship) and of "foreign origin" (if one of their parents is a second-generation immigrant and another first-generation). Therefore, this table included all people of the respective background, people who are classified as of "foreign background" and third-generation immigrants, who classified as of "Danish origin". [20] Statistics Denmark denotes an immigrant's group based on their country of birth, it does this usually off of the immigrant or descendents parents, if only one such parent is known, then the group is determined by that or if no parents are known then it is assumed if the person is an immigrant that their country of origin is their country of birth. [20]
Statistics Denmark also has specific classification bands which it uses to separate different immigrant groups. As an example, for 'Western' immigrants and 'Non-western', the classification band is as follows:
According to 2021 figures from Statistics Denmark, 86% [21] [22] of Denmark's population of over 5,840,045 was of Danish descent. [23] [21] The remaining 14% were of a foreign background, defined as immigrants or descendants of recent immigrants. With the same definition, the most common countries of origin were Turkey, Poland, Germany, Iraq, Romania, Syria, Somalia, Iran, Afghanistan, and Yugoslavia and its successor states.[ citation needed ] More than 817,438 individuals (14%) [21] [22] are migrants and their descendants (199,668 second generation migrants born in Denmark [22] ).
Of these 817,438 [21] immigrants and their descendants:
There were 121,183 immigrants in 2022, of these 31,381 were Ukrainian citizens, people with Ukrainian citizenship accounted for 26 percent of all immigration. [8] The total population of Denmark increased in 2022 by 59,234 people, and the net immigration of Ukrainian people amounted to 45 percent of this population growth. [8]
Rank | Country of origin [24] | Population (2008) | Population (2021) [25] | Population (2023) | Population (2024) |
---|---|---|---|---|---|
1. | Turkey | 59,960 | 75,072 | 77,845 | 79,373 |
2. | Poland | 21,118 | 49,369 | 55,122 | 57,070 |
3. | Romania | 3,681 | 34,997 | 44,221 | 46,036 |
4. | Syria | 3,367 | 44,326 | 45,000 | 45,641 |
5. | Ukraine | 5,105 | 15,595 | 42,482 | 44,825 |
6. | Germany | 28,412 | 35,141 | 39,528 | 41,516 |
7. | Iraq | 28,417 | 34,217 | 35,101 | 35,476 |
8. | Pakistan | 21,217 | 31,175 | 32,246 | 33,050 |
9. | Lebanon | 23,343 | 30,435 | 31,700 | 32,269 |
10. | Iran | 14,773 | 22,408 | 24,364 | 26,276 |
11. | Bosnia and Herzegovina | 21,861 | 23,449 | 23,625 | 23,659 |
12. | Afghanistan | 11,880 | 19,957 | 21,380 | 21,784 |
13. | Somalia | 16,561 | 21,338 | 21,486 | 21,653 |
14. | India | 5,666 | 15,595 | 19,296 | 21,268 |
15. | United Kingdom | 12,593 | 17,651 | 18,190 | 18,442 |
16. | Sweden | 14,789 | 17,095 | 17,726 | 17,999 |
17. | Norway | 15,747 | 17,481 | 17,691 | 17,735 |
18. | Vietnam | 13,459 | 16,307 | 16,906 | 17,448 |
19. | China | 8,574 | 14,841 | 15,836 | 16,549 |
20. | Lithuania | 3,646 | 15,231 | 16,439 | 16,357 |
21. | former Yugoslavia [fn 1] | 18,151 | 15,903 | 15,356 | 15,016 |
22. | Thailand | 8,280 | 13,166 | 13,693 | 14,029 |
23. | Morocco | 9,808 | 13,170 | 13,708 | 13,937 |
24. | Bulgaria | 1,194 | – | 13,503 | 13,840 |
25. | Philippines | 7,199 | – | 12,760 | 13,098 |
26. | Sri Lanka | 10,494 | – | 12,692 | 12,996 |
27. | Italy | 3,994 | – | 11,684 | 12,313 |
28. | USA | 7,151 | – | 10,786 | 11,293 |
29. | Russia | 4,389 | – | 9,517 | 9,946 |
30. | Iceland | 8,421 | – | 9,513 | 9,765 |
Population groups | Year | |||||||||
---|---|---|---|---|---|---|---|---|---|---|
1981 [26] | 1991 [26] | 2001 [26] | 2011 [26] | 2021 [26] | ||||||
Number | % | Number | % | Number | % | Number | % | Number | % | |
Danish descent | 4,968,337 | 96.96% | 4,920,267 | 95.6% | 4,953,265 | 92.59% | 4,998,111 | 89.88% | 5,022,607 | 86% |
Immigrants | 136,229 | 2.65% | 189,649 | 3.68% | 308,674 | 5.77% | 428,904 | 7.71% | 617,770 | 10.57% |
EU-27 | 59,808 | 1.16% | 61,279 | 1.19% | 74,565 | 1.39% | 124,092 | 2.23% | 205,731 | 3.52% |
Europe outside EU-27 | 45,148 | 0.88% | 55,797 | 1.08% | 98,042 | 1.83% | 116,300 | 2.09% | 131,189 | 2.24% |
Africa | 5,033 | – | 9,710 | 0.18% | 28,190 | 0.52% | 33,135 | 0.59% | 46,376 | 0.79% |
North America | 6,312 | – | 6,525 | – | 7,008 | – | 9,068 | 0.16% | 10,890 | 0.18% |
South and Central America | 2,987 | – | 4,263 | – | 6,248 | – | 9,826 | 0.17% | 17,430 | 0.29% |
Asia | 16,200 | 0.31% | 50,556 | 0.98% | 91,731 | 1.71% | 133,261 | 2.39% | 202,625 | 3.46% |
Oceania | 571 | – | 811 | – | 1,314 | – | 2,277 | – | 2,905 | – |
Stateless | 9 | – | 373 | – | 367 | – | 480 | – | 352 | – |
Unknown | 170 | – | 335 | – | 1,209 | – | 465 | – | 272 | – |
Descendants | 19,423 | 0.37% | 36,553 | 0.71% | 87,273 | 1.63% | 133,613 | 2.40% | 199,668 | 3.41% |
EU-27 | 6,763 | 0.13% | 6,949 | 0.13% | 9,679 | 0.18% | 13,097 | 0.23% | 28,273 | 0.48% |
Europe outside EU-27 | 6,831 | 0.13% | 15,302 | 0.29% | 32,237 | 0.60% | 46,291 | 0.83% | 59,309 | 1.01% |
Africa | 895 | – | 2,414 | – | 10,258 | 0.19% | 16,608 | 0.29% | 25,188 | 0.43% |
North America | 985 | – | 926 | – | 1,004 | – | 929 | – | 1,029 | – |
South and Central America | 275 | – | 363 | – | 605 | – | 902 | – | 1,571 | – |
Asia | 3,535 | – | 10,420 | 0.20% | 33,045 | 0.61% | 55,260 | 0.99% | 83,815 | 1.43% |
Oceania | 93 | – | 88 | – | 129 | – | 149 | – | 196 | – |
Stateless | 29 | – | 56 | – | 109 | – | 237 | – | 154 | – |
Unknown | 17 | – | 35 | – | 207 | – | 140 | – | 133 | – |
Total | 5,123,989 | 100% | 5,146,469 | 100% | 5,349,212 | 100% | 5,560,628 | 100% | 5,840,045 | 100% |
Data according to Statistics Denmark, which collects the official statistics for Denmark. [27]
Average population (January 1) | Live births | Deaths | Nat. change | Crude birth rate (per 1000) | Crude death rate (per 1000) | Nat. change (per 1000) | Crude migration change (per 1000) | Total fertility rate [fn 2] | |
---|---|---|---|---|---|---|---|---|---|
1900 | 2,432,000 | 72,129 | 40,891 | 31,238 | 29.7 | 16.8 | 12.8 | -6.6 | 4.16 |
1901 | 2,447,000 [28] | 73,219 | 38,786 | 34,425 | 29.7 | 15.7 | 14.0 | -1.7 | 4.14 |
1902 | 2,477,000 | 72,839 | 36,424 | 36,391 | 29.2 | 14.6 | 14.6 | -2.9 | 4.05 |
1903 | 2,506,000 | 72,351 | 36,956 | 35,403 | 28.7 | 14.6 | 14.0 | -3.6 | 3.96 |
1904 | 2,532,000 | 73,692 | 35,903 | 37,788 | 28.9 | 14.1 | 14.8 | -3.7 | 3.97 |
1905 | 2,560,000 | 73,082 | 38,598 | 34,484 | 28.4 | 15.0 | 13.4 | -2.1 | 3.87 |
1906 | 2,589,000 | 74,217 | 35,231 | 38,986 | 28.5 | 13.5 | 15 | -2.6 | 3.87 |
1907 | 2,621,000 | 74,324 | 37,275 | 37,049 | 28.2 | 14.1 | 14.1 | -2.3 | 3.81 |
1908 | 2,652,000 | 76,233 | 39,072 | 37,161 | 28.6 | 14.6 | 13.9 | -0.7 | 3.83 |
1909 | 2,687,000 | 76,301 | 35,837 | 40,464 | 28.2 | 13.3 | 15.0 | -2.0 | 3.78 |
1910 | 2,722,000 | 75,299 | 35,184 | 40,013 | 27.5 | 12.9 | 14.6 | -1.7 | 3.67 |
1911 | 2,757,000 | 73,933 | 37,236 | 36,697 | 26.7 | 13.4 | 13.2 | -2.0 | 3.60 |
1912 | 2,788,000 | 74,659 | 36,486 | 38,173 | 26.6 | 13.0 | 13.6 | -2.1 | 3.58 |
1913 | 2,820,000 | 72,475 | 35,364 | 37,111 | 25.6 | 12.5 | 13.1 | -2.1 | 3.43 |
1914 | 2,851,000 | 73,294 | 35,921 | 37,373 | 25.6 | 12.5 | 13.0 | -0.7 | 3.42 |
1915 | 2,886,000 | 70,192 | 37,174 | 33,018 | 24.2 | 12.8 | 11.4 | 0.7 | 3.23 |
1916 | 2,921,000 | 71,559 | 39,265 | 32,294 | 24.4 | 13.4 | 11.0 | 1.7 | 3.23 |
1917 | 2,958,000 | 70,306 | 39,224 | 31,082 | 23.7 | 13.2 | 10.5 | 0.7 | 3.11 |
1918 | 2,991,000 | 72,505 | 39,038 | 33,467 | 24.1 | 13.0 | 11.1 | 0.9 | 3.16 |
1919 | 3,027,000 | 68,722 | 39,590 | 29,132 | 22.6 | 13.0 | 9.6 | 1.6 | 2.96 |
1920 | 3,061,000 | 78,230 | 39,841 | 38,389 | 25.4 | 12.9 | 12.5 | 54.1 | 3.29 |
1921 | 3,265,000 | 78,815 | 36,215 | 42,600 | 24.0 | 11.0 | 13.0 | -0.4 | 3.11 |
1922 | 3,306,000 | 73,899 | 39,452 | 34,435 | 22.3 | 11.9 | 10.4 | -0.1 | 2.87 |
1923 | 3,340,000 | 74,827 | 37,903 | 36,924 | 22.3 | 11.3 | 11.0 | -1.1 | 2.85 |
1924 | 3,373,000 | 73,836 | 38,091 | 35,778 | 21.8 | 11.2 | 10.6 | -0.8 | 2.78 |
1925 | 3,406,000 | 71,897 | 37,083 | 34,814 | 21.0 | 10.8 | 10.2 | -0.5 | 2.66 |
1926 | 3,439,000 | 70,734 | 38,093 | 32,641 | 20.5 | 11.0 | 9.5 | -1.4 | 2.58 |
1927 | 3,467,000 | 68,024 | 40,190 | 27,834 | 19.6 | 11.6 | 8.0 | -2.2 | 2.44 |
1928 | 3,487,000 | 68,516 | 38,484 | 30,032 | 19.6 | 11.0 | 8.6 | -1.7 | 2.43 |
1929 | 3,511,000 | 65,297 | 39,486 | 25,913 | 18.6 | 11.2 | 7.4 | -1.7 | 2.30 |
1930 | 3,531,000 | 66,303 | 38,174 | 28,129 | 18.7 | 10.8 | 7.9 | -0.5 | 2.29 |
1931 | 3,557,000 | 64,266 | 40,578 | 23,688 | 18.0 | 11.4 | 6.6 | 2.7 | 2.20 |
1932 | 3,590,000 | 64,650 | 39,701 | 24,949 | 17.9 | 11.0 | 6.9 | 1.5 | 2.17 |
1933 | 3,620,000 | 62,780 | 38,287 | 24,493 | 17.3 | 10.5 | 6.7 | 1.9 | 2.10 |
1934 | 3,651,000 | 65,116 | 38,050 | 27,066 | 17.8 | 10.4 | 7.4 | 1.4 | 2.15 |
1935 | 3,683,000 | 65,223 | 40,816 | 24,407 | 17.7 | 11.0 | 6.6 | 1.0 | 2.12 |
1936 | 3,711,000 | 66,418 | 40,919 | 25,499 | 17.8 | 11.0 | 6.9 | 0.4 | 2.14 |
1937 | 3,738,000 | 67,440 | 40,442 | 26,998 | 18.0 | 10.8 | 7.2 | 0 | 2.16 |
1938 | 3,765,000 | 68,463 | 39,058 | 29,407 | 18.1 | 10.3 | 7.8 | -0.1 | 2.18 |
1939 | 3,794,000 | 67,914 | 38,535 | 29,379 | 17.8 | 10.1 | 7.7 | 0.7 | 2.16 |
1940 | 3,826,000 | 70,121 | 39,730 | 30,391 | 18.3 | 10.4 | 7.9 | -1.9 | 2.22 |
1941 | 3,849,000 | 71,306 | 39,756 | 31,550 | 18.5 | 10.3 | 8.2 | 0.4 | 2.24 |
1942 | 3,882,000 | 79,545 | 37,527 | 42,018 | 20.4 | 9.6 | 10.8 | 0.5 | 2.50 |
1943 | 3,926,000 | 84,319 | 37,982 | 46,337 | 21.4 | 9.6 | 11.7 | 0.3 | 2.65 |
1944 | 3,973,000 | 90,641 | 41,087 | 49,554 | 22.7 | 10.3 | 12.4 | 0.2 | 2.84 |
1945 | 4,023,000 | 95,062 | 42,298 | 52,764 | 23.5 | 10.5 | 13.0 | -0.1 | 2.98 |
1946 | 4,075,000 | 96,111 | 42,013 | 54,098 | 23.4 | 10.2 | 13.2 | -1.2 | 3.02 |
1947 | 4,124,000 | 91,714 | 40,043 | 51,671 | 22.1 | 9.7 | 12.5 | -1.8 | 2.90 |
1948 | 4,168,000 | 84,938 | 35,981 | 48,957 | 20.3 | 8.6 | 11.7 | -1.4 | 2.71 |
1949 | 4,211,000 | 79,919 | 37,793 | 42,126 | 18.9 | 8.9 | 10.0 | -0.3 | 2.58 |
1950 | 4,252,000 | 79,558 | 39,300 | 40,258 | 18.6 | 9.2 | 9.4 | -1.6 | 2.57 |
1951 | 4,285,000 | 76,559 | 37,960 | 38,599 | 17.8 | 8.8 | 9.0 | -2.0 | 2.50 |
1952 | 4,315,000 | 76,943 | 39,173 | 37,770 | 17.8 | 9.0 | 8.7 | -0.8 | 2.53 |
1953 | 4,349,000 | 78,261 | 39,350 | 38,911 | 17.9 | 9.0 | 8.9 | 0.3 | 2.60 |
1954 | 4,389,000 | 76,365 | 39,885 | 36,480 | 17.3 | 9.1 | 8.3 | -0.3 | 2.55 |
1955 | 4,424,000 | 76,845 | 38,789 | 38,056 | 17.3 | 8.7 | 8.6 | -1.8 | 2.58 |
1956 | 4,454,000 | 76,725 | 39,588 | 37,137 | 17.2 | 8.9 | 8.3 | -2.7 | 2.61 |
1957 | 4,479,000 | 75,264 | 41,730 | 33,534 | 16.8 | 9.3 | 7.5 | -2.6 | 2.57 |
1958 | 4,501,000 | 74,681 | 41,560 | 33,121 | 16.5 | 9.2 | 7.3 | -0.4 | 2.55 |
1959 | 4,532,000 | 73,928 | 42,159 | 31,769 | 16.3 | 9.3 | 7.0 | 0.5 | 2.52 |
1960 | 4,566,000 | 76,077 | 43,681 | 32,396 | 16.6 | 9.5 | 7.1 | -1.0 | 2.57 |
1961 | 4,594,000 | 76,439 | 43,310 | 33,129 | 16.6 | 9.4 | 7.2 | 0.6 | 2.55 |
1962 | 4,630,000 | 77,808 | 45,334 | 32,474 | 16.7 | 9.8 | 7.0 | 0.8 | 2.58 |
1963 | 4,666,000 | 82,413 | 45,773 | 36,640 | 17.6 | 9.8 | 7.8 | 0.1 | 2.64 |
1964 | 4,703,000 | 83,356 | 46,811 | 36,545 | 17.7 | 9.9 | 7.7 | 0.4 | 2.60 |
1965 | 4,741,000 | 85,796 | 47,884 | 37,912 | 18.0 | 10.1 | 8.0 | -0.4 | 2.61 |
1966 | 4,777,000 | 88,332 | 49,344 | 38,988 | 18.4 | 10.3 | 8.1 | 0.5 | 2.62 |
1967 | 4,818,000 | 81,410 | 47,836 | 33,574 | 16.8 | 9.9 | 6.9 | 0.4 | 2.35 |
1968 | 4,853,000 | 74,543 | 47,290 | 27,253 | 15.3 | 9.7 | 5.6 | -0.7 | 2.12 |
1969 | 4,877,000 | 71,298 | 47,943 | 23,355 | 14.6 | 9.8 | 4.8 | 1.4 | 2.00 |
1970 | 4,907,000 | 70,802 | 48,233 | 22,569 | 14.3 | 9.7 | 4.6 | 4.4 | 1.95 |
1971 | 4,951,000 | 75,359 | 48,858 | 26,501 | 15.2 | 9.8 | 5.3 | -0.3 | 2.04 |
1972 | 4,976,000 | 75,505 | 50,445 | 25,060 | 15.1 | 10.1 | 5.0 | 1.4 | 2.03 |
1973 | 5,008,000 | 71,895 | 50,526 | 21,369 | 14.3 | 10.1 | 4.3 | 1.3 | 1.9170 |
1974 | 5,036,000 | 71,327 | 51,637 | 19,690 | 14.1 | 10.2 | 3.9 | -0.3 | 1.8968 |
1975 | 5,054,000 | 72,071 | 50,895 | 21,176 | 14.2 | 10.1 | 4.1 | -1.9 | 1.9188 |
1976 | 5,065,000 | 65,267 | 54,001 | 11,266 | 12.9 | 10.6 | 2.2 | 0.4 | 1.7472 |
1977 | 5,078,000 | 61,878 | 50,485 | 11,393 | 12.2 | 9.9 | 2.2 | 1.5 | 1.6598 |
1978 | 5,097,000 | 62,036 | 52,864 | 9,172 | 12.2 | 10.4 | 1.8 | 1.1 | 1.6685 |
1979 | 5,112,000 | 59,464 | 54,654 | 4,810 | 11.6 | 10.7 | 0.9 | 1.1 | 1.6016 |
1980 | 5,122,000 | 57,293 | 55,939 | 1,354 | 11.2 | 10.9 | 0.3 | 0.1 | 1.5464 |
1981 | 5,124,000 | 53,089 | 56,359 | -3,270 | 10.4 | 11.0 | -0.6 | -0.4 | 1.4371 |
1982 | 5,119,000 | 52,658 | 55,368 | -2,710 | 10.3 | 10.8 | -0.5 | -0.1 | 1.4273 |
1983 | 5,116,000 | 50,822 | 57,156 | -6,334 | 9.9 | 11.2 | -1.2 | 0.4 | 1.3774 |
1984 | 5,112,000 | 51,800 | 57,109 | -5,309 | 10.1 | 11.2 | -1.0 | 0.8 | 1.4001 |
1985 | 5,111,000 | 53,749 | 58,378 | -4,629 | 10.5 | 11.4 | -0.9 | 1.9 | 1.4472 |
1986 | 5,116,000 | 55,312 | 58,100 | -2,788 | 10.8 | 11.3 | -0.5 | 2.3 | 1.4819 |
1987 | 5,125,000 | 56,221 | 58,136 | -1,915 | 11.0 | 11.3 | -0.4 | 1.2 | 1.4977 |
1988 | 5,129,000 | 58,844 | 58,984 | -127 | 11.5 | 11.5 | -0.0 | 0 | 1.5618 |
1989 | 5,129,000 | 61,351 | 59,397 | 2,047 | 12.0 | 11.6 | 0.4 | 0.8 | 1.6212 |
1990 | 5,135,000 | 63,433 | 60,926 | 2,545 | 12.3 | 11.9 | 0.5 | 1.6 | 1.6696 |
1991 | 5,146,000 | 64,358 | 59,581 | 4,777 | 12.5 | 11.6 | 0.9 | 2.2 | 1.6844 |
1992 | 5,162,000 | 67,726 | 60,821 | 6,905 | 13.1 | 11.8 | 1.3 | 2.4 | 1.7648 |
1993 | 5,181,000 | 67,369 | 62,809 | 4,560 | 13.0 | 12.1 | 0.9 | 2.2 | 1.7512 |
1994 | 5,197,000 | 69,666 | 61,099 | 8,567 | 13.4 | 11.7 | 1.6 | 2.1 | 1.8091 |
1995 | 5,216,000 | 69,771 | 63,127 | 6,644 | 13.3 | 12.1 | 1.3 | 5.4 | 1.8097 |
1996 | 5,251,000 | 67,638 | 61,043 | 6,595 | 12.9 | 11.6 | 1.3 | 3.3 | 1.7535 |
1997 | 5,275,000 | 67,648 | 59,898 | 7,750 | 12.8 | 11.3 | 1.5 | 2.3 | 1.7562 |
1998 | 5,295,000 | 66,174 | 58,453 | 7,721 | 12.5 | 11.0 | 1.5 | 1.9 | 1.7252 |
1999 | 5,313,000 | 66,220 | 59,179 | 7,041 | 12.4 | 11.1 | 1.3 | 1.9 | 1.7383 |
2000 | 5,330,000 | 67,084 | 57,998 | 9,086 | 12.6 | 10.9 | 1.7 | 1.9 | 1.7742 |
2001 | 5,349,000 | 65,458 | 58,355 | 7,103 | 12.2 | 10.9 | 1.3 | 2.3 | 1.7450 |
2002 | 5,368,000 | 64,075 | 58,610 | 5,465 | 11.9 | 10.9 | 1.0 | 2.0 | 1.7249 |
2003 | 5,384,000 | 64,599 | 57,574 | 7,025 | 12.0 | 10.7 | 1.3 | 1.3 | 1.7599 |
2004 | 5,398,000 | 64,609 | 55,086 | 9,523 | 12.0 | 10.2 | 1.8 | 0.6 | 1.7852 |
2005 | 5,411,000 | 64,282 | 54,962 | 9,320 | 11.9 | 10.1 | 1.7 | 1.3 | 1.8021 |
2006 | 5,427,000 | 64,984 | 55,477 | 9,507 | 12.0 | 10.2 | 1.7 | 2.2 | 1.8476 |
2007 | 5,448,000 | 64,082 | 55,604 | 8,478 | 11.7 | 10.2 | 1.6 | 3.5 | 1.8435 |
2008 | 5,476,000 | 65,038 | 54,591 | 10,447 | 11.8 | 9.9 | 1.9 | 4.5 | 1.8888 |
2009 | 5,511,000 | 62,818 | 54,872 | 7,946 | 11.4 | 9.9 | 1.4 | 3.0 | 1.8396 |
2010 | 5,535,000 | 63,411 | 54,368 | 9,043 | 11.4 | 9.8 | 1.6 | 3.1 | 1.8712 |
2011 | 5,561,000 | 58,998 | 52,516 | 6,482 | 10.6 | 9.4 | 1.2 | 2.4 | 1.7524 |
2012 | 5,581,000 | 57,916 | 52,325 | 5,591 | 10.4 | 9.4 | 1.0 | 2.9 | 1.7292 |
2013 | 5,603,000 | 55,844 | 52,428 | 3,416 | 9.9 | 9.3 | 0.6 | 3.7 | 1.6687 |
2014 | 5,627,000 | 56,870 | 51,340 | 5,530 | 10.1 | 9.1 | 1.0 | 4.9 | 1.6912 |
2015 | 5,660,000 | 58,205 | 52,555 | 5,650 | 10.2 | 9.2 | 1.0 | 7.3 | 1.7136 |
2016 | 5,707,000 | 61,614 | 52,824 | 8,790 | 10.7 | 9.2 | 1.5 | 5.9 | 1.7854 |
2017 | 5,749,000 | 61,272 | 53,261 | 8,011 | 10.6 | 9.2 | 1.4 | 4.2 | 1.7519 |
2018 | 5,781,000 | 61,476 | 55,232 | 6,244 | 10.6 | 9.5 | 1.1 | 3.2 | 1.7297 |
2019 | 5,806,000 | 61,167 | 53,958 | 7,209 | 10.5 | 9.3 | 1.2 | 1.7 | 1.6994 |
2020 | 5,822,763 | 60,937 | 54,645 | 6,292 | 10.4 | 9.4 | 1.0 | 2.0 | 1.6747 |
2021 | 5,840,045 | 63,473 | 57,152 | 6,321 | 10.8 | 9.7 | 1.1 | 4.6 | 1.7241 |
2022 | 5,873,420 | 58,430 | 59,435 | -1,005 | 9.948 | 10.119 | -0.171 | 10.3 | 1.5529 |
2023 | 5,932,654 | 57,469 | 58,384 | -915 | 9.686 | 9.841 | -0.155 | 5.0 | 1.4959 |
2024 | 5,961,249 |
In 2022, 45,922 (78.6%) babies were born to mothers of Danish origin, 10,039 (17.2%) to immigrant mothers and 2,469 (4.2%) to mothers who are descendants of immigrants. [29]
Period [30] | Live births | Deaths | Natural increase |
---|---|---|---|
January – September 2023 | 43,646 | 42,865 | +781 |
January – September 2024 | 43,110 | 42,357 | +753 |
Difference | -536 (-1.23%) | -508 (-1.19%) | -28 |
Age Group | Male | Female | Total | % |
---|---|---|---|---|
Total | 2 910 605 | 2 939 584 | 5 850 189 | 100 |
0–4 | 159 616 | 151 094 | 310 710 | 5.31 |
5–9 | 153 902 | 145 996 | 299 898 | 5.13 |
10–14 | 172 489 | 163 504 | 335 993 | 5.74 |
15–19 | 174 065 | 166 351 | 340 416 | 5.82 |
20–24 | 190 440 | 182 547 | 372 987 | 6.38 |
25–29 | 205 462 | 196 996 | 402 458 | 6.88 |
30–34 | 190 728 | 182 907 | 373 635 | 6.39 |
35–39 | 167 754 | 163 263 | 331 017 | 5.66 |
40–44 | 174 967 | 173 743 | 348 710 | 5.96 |
45–49 | 196 490 | 197 259 | 393 749 | 6.73 |
50–54 | 199 625 | 197 330 | 396 955 | 6.79 |
55–59 | 203 904 | 202 673 | 406 577 | 6.95 |
60–64 | 173 413 | 176 026 | 349 439 | 5.97 |
65–69 | 156 575 | 163 852 | 320 427 | 5.48 |
70–74 | 149 499 | 162 406 | 311 905 | 5.33 |
75–79 | 125 586 | 142 076 | 267 662 | 4.58 |
80–84 | 69 552 | 88 329 | 157 881 | 2.70 |
85–89 | 33 148 | 50 931 | 84 079 | 1.44 |
90–94 | 11 095 | 23 783 | 34 878 | 0.60 |
95–99 | 2 113 | 7 469 | 9 582 | 0.16 |
100+ | 182 | 1 049 | 1 231 | 0.02 |
Age group | Male | Female | Total | Percent |
0–14 | 486 007 | 460 594 | 946 601 | 16.18 |
15–64 | 1 876 848 | 1 839 095 | 3 715 943 | 63.52 |
65+ | 547 750 | 639 895 | 1 187 645 | 20.30 |
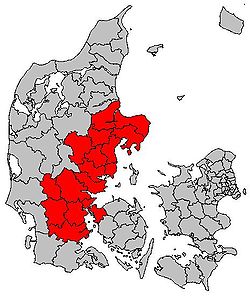
The urban area of Copenhagen consists of the contiguously built-up area of the capital of Denmark. The Copenhagen metropolitan area consists of 34 municipalities. The East Jutland metropolitan area includes 19 municipalities.
The Church of Denmark (Den danske folkekirke) is state-supported and, according to statistics from January 2022, accounts for the religious affiliation of 73.2% of the population. [32] Denmark has had religious freedom guaranteed since 1849 by the Constitution, [33] and numerous other religions are officially recognised, [34] including several Christian denominations, Muslim, Jewish, Buddhist, Hindu and other congregations as well as Forn Siðr, a revival of Scandinavian pagan tradition. [34] The Department of Ecclesiastical Affairs recognises roughly a hundred religious congregations for tax and legal purposes such as conducting wedding ceremonies.
In 2013, just under 20% of the Danish population identifies as atheist. [35]
Islam is the second largest religion in Denmark. [36] In 2020, an estimated 4.4% of the Danish population were Muslims. [37]
For historical reasons, there is a formal distinction between 'approved' (godkendte) and 'recognised' (anerkendte) congregations of faith. [34] The latter include 11 traditional denominations, such as Roman Catholics, the Reformed Church, the Mosaic Congregation, Methodists and Baptists, some of whose privileges in the country date hundreds of years back. These have the additional rights of having priests appointed by royal resolution and to christen/name children with legal effect.
Evangelical Lutheran (official) 74.8%, Muslim 5.3%, other (denominations of less than 1% each, include Roman Catholic, Jehovah's Witness, Serbian Orthodox Christian, Jewish, Baptist, and Buddhist) 19.9% (2017 est.)
Economy of Denmark
Although the level of taxation in Denmark is among the highest in the world, the labor market participation rate is still high compared with other Western countries. Municipal income tax makes up the largest part of taxation in Denmark, with central government income tax topping it up. These income taxes are higher than in other OECD countries. These direct taxes make up two thirds of the taxation on private households with indirect taxes of the central government, and municipalities (property tax), making up one third, i.e. with motor vehicles (passenger cars, motorcycles, commercial vehicles) sold from VAT registered dealerships – because of the registration fee – being among the most expensive in the world, with prices in Norway at the same level, and the most expensive in Singapore. Also VAT in Denmark is not reduced from the current 25%. The 25% are paid on all goods and services where VAT is applied. Indirect taxes are about average compared with other European OECD countries. Payroll taxes (Danish sociale afgifter) are much lower than in other OECD countries. The tax structure ensures a broad tax base across the whole population. However, revenue from corporate taxes is lower compared with other European countries. Municipalities and the central government (regions are not allowed to levy any taxes, as they are financed by central government, and municipal block grants) redistribute a large amount of their tax income in transfer payments to municipalities with a low tax base and/or few tax payers. It is normal for children to be in nurseries, which requires a partial payment of the costs or is free of charge for low income households, and in kindergartens owned and operated, or financed, by the public sector. Child benefit is paid to parents for each child. The service to old age pensioners, and handicapped is extensive.
Denmark ranks high in the Corruption Perceptions Index, although the index is criticized for being limited in scope.
Homelessness in Denmark is considered a significant social issue in the country. [38] [39] Since 2007, comprehensive counts have been performed every other year in week six (early February). The latest, from 2017, counted 6,635 homeless people in Denmark. [40] [41] The total number of people experiencing homelessness at some point in 2017 was estimated at 13,000, [40] while earlier estimates have placed it between 10,000 and 15,000. [42] Roughly half the homeless are in the Capital Region. [41] When compared to many other countries, such as the United States, the rate of Denmark's homeless is significantly lower, which has been linked to the relatively comprehensive welfare system. [43]
The number of homeless people in Denmark has risen in recent decades, but this has been most pronounced in people that are between 18 and 29 years old (although 30 to 59 years old remains the largest age group, at 70%), women (although men remains the largest group, at 75%) and immigrants (although Danish citizens remain the largest group). [40] [41] [44] [45] Among the foreign, a high percentage are Eastern or Southern European men that seek work in Denmark. [45] Many of these only stay in Denmark during the summer, returning to their respective countries during the relatively cold Danish winter. [46]
Based on the comprehensive count in February 2017, roughly one-tenth of homeless people in Denmark are "street sleepers" (which also includes people sleeping in stairways, sheds and other places not intended for human habitation), with the remaining sleeping in the homes of friends/family, in hotels/hostels, in shelters or alike. [40] [41] The number of street sleepers is higher during the summer, [40] and homeless foreigners are overrepresented among them. [46] Among homeless in Denmark, the primary issue is psychiatric disease at 36% (24% receive treatment), drug addiction at 27% (17% receive treatment) and alcohol addiction at 23% (9% receive treatment). Overall it is estimated that more than half of all homeless people have mental health issues. [41] Compared to many other countries such as the United States, a higher percentage of Denmark's homeless have mental health issues or substance abuse, as countries with weaker welfare systems tend to have higher homeless rates but the homeless will more likely to include from a wide range of groups. [43]
The government of Denmark's approach to homelessness include commissioning national surveys on homelessness during the last decade that allow for direct comparison between Denmark, Norway and Sweden. [47] The three countries have very similar definitions of homelessness, with minor variations. [48]Demographic features of the population of Cambodia include population density, ethnicity, education level, health of the populace, economic status, religious affiliations and other aspects of the population.
The demography of Germany is monitored by the Statistisches Bundesamt. According to the most recent data, Germany's population is 84,669,326 making it the most populous country in the European Union and the nineteenth-most populous country in the world. The total fertility rate was rated at 1.58 in 2021, significantly below the replacement rate of 2.1. For a long time Germany had one of the world's lowest fertility rates of around 1.3 to 1.4, however there has been a small increase in recent years. Due to the low birth rate Germany has recorded more deaths than births every year since 1972, which means 2021 was the 50th consecutive year the German population would have decreased without immigration. However, due to immigration the population has actually increased during the last half-century. In 2019 the number of people with a foreign background was 26%; this category includes foreigners, naturalized citizens, ethnic German repatriates from Eastern Europe and the children of all of the above.
Ireland had an estimated population of 5,380,000 as of 1 April 2024.
This is a demography of the population of Namibia including population density, ethnicity, education level, health of the populace, economic status, religious affiliations and other aspects of the population.
The demography of Sweden is monitored by the Statistiska centralbyrån. Sweden's population was 10,555,448, making it the 15th-most populous country in Europe after Czech Republic, the 10th-most populous member state of the European Union, and the 87th-most populous country in the world. The total fertility rate was rated at 1.66 in 2020, which is far below the replacement rate of 2.1.
As of 7 November 2024, Spain had a total population of 48,946,035 The modern Kingdom of Spain arose from the accretion of several independent Iberian realms, including the Kingdoms of León, Castile, Navarre, the Crown of Aragon and Granada, all of which, together with the modern state of Portugal, were successor states to the late antique Christian Visigothic Kingdom after the Reconquista.
Demographic features of the population of Norway, including Jan Mayen, and Svalbard, where the hospital is not equipped for births, and no burials are allowed because of permafrost, include population density, ethnicity, education level, health of the populace, economic status, religious affiliations and other aspects.
The demographics of Iceland include population density, education level, health of the populace, economic status, religious affiliations and other aspects of the population.
Demographic features of the population of Belgium include ethnicity, education level, health of the populace, economic status, religious affiliations and other aspects. All figures are from the National Institute for Statistics unless otherwise indicated.
The demography of France is monitored by the Institut national d'études démographiques (INED) and the Institut national de la statistique et des études économiques (INSEE). As of 1 January 2021, 66,142,961 people lived in Metropolitan France, while 2,230,472 lived in overseas France, for a total of 68,373,433 inhabitants in the French Republic.
Christianity is the largest religion in Denmark. As of 2024, 71.2% of the population of Denmark were registered members of the Church of Denmark, the officially established church, which is Protestant in classification and Lutheran in orientation.
Heritable family names were generally adopted rather late within Scandinavia. Nobility were the first to take names that would be passed on from one generation to the next. Later, clergy, artisans and merchants in cities took heritable names. Family names (surnames) were still used together with primary patronyms, which were used by all social classes. This meant that most families until modern times did not have surnames. Scandinavian patronyms were generally derived from the father's given name with the addition of a suffix meaning 'son' or 'daughter' or by occupation like Møller - naming tradition remained commonly used throughout the Scandinavian countries during the time of surname formation. Forms of the patronymic suffixes include: -son, -sen, -fen, -søn, -ler, -zen, -zon/zoon, and -sson,'datter'.
Iraqis in Denmark consist of both immigrants from Iraq to Denmark and their descendants, and may hold either Iraqi or Danish citizenship.
The demographics of the European Union show a highly populated, culturally diverse union of 27 member states. As of 1 January 2024, the population of the EU is around 449 million people.
Christianity is a prevalent religion in Denmark; in January 2023, 72.1% of the population of Denmark were members of the Church of Denmark. According to a survey based on a sample 1,114, 25% of Danes believe Jesus is the son of God, and 18% believe he is the saviour of the world. Aside from Lutheranism, there is a small Catholic minority, as well as small Protestant denominations such as the Baptist Union of Denmark and the Reformed Synod of Denmark.
Denmark has seen an increase in immigration over the past 30 years, with a large part of the immigrants originating from non-Western countries. As of 2014, more than 8 percent of the population of Denmark consists of immigrants. As of Q2 of 2022, the population of immigrants is 652,495, excluding Danish born descendants of immigrants to Denmark. This shift in demographics has posed challenges to the nation as it attempts to address cultural and religious differences, labour shortages, employment gaps, education of immigrants and their descendants, spatial segregation, crime rates and language abilities.
Somalis in Denmark are citizens and residents of Denmark who are of Somali descent.
Lebanese people of Denmark are people from Lebanon or those of Lebanese descent who live in the country of Denmark. The majority of Lebanese people came to Denmark in the 1970s and 1980s, either escaping the Lebanese Civil War or for economic reasons. Per 1 October 2016, 26,404 persons in Denmark were of Lebanese origin.
The Albanians in the Nordic countries refers to the Albanian migrants in Nordic countries such as Denmark, Faroe Islands, Finland, Norway and Sweden and their descendants.
Portuguese in Denmark are citizens and residents of Denmark and its dependencies who are of Portuguese descent.
{{cite web}}
: CS1 maint: archived copy as title (link){{cite web}}
: CS1 maint: archived copy as title (link)No person shall for reasons of his creed or descent be deprived of access to complete enjoyment of his civic and political rights, nor shall he for such reasons evade compliance with any common civic duty.
This article incorporates public domain material from The World Factbook. CIA.