Demographics of Bosnia and Herzegovina

Last updated

Demographics of Bosnia and Herzegovina
Bosnia and Herzegovina single age population pyramid 2020.png
Population pyramid of Bosnia Herzegovina in 2020
Population2,946,301 (2022 est.)
Growth rate-0.22% (2022 est.)
Birth rate8.41 births/1,000 population (2022 est.)
Death rate10.26 deaths/1,000 population (2022 est.)
Life expectancy77.98 years
  male75.02 years
  female81.15 years
Fertility rate1.36 children born/woman (2022 est.)
Infant mortality rate5.21 deaths/1,000 live births
Net migration rate-0.38 migrant(s)/1,000 population (2022 est.)
Age structure
0–14 years13.18%
65 and over16.22%
Sex ratio
Total0.95 male(s)/female (2022 est.)
At birth1.07 male(s)/female
Under 151.07 male(s)/female
65 and over0.42 male(s)/female
Nationality
Nationality Bosnian
Major ethnic Bosniak (50.1%)
Minor ethnic Serb (30.7%) ,Croat (15.4%)
Language
OfficialBosnian, Serbian, Croatian
SpokenBosnian, Serbian, Croatian

Demographic features of the population of Bosnia and Herzegovina include population density, ethnicity, education level, health of the populace, economic status, religious affiliations and other aspects of the population.

Contents

Population density in Bosnia and Herzegovina by municipality, early data from the 2013 census BiH population density map 2013 by municipalities.png
Population density in Bosnia and Herzegovina by municipality, early data from the 2013 census

Vital statistics

[1] Source: Agency for Statistics of Bosnia and Herzegovina [2]

YearMid-year populationLive birthsDeathsNatural changeCrude birth rate (per 1000)Crude death rate (per 1000)Natural change (per 1000)Total fertility rateFemale fertile population (15–49 years)
19472,532,00084,60038,900 45,70033.415.418.0
19482,581,98790,70041,60049,10035.116.119.0647,112
19492,641,99098,20042,200 56,00037.216.021.2669,152
19502,662,010102,68035,99166,68938.613.525.15.17691,192
19512,721,00992,33046,35845,97233.917.016.94.51713,232
19522,790,991112,21634,81777,39940.212.527.75.33735,272
19532,863,124110,37341,19969,17438.514.424.24.84757,312
19542,916,007115,85435,15880,69639.712.127.74.93765,462
19552,973,986110,86640,51370,35337.313.623.74.59773,612
19563,025,000111,56138,32073,24136.912.724.24.48781,761
19573,076,006102,64936,83065,81933.412.021.44.02789,911
19583,126,012110,33230,12380,20935.39.625.74.22798,061
19593,185,005108,12332,50775,61633.910.223.74.06806,211
19603,240,010110,49933,36077,13934.110.323.84.06814,360
19613,291,684108,07629,41378,66332.88.923.93.91822,510
19623,338,505106,82631,08775,73932.09.322.73.86838,877
19633,385,326104,24029,16175,07930.88.622.23.75855,245
19643,432,147101,14729,84671,30129.58.720.83.62871,612
19653,478,968101,35127,81473,53729.18.021.13.61887,979
19663,525,78997,68925,13872,55127.77.120.63.46904,347
19673,572,60992,97226,195 66,77726.07.318.73.28920,714
19683,619,43089,13426,03163,10324.67.217.43.14937,081
19693,666,25187,68727,805 59,88223.97.616.33.05953,448
19703,713,07279,29626,35552,94121.47.114.32.74969,816
19713,759,89382,69424,91557,77922.06.615.42.83986,183
19723,797,52382,06826,84455,22421.67.114.52.76998,220
19733,835,15477,89624,67253,22420.36.413.92.571,010,257
19743,872,78477,83323,66154,17220.16.114.02.521,022,293
19753,910,41478,84425,571 53,27320.26.513.62.511,034,330
19763,948,04579,06125,178 53,88320.06.413.62.471,046,367
19773,985,67575,66924,821 50,84819.06.212.82.321,058,404
19784,023,30573,30626,016 47,29018.26.511.82.211,070,441
19794,060,93571,12025,370 45,75017.56.211.32.101,082,477
19804,098,56670,92826,115 44,81317.36.410.92.061,094,514
19814,136,19671,03126,222 44,80917.26.310.82.031,106,551
19824,160,28073,37526,775 46,60017.66.411.22.091,105,958
19834,184,36374,29629,99944,29717.87.210.62.121,105,366
19844,208,44774,53929,04645,49317.76.910.82.131,104,773
19854,232,53172,72228,966 43,75617.26.810.32.081,104,181
19864,256,61571,20329,127 42,07616.76.89.92.041,103,588
19874,280,69870,89829,382 41,51616.66.99.72.031,102,995
19884,304,78270,71129,55541,15616.46.99.62.031,102,403
19894,328,86666,80930,383 36,42615.47.08.41.921,101,810
19904,352,94966,95229,093 37,85915.46.78.71.931,101,218
19914,377,03364,76930,680 34,08914.87.07.81.871,100,625
1992*
1993*
1994*
1995*
19963,368,59746,59425,15221,44213.87.56.41.88862,840
19973,398,26448,06127,87520,18614.18.25.91.95866,251
19983,423,92145,00728,67916,32813.18.44.81.83870,474
19993,445,17242,46428,63713,82712.38.34.01.73874,188
20003,462,33639,56330,4829,08111.48.82.61.61876,695
20013,478,67937,71730,3257,39210.88.72.11.54879,484
20023,493,14636,48530,8315,65410.48.81.61.49881,166
20033,498,29134,69132,0182,6739.99.20.81.42879,547
20043,501,46733,86232,2231,6399.79.20.51.38877,903
20053,503,63433,23333,925-6929.59.7-0.21.36875,167
20063,500,21233,03832,6523869.49.30.11.36871,089
20073,498,02332,80134,392-1,5919.49.8-0.51.35867,212
20083,493,73734,02333,8711529.79.70.01.41859,217
20093,491,32734,44934,709-2609.99.9-0.11.43851,596
20103,488,44133,44534,905-1,4609.610.0-0.41.40847,365
20113,484,15431,69434,820-3,1269.110.0-0.91.33843,765
20123,479,33932,41435,578-3,1649.310.2-0.91.36839,698
20133,473,82630,55135,379-4,8288.810.2-1.41.30832,872
20143,466,50730,13435,692-5,5588.710.3-1.61.29825,060
20153,456,50029,64737,876-8,2298.611.0-2.41.28815,928
20163,447,00129,98536,065-6,0808.710.5-1.81.30806,794
20173,437,45330,06137,453-7,3928.710.9-2.21.31797,851
20183,427,36929,32837,237-7,9098.610.9-2.31.29789,269
20193,415,75228,19238,237-10,0458.311.2-2.91.26781,299
20203,403,63827,15643,808-16,6528.012.9-4.91.23772,876
20213,378,82126,99349,682-22,6898.014.7-6.71.24763,709
20223,358,49626,51640,692-14,1767.912.1-4.21.23755,419
20233,345,81826,29434,983-8,6897.910.5-2.61.23748,332

*No data for the period 1992–1995

Current vital statistics

[3]

PeriodLive birthsDeathsNatural increase
January - September 202318,34425,807-7,463
January - September 202418,00026,373-8,373
DifferenceDecrease2.svg -344 (-1.87%)Increase Negative.svg +566 (+2.19%)Decrease2.svg -910

Structure of the population

Population by Sex and Age Group (Census 30.IX.2013): [4]
Age GroupMaleFemaleTotal%
Total1 732 2701 798 8893 531 159100
0–489 44284 622174 0644.93
5–990 88186 099176 9805.01
10–1498 65394 022192 6755.46
15–19124 900117 842242 7426.87
20–24116 883111 173228 0566.46
25–29129 248123 070252 3187.15
30–34128 593124 040252 6337.15
35–39126 145123 121249 2667.06
40–44121 595119 543241 1386.83
45–49130 087130 841260 9287.39
50–54136 153140 422276 5757.83
55–59125 576132 961258 5377.32
60–64104 970118 281223 2516.32
65–6969 06684 503153 5694.35
70–7459 85480 601140 4553.98
75–7947 40369 864117 2673.32
80–8423 76938 86762 6361.77
85+9 05219 01728 0690.79
Age groupMaleFemaleTotalPercent
0–14278 976264 743543 71915.40
15–641 244 1501 241 2942 485 44470.39
65+209 144292 852501 99614.22

Vital statistics by entity

Federation of Bosnia and Herzegovina

[5] [6]

Source: Institute for Statistics of the Federation of Bosnia and Herzegovina [7]

Current vital statistics

[15]

PeriodLive birthsDeathsNatural increase
January - September 202311,41814,763-3,345
January - September 202411,22814,739-3,511
DifferenceDecrease2.svg -190 (-1.66%)Decrease Positive.svg -24 (-0.16%)Decrease2.svg -166

Republika Srpska

[16] [17]

Source: Republika Srpska Institute of Statistics [18]

Current vital statistics

[26]

Brčko District

Source: Agency for Statistics of Bosnia and Herzegovina - Statistics of the Brčko District BiH [27]

Current vital statistics

[36]

PeriodLive birthsDeathsNatural increase
January - September 2023596815-219
January - June 2024581898-317
DifferenceDecrease2.svg -15 (-2.52%)Increase Negative.svg +83 (+10.18%)Decrease2.svg -98

Marriages and divorces

Federation of Bosnia and Herzegovina

Republika Srpska

Brčko District

Life expectancy at birth in Bosnia and Herzegovina

Life expectancy in Bosnia and Herzegovina since 1950 Life expectancy in Bosnia and Herzegovina.svg
Life expectancy in Bosnia and Herzegovina since 1950
Life expectancy in Bosnia and Herzegovina since 1960 by gender Life expectancy by WBG -Bosnia and Herzegovina -diff.png
Life expectancy in Bosnia and Herzegovina since 1960 by gender
PeriodLife expectancy in
Years [38]
1950-195553.67
1955-1960Increase2.svg 58.46
1960-1965Increase2.svg 61.93
1965-1970Increase2.svg 64.73
1970-1975Increase2.svg 67.57
1975-1980Increase2.svg 69.87
1980-1985Increase2.svg 70.72
1985-1990Increase2.svg 71.95
1990-1995Decrease2.svg 70.13
1995-2000Increase2.svg 73.61
2000-2005Increase2.svg 74.81
2005-2010Increase2.svg 75.53
2010-2015Increase2.svg 76.53
2015-2020Increase2.svg 77.18

Ethnic groups

According to data from the 2013 census published by the Agency for Statistics of Bosnia and Herzegovina, Bosniaks constitute 50.11% of the population, Bosnian Serbs 30.78%, Bosnian Croats 15.43%, and others form 2.73%, with the remaining respondents not declaring their ethnicity or not answering. [39]

The census results are contested by the Republika Srpska statistical office and by Bosnian Serb politicians, [40] who oppose the inclusion of non-permanent Bosnian residents in the figures. [41]

The European Union's statistics office, Eurostat, determined that the methodology used by the Bosnian statistical agency was in line with international recommendations. [42]

In Bosnia and Herzegovina, religion is often linked to ethnicity, i.e. (with the exception of agnostics and atheists) most Bosniaks are Muslim, Serbs are Orthodox Christian, and Croats are Roman Catholic.

Population of Bosnia and Herzegovina according to ethnic group 1948-2013
Ethnic
group
Census 1948Census 1953Census 1961Census 1971Census 1981Census 1991Census UNHCR 1996Census 2013 [43] Change 1991–2013
Number %Number %Number %Number %Number %Number %Number %Number %Number %
Muslims/Bosniaks 788,40330.7891,80031.3842,24825.71,482,43039.61,629,92439.51,902,95643.481,805,91046.11,769,59250.11-133,364+6.63pp
Serbs 1,136,11644.31,264,37244.41,406,05742.91,393,14837.21,320,64432.01,366,10431.221,484,53037.91,086,73330.78-279,371-0.44pp
Croats 614,12323.9654,22923.0711,66521.7772,49120.6758,13618.4760,85217.39571,31714.6544,78015.43-216,072-1.96pp
Yugoslavs 275,8838.443,7961.2326,2807.9242,6825.552,5700.07
Montenegrins 3,0940.17,3360.312,8280.413,0210.314,1140.310,0710.231,8830.05
Roma 4420.02,2970.15880.01,4560.07,2510.28,8640.2012,5830.36
Albanians 3,6420.13,7640.14,3960.14,9250.112,5690.07
Others/undeclared23,0990.927,7561.028,6790.836,005163,2631.580,5791.8458,1961.5110,4493.13
Total2,565,2772,847,7903,277,9483,746,1114,124,0084,377,0333,919,9533,531,159

Languages

Bosnia's constitution does not specify any official languages; [44] [45] [46] however, academics Hilary Footitt and Michael Kelly note that the Dayton Agreement states that it is "done in Bosnian, Croatian, English and Serbian", and they describe this as the "de facto recognition of three official languages" at the state level. The equal status of Bosnian, Serbian and Croatian was verified by the Constitutional Court in 2000. [46] It ruled that the provisions of the Federation and Republika Srpska constitutions on language were incompatible with the state constitution, since they only recognised "Bosniak" and Croatian (in the case of the Federation) and Serbian (in the case of Republika Srpska) as official languages at the entity level.[ citation needed ]

As a result, the wording of the entity constitutions was changed and all three languages were made official in both entities. [46] The three languages are mutually intelligible and are also known collectively as Serbo-Croatian. Use of one of the three varieties has become a marker of ethnic identity. [47] Michael Kelly and Catherine Baker argue: "The three official languages of today's Bosnian state...represent the symbolic assertion of national identity over the pragmatism of mutual intelligibility". [48]

All standard varieties are based on the Ijekavian varieties of the Shtokavian dialect (non-standard spoken varieties including, beside Ijekavian, also Ikavian Shtokavian). Serbian and Bosnian are written in both Latin and Cyrillic (the latter predominantly using the Latin script), whereas Croatian is written only in Latin alphabet. There are also some speakers of Italian, German, Turkish and Ladino. Yugoslav Sign Language is used with Croatian and Serbian variants.[ citation needed ]

According to the results of the 2013 census, 52.86% of the population consider their mother tongue to be Bosnian, 30.76% Serbian, 14.6% Croatian and 1.57% another language, with 0.21% not giving an answer. [39]

Religion

According to the 2013 census, 50.7% of the population identify religiously as Muslim, 30.75% as Serbian Orthodox Christian, 15.19% as Roman Catholic, 1.15% as other, 1.1% as agnostic or atheist, with the remainder not declaring their religion or not answering. [39] A 2012 survey found that 47% of Bosnia's Muslims are non-denominational Muslims, while 45% follow Sunnism. [49] In Bosnia and Herzegovina, religion is strongly linked to ethnicity.
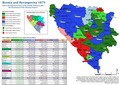
Demographic statistics

Population pyramid 2016 Bevolkerungspyramide Bosnien 2016.png
Population pyramid 2016

The following demographic statistics are from the CIA World Factbook, unless otherwise indicated.

Population

3,378,821 [1]

Age structure

0-14 years: 13.18% (male 261,430/female 244,242)
15-24 years: 10.83% (male 214,319/female 201,214)
25-54 years: 44.52% (male 859,509/female 848,071)
55-64 years: 15.24% (male 284,415/female 300,168)
65 years and over: 16.22% (male 249,624/female 372,594) (2020 est.)

Median age

Total: 43.3 years
Male: 41.6 years
Female: 44.8 years (2020 est.)

Sex ratio

At birth: 1.07 male(s)/female
0-14 years: 1.07 male(s)/female
15-24 years: 1.07 male(s)/female
25-54 years: 1.01 male(s)/female
55-64 years: 0.95 male(s)/female
65 years and over: 0.67 male(s)/female
Total population: 0.95 male(s)/female (2020 est.)

Infant mortality rate

Total: 5.32 deaths/1,000 live births
Male: 5.44 deaths/1,000 live births
Female: 5.19 deaths/1,000 live births (2021 est.)

Life expectancy at birth

Total population: 77.74 years
Male: 74.76 years
Female: 80.93 years (2021 est.)

HIV/AIDS

Adult prevalence rate: less than 0.1% (2018)
People living with HIV/AIDS: Less than 500 (2018)
Deaths: less than 100 (2018)

Literacy

Definition: age 15 and over can read and write
Total population: 98.5%
Male: 99.5%
Female: 97.5% (2015 est.)

See also

Religion:

Groups:

References

  1. 1 2 "Eurostat database". ec.europa.eu.
  2. "Agency for Statistics of Bosnia and Herzegovina". bhas.gov.ba.
  3. "Natural population change". bhas.gov.ba.
  4. "Demographic and Social Statistics". unstats.un.org. United Nations.
  5. "Population bulletins". fzs.ba.
  6. "Statistical Yearbook". fzs.ba.
  7. "Institute for Statistics of the Federation of Bosnia and Herzegovina". fzs.ba.
  8. "Statistical Yearbook 2006" (PDF). fzs.ba. Archived (PDF) from the original on 2022-10-09.
  9. "POPULATION OF THE FEDERATION BOSNIA AND HERZEGOVINA 1996 - 2006" (PDF). fzs.ba. Archived (PDF) from the original on 2022-10-09.
  10. "Demographics, 2017" (PDF). fzs.ba. Archived (PDF) from the original on 2022-10-09.
  11. "Demographics, 2018}" (PDF). fzs.ba. Archived (PDF) from the original on 2022-10-09.
  12. "Demographics, 2019" (PDF). fzs.ba. Archived (PDF) from the original on 2022-10-09.
  13. "Demographics, 2020" (PDF). fzs.ba. Archived (PDF) from the original on 2022-10-09.
  14. "Demographics, 2021" (PDF). fzs.ba. Archived (PDF) from the original on 2022-10-09.
  15. "PRIRODNO KRETANJE STANOVNIŠTVA I BRAKOVI PO MJESECIMA (Natural changes of population and marriages by months)". fzs.ba.
  16. "Republika Srpska Institute of Statistics".
  17. "Population bulletins". rzs.rs.ba.
  18. "Republika Srpska Institute of Statistics". rzs.rs.ba.
  19. "STATISTICAL YEARBOOK OF REPUBLIKA SRPSKA, 2009" (PDF). rzs.rs.ba. Archived (PDF) from the original on 2022-10-09.
  20. "DEMOGRAPHIC STATISTICS, 2019" (PDF). rzs.rs.ba. Archived (PDF) from the original on 2022-10-09.
  21. "Statistical Yearbook of Republika Srpska, 2019" (PDF). rzs.rs.ba. Archived from the original (PDF) on 2020-07-11. Retrieved 2020-01-04.
  22. "DEMOGRAPHIC STATISTICS, 2020" (PDF). rzs.rs.ba. Archived (PDF) from the original on 2022-10-09.
  23. "Statistical Yearbook of Republika Srpska, 2020" (PDF). rzs.rs.ba. Archived (PDF) from the original on 2022-10-09.
  24. "Births and deaths in Republika Srpska, 2020". rzs.rs.ba.
  25. "Births and deaths in Republika Srpska, 2021". rzs.rs.ba.
  26. "Monthly statistical review". rzs.rs.ba.
  27. "Agency for Statistics of Bosnia and Herzegovina - Statistics of the Brčko District BiH". bhas.gov.ba.
  28. "Demographics 2002-2003" (PDF). bhas.ba. Archived from the original (PDF) on 2019-05-29. Retrieved 2020-03-14.
  29. "Demographics 2004-2008" (PDF). bhas.ba. Archived from the original (PDF) on 2020-08-02. Retrieved 2020-03-14.
  30. "Demographics 2008-2012" (PDF). bhas.ba. Archived from the original (PDF) on 2019-05-29. Retrieved 2020-03-14.
  31. "Demographics 2013-2017" (PDF). bhas.ba. Archived from the original (PDF) on 2020-08-02. Retrieved 2020-03-14.
  32. "DEMOGRAFIJA u Brčko distriktu BiH 2014-2018.godina" (PDF). bhas.gov.ba. Archived (PDF) from the original on 2022-10-09.
  33. "DEMOGRAFIJA u Brčko distriktu BiH 2015-2019.godina" (PDF). bhas.gov.ba. Archived (PDF) from the original on 2021-05-15.
  34. "Statistički podaci BRČKO DISTRIKTA BiH, 2020" (PDF). bhas.gov.ba. Archived (PDF) from the original on 2021-05-16.
  35. "Statistički podaci BRČKO DISTRIKTA BiH, 2021" (PDF). bhas.gov.ba.
  36. "Statistical bulletin, Brčko District". bhas.gov.ba.
  37. "Marriages and divorces in Republika Srpska, 2019" (PDF). rzs.rs.ba. Archived (PDF) from the original on 2020-08-03.
  38. "World Population Prospects - Population Division - United Nations". esa.un.org. Retrieved 2018-08-26.
  39. 1 2 3 "Census of population, households and dwellings in Bosnia and Herzegovina, 2013: Final results" (PDF). Agency for Statistics of Bosnia and Herzegovina. June 2016. Archived from the original (PDF) on 30 June 2016. Retrieved 1 July 2016.
  40. Toe, Rodolfo (30 June 2016). "Census Reveals Bosnia's Changed Demography". Balkan Insight. Retrieved 1 July 2016.
  41. Toe, Rodolfo (30 June 2016). "Bosnia to Publish Census Without Serb Agreement". Balkan Insight. Retrieved 1 July 2016.
  42. "Bosnia-Herzegovina has lost a fifth of its pre-war population". The Guardian. 2016.
  43. "1. Stanovništvo prema etničkoj/nacionalnoj pripadnosti - detaljna klasifikacija". Popis.gov.ba. Retrieved 28 December 2017.
  44. Faingold, Eduardo D. (2004). "Language rights and language justice in the constitutions of the world". Language Problems & Language Planning. 28 (1): 11–24. doi:10.1075/lplp.28.1.03fai.
  45. Sadurski, Wojciech (2005). Rights Before Courts: A Study of Constitutional Courts in Postcommunist States of Central and Eastern Europe . Springer. p.  342. ISBN   1402030061.
  46. 1 2 3 Footitt, Hilary; Kelly, Michael (2012). Languages at War: Policies and Practices of Language Contacts in Conflict. Basingstoke: Palgrave Macmillan. pp. 111–120. ISBN   978-0230368774.
  47. Greenberg, Robert David (2004). Language and Identity in the Balkans: Serbo-Croatian and its Disintegration. Oxford: Oxford University Press. ISBN   978-0-19-925815-4.
  48. Kelly, Michael; Baker, Catherine (2013). Interpreting the Peace: Peace Operations, Conflict and Language in Bosnia-Herzegovina. Basingstoke: Palgrave Macmillan. p. 10. ISBN   978-1137029836.
  49. "The World's Muslims: Unity and Diversity" (PDF). Pew Research Center. 2012. p. 30. Archived from the original (PDF) on 26 January 2017. Retrieved 7 April 2016.

PD-icon.svg This article incorporates public domain material from The World Factbook (2025 ed.). CIA.  (Archived 2009 edition.) [ dead link ]