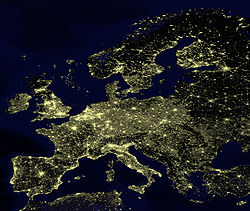
The population density of the EU is 106 people per km . Note that the lights in the North Sea are from oil platforms.A cartogram depicting the population distribution between old EU-27 member states in 2008 (including the UK and excluding Croatia). 57.8% of all citizens of the EU live in the four largest member states: Germany, France, Italy, and Spain.The fertility rate in the EU was 1.38 in 2023 (Kindergarten in France).
The demographics of the European Union show a highly populated, culturally diverse union of 27 member states. As of 1 January 2025, the population of the EU is slightly higher than 450million people.[1]
The most populous member state is Germany, with an estimated 83.5million people, and the least populous member state is Malta with 0.57million. Birth rates in the EU are in the low range, with the average woman having 1.6 children. The highest birth rates are found in Ireland with 11.153 births per thousand people per year and in France with 10.862 births. Spain has the lowest birth rate in Europe with 7.816 births per thousand people per year.
The table below uses data from Eurostat. The following is the estimated population of the EU on 1January 2025:[9][10]
Change in life expectancy in the European Union from 2019 to 2021[12]
Most populous areas
The European Union has a significant number of global cities. It contains 13 of the 60 cities that make up the 2008 Global Cities Index[15] as well as 16 of the 41 "alpha" global cities classified by Globalization and World Cities (GaWC) Research Network (including Paris, Milan, Amsterdam and Brussels among others).[16] The following is a list of the ten most populous cities, urban areas, and urban zones in the European Union, together with their population:
The rate of natural change (births as opposed to deaths) was negative for the European Union as a whole in 2022: the population declined by 0.1per cent per year without net migration. Of the most populous countries, particularly Italy (over -0.5 per cent) and Germany (roughly -0.4 per cent) saw a large natural population decrease. Only Malta, France, Sweden, Ireland, Luxembourg and Cyprus had "natural" population growth in 2022. Actual population growth, including migration, was nearly 0.4per cent for the EU, however.
The overall population of the European Union continued to grow until 2020, but since 2021 it has fluctuated between decrease and increase in accordance with migration flows.[32][33]
Migration
The movement of people within the Union i.e. internal migration, remains limited; it has traditionally followed two patterns:
Younger workers from less economically developed regions and countries of the EU tend to move to more prosperous regions in their country or to other EU countries with good economic prospects (i.e. Ireland, Germany, Netherlands, France, Italy, Portugal, Spain, Poland[34])
Retirees from wealthier places with colder weather (i.e. the Low Countries and Germany, among other places) tend to move to the sun belt in southern Europe – i.e. Spain, Portugal, Southern France, Italian peninsula, Croatia, and Greece.
At present, more people immigrate into the European Union than emigrate from it. Immigration is a controversial issue in many member states, including Hungary, Bulgaria, Germany, Italy, Slovakia, Spain, and France.[35][36] It was also a cited as a major factor in the Brexit referendum of 2016.
In 2022, 59.9 million people living in the EU, or 13.35% of the total population, had been born outside their resident country. As of 2019, the largest absolute numbers of people born outside the EU were in Germany (8.4 million), France (6.3 million), Spain (4.6 million), Italy (4.3 million), and the Netherlands (1.7 million).[37]
In 2017, approximately 825,000 persons acquired citizenship of a member state of the European Union, down from 995,000 in 2016.[38] The largest groups were nationals of Morocco, Albania, India, Turkey and Pakistan.[39]
Spain and Italy in particular receives most of the immigrants coming illegally to Europe from Africa, probably due to their large coastal area and their proximity to the African continent. In particular, Spain has land borders with Morocco at Ceuta and Melilla and the Italian island of Lampedusa lies just 113km from Tunisia.
African immigrants try to enter Spain by boat from Morocco or Senegal or by jumping the border fences. Dealing with Italy, immigrants mostly enter by boats from Tunisia and Libya.
Estimates are that between 50,000 and 70,000 people enter the European Union illegally through Spanish borders or beaches. Border fences have been built at both the Ceuta and Melilla borders in an attempt to stop illegal entrance to the country. Illegal immigration is an issue in Spanish politics, and also a big human rights problem, since many people die during the journey. Spain has been Europe's largest absorber of migrants for the past six years, with its immigrant population increasing fourfold as 2.8million people have arrived, mostly from Latin America. Spectacular growth in Spain's immigrant population came as the country's economy created more than half of all the new jobs in the European Union between 2001 and 2006.[40]
The net migration rate for the EU in 2008 was 3.1 per 1,000 inhabitants;[41] this figure is for migration into and out of the European Union, and therefore excludes any internal movements between member states. Annual net migration has varied from 1.5 to 2.0million people since 2003.[41]
Since 2020, EU data is aggregated for the 27 current member states. The UK is no longer a member due to leaving the EU. Population is reported on 1 January[42][43]
The EU has significant religious diversity, mirroring its diverse history and culture. The largest religious group professes Christianity and accounted for 64% of the EU population in 2019,[46] down from 72% in 2012.[47] The largest Christian groups are Roman Catholicism, Protestantism and Eastern Orthodoxy. Several EU nations, for instance Germany[48] and France[49] no longer have a Christian majority. In some countries, the majority of the population has no religious affiliation at all (including Muslim, Buddhist, Judaism, etc.), for instance in Estonia, the Netherlands,[50] and the Czech Republic.
European countries have experienced a decline in church attendance as well as a decline in the number of people professing[51] a religious belief. The 2010 Eurobarometer Poll found that, on average, 51% of the citizens of EU Member States say that they believe there is a God, 26% believe there is some sort of spirit or life force and 20% don't believe there is any sort of spirit, God or life force. 3% declined to answer.[52] These figures show a 2% change from theism to atheism since 2005.[47]
European indigenous (or native) religions are still alive in small and diverse minorities, and some have been revived as Neo-pagan traditions.[53][54] These include, but are not limited to, Sámi neo-shamanism, Danish Asatro,[55] and the Estonian maausulised movement.[53]
The recent influx of immigrants to the affluent EU nations has brought in various religions of their native homelands, including Islam, Hinduism, Buddhism, Sikhism and the Baháʼí Faith. Judaism has had a long history in Europe and has coexisted with the other religions for centuries, despite periods of persecution or genocide by European rulers. Islam too has had a long history in Europe, with Spain and Portugal at one time having a Muslim majority.[56] Large Muslim populations also exist in the Balkans and parts of Eastern Europe, due to a legacy of centuries of Ottoman rule.
The first official language of each of the 27 Member Countries has the status of an official language of the European Union. In total there are 24, with Irish, Bulgarian and Romanian gaining official language status on 1 January 2007, when the last two countries joined the European Union, and Croatian becoming official in 2013.
Before Brexit, English was the most spoken language in the EU, being spoken by around 51% of its population. This high proportion is because 38% of EU citizens speak it as a language other than their mother tongue (i.e. second or foreign language).[6] German is the most spoken first language, spoken by more than 20% of the population following Brexit.
The EU faces challenges in its demographic future. Most concerns center around several related issues: an ageing population, growing life expectancy and immigrant flow.
After hitting a historical low of 1.47 children born per female, the total fertility rate of the EU started to increase again, to reach a level of 1.60 in 2008.[58] The positive trend was observed in all member states with the exception of Luxembourg, Malta and Portugal. The largest increases over this period were observed in Bulgaria (from 1.23 children per woman in 2003 to 1.57 in 2009), Slovenia (from 1.20 to 1.53), the Czech Republic (from 1.18 to 1.49) and Lithuania (from 1.26 to 1.55).[58] In 2009, the Member States with the highest fertility rates were Ireland (2.06), France (2.00), Sweden (1.94), and the United Kingdom (1.90), all approaching the replacement level of 2.1 children born per female.[58] The lowest rates were observed in Latvia (1.31), Hungary and Portugal (both 1.32) and Germany (1.36). The increasing fertility rate has also been accompanied by an upward trend in the natural increase of the population which is due to the moderate increase of the crude birth rate that reached 10.9 births per 1000 inhabitants in 2008, an increase of 0.3 compared with 2007. The increase was observed in all member countries except Germany. The EU crude death rate remained stable at 9.7 per 1000 inhabitants.[41] The relatively low fertility rate means retirement age workers are not entirely replaced by younger workers joining the workforce. The EU faces a potential future dominated by an ever-increasing population of retired citizens, without enough younger workers to fund (via taxes) retirement programs or other state welfare agendas.[59]
A low fertility rate, without supplement from immigration, also suggests a declining overall EU population,[60] which further suggests economic contraction or even a possible economic crisis.[61] Some media have noted the 'baby crisis' in the EU,[62] some governments have noted the problem,[63] and the UN and other multinational authorities have warned of a possible crisis.[64] At this point however such a decrease in the population of the EU is not observed as the overall natural growth remains positive and the EU continues to attract large numbers of immigrants. In 2010, a breakdown of the population by citizenship showed that there were 20.1 million foreign citizens living in the EU representing 4% of the population.[58]
Over the last 50 years, life expectancy at birth in the EU27 has increased by around 10 years for both women and men, to reach 82.4 years for women and 76.4 years for men in 2008. The life expectancy at birth rose in all Member States, with the largest increases for both women and men recorded in Estonia and Slovenia.[58]
Population projections
In 2017, Eurostat released yearly projections up to 2080.
There is no precise or universally accepted definition of the terms "ethnic group" or "nationality". In the context of European ethnography in particular, the terms ethnic group, people (without nation state), nationality, national minority, ethnic minority, linguistic community, linguistic group and linguistic minority are used as mostly synonymous, although preference may vary in usage with respect to the situation specific to the individual countries of Europe.[66]
Defining ethnic composition requires defining ethnic minority groups. The European Commission-funded European Social Survey considered three different ways to define ethnic minority groups:[67]
Citizenship, useful in western Europe but inadequate in eastern Europe when discussing certain social issues
Country of birth in combination with country of birth of the parents, which gives three classes: native background, western foreign background, and non-western background with two levels: first generation (foreign born) and second generation (born in the country)
Membership of a minority group within a country, as measured by a direct question.
The main EU statistics published by Eurostat focus on citizenship and country of birth.
Nationality
The largest groups, together accounting for about 90% of people in the European Union, are:
In 2011, almost a quarter of new EU citizens were Moroccans, Turks, Ecuadorians or Indians. The new citizens in the old EU27 in 2011 were mainly Africans (26% of the total number of citizenships acquired), Asians (23%), non-EU27 Europeans (19%), North and South Americans (17%) or another EU27 Member State (11%). In 2011, the largest groups that acquired citizenship of an EU27 Member State were citizens of Morocco (64 300 persons, of which 55% acquired citizenship of France or Spain), Turkey (48 900, 58% acquired German citizenship), Ecuador (33 700, 95% acquired Spanish citizenship) and India (31 700, 83% acquired British citizenship).[69]
In 2012, 34.3 million foreign citizens lived in the old 27 European Union member states, accounting for 6.8% of the European Union population,[70] of whom 20.5 million were third country nationals (i.e. nationals of non-EU countries). The number of foreign-born (which includes those who have naturalised or are dual nationals) was 48.9 million or 9.7 per cent of the total population.[71]
A total of 8.0 million citizens from European countries outside of the old EU-27 were residing in the EU at the beginning of 2012; among these more than half were citizens of Turkey, Albania or Ukraine. The next biggest group was from Africa (24.5%), followed by Asia (22.0%), the Americas (14.2%) and Oceania (0.8%). Romanians (living in another EU Member State) and Turkish citizens made up the biggest groups of non-nationals living in the EU-27 in 2012. There were 4.4 million Romanian citizens living outside of Romania within the EU-27 and 2.3 million Turkish citizens living in the EU-27; each of these two groups of people accounted for 7.0% of all foreigners living in the EU-27 in 2012. The third largest group was Moroccans (1.9 million people, or 5.6% of all foreigners).[72]
Approximately 20 million non-Europeans live in the EU, 4% of the overall population prior to Brexit.[73]
Future
On current (2015) trends, European populations will become more ethnically diverse, with the possibility that today's majority ethnic groups will no longer comprise a numerical majority in some countries.[74]
Miscellaneous statistics
Life expectancy and healthy life expectancy in the European Union in 2019Elaboration by sex
↑United Nations Population Division (21 March 2000). "European Union". Replacement Migration(PDF). pp.85–91. ESA/P/WP.160. Archived from the original(PDF) on 15 April 2003. Retrieved 15 February 2018.
This page is based on this Wikipedia article Text is available under the CC BY-SA 4.0 license; additional terms may apply. Images, videos and audio are available under their respective licenses.


