Demographic history of North Macedonia

Last updated

This article presents the demographic history of North Macedonia through census results since 1948.

Contents

1948 census

1953 census

1961 census

1971 census

1981 census

Ethnic map of North Macedonia, according to the 1981 census Macedonia ethnic.png
Ethnic map of North Macedonia, according to the 1981 census

1991 census

1994 census

2002 census

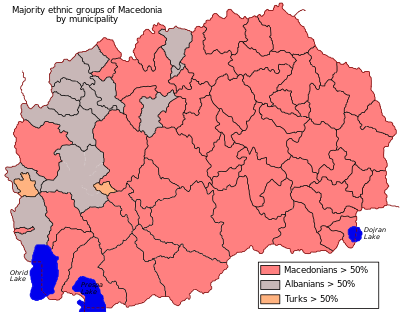
Ethnic groups in North Macedonia, according to the 2002 census Map of the majority ethnic groups of Macedonia by municipality.svg
Ethnic groups in North Macedonia, according to the 2002 census

2021 census

Ethnicity [1] Number%
Total1836713100
Macedonians 107329958.44
Albanians 44624524.30
Turks 709613.86
Romani 464332.53
Serbs 238471.30
Bosniaks 160420.87
Aromanians 87140.47
Torbesh 41740.23
Bulgarians 35040.19
Egyptians 24060.13
Croats 21450.12
Muslims 11870.06
Montenegrins 10230.06
Macedonian Muslims 4550.02
Unknown4720.03
Others29870.16
Non-declared4500.02
Regionally affiliated1100.01
Persons for whom data were obtained from administrative sources132 2607.20

See also

References

  1. "Census of Population, Households and Dwellings in the Republic of North Macedonia, 2021 - first dataset" (PDF). State Statistical Office. 30 March 2022. Retrieved 30 March 2022.