Results maps
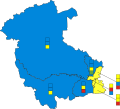 2017 results map
Stirling Council in Scotland holds elections every five years, previously holding them every four years from its creation as a single-tier authority in 1995 to 2007.
| Year | SNP | Conservative | Labour | Independent |
|---|---|---|---|---|
| 1974 | 4 | 8 | 7 | 1 |
| 1977 | 4 | 8 | 7 | 1 |
| 1980 [a] | 0 | 9 | 10 | 1 |
| 1984 | 0 | 8 | 11 | 1 |
| 1988 | 0 | 10 | 10 | 0 |
| 1992 | 0 | 10 | 10 | 0 |
| Year | SNP | Conservative | Labour | Green | Liberal Democrats | Independent |
|---|---|---|---|---|---|---|
| 1995 | 2 | 7 | 13 | 0 | 0 | 0 |
| 1999 [a] | 2 | 9 | 11 | 0 | 0 | 0 |
| 2003 | 0 | 10 | 12 | 0 | 0 | 0 |
| 2007 [b] | 7 | 4 | 8 | 0 | 3 | 0 |
| 2012 | 9 | 4 | 8 | 1 | 0 | 0 |
| 2017 [c] | 9 | 9 | 4 | 1 | 0 | 0 |
| 2022 | 8 | 7 | 6 | 1 | 0 | 1 |

| Party | Candidate | Votes | % | ±% | |
|---|---|---|---|---|---|
| SNP | Scott Farmer [5] | 374 | 38.8 | +16.5 | |
| Labour | 335 | 34.8 | −16.1 | ||
| Liberal Democrats | 165 | 17.1 | +9.1 | ||
| Conservative | 57 | 5.9 | −5.8 | ||
| New Party | 18 | 1.9 | +1.9 | ||
| Independent | 14 | 1.5 | +1.5 | ||
| Majority | 39 | 4.0 | |||
| Turnout | 963 | ||||
| SNP gain from Labour | Swing | ||||
| Party | Candidate | FPv% | Count | |||||||
|---|---|---|---|---|---|---|---|---|---|---|
| 1 | 2 | 3 | 4 | 5 | 6 | 7 | ||||
| Labour | Violet Weir | 39.9 | 1,131 | 1,134 | 1,141 | 1,162 | 1,175 | 1,196 | 1,288 | |
| SNP | Bill McDonald | 37.6 | 1,067 | 1,072 | 1,078 | 1,095 | 1,110 | 1,162 | 1,228 | |
| Independent | Tommy Brookes | 8.1 | 229 | 232 | 235 | 240 | 272 | 303 | ||
| Conservative | Catherine Berrill | 6.1 | 173 | 176 | 178 | 194 | 201 | |||
| Independent | Breda O'Brien | 3.1 | 89 | 94 | 96 | 99 | ||||
| Liberal Democrats | Ethne Brown | 2.9 | 82 | 83 | 91 | |||||
| Green | Duncan Illingsworth | 1.3 | 36 | 36 | ||||||
| Independent | Paul Campbell | 1.0 | 28 | |||||||
| Labour hold | ||||||||||
| Valid: 2,835 Quota: 1,419 | ||||||||||
| Party | Candidate | FPv% | Count | |||
|---|---|---|---|---|---|---|
| 1 | 2 | 3 | ||||
| SNP | Gerry McLaughlan | 45.2 | 1,311 | 1,367 | 1,388 | |
| Labour | Chris Kane | 37.7 | 1,094 | 1,134 | 1,272 | |
| Conservative | Luke Davison | 11.8 | 343 | 352 | ||
| Green | Alasdair Tollemache | 5.2 | 152 | |||
| SNP hold | ||||||
| Valid: 2,900 Spoilt: 28 Quota: 1,451 Turnout: 2,928 | ||||||
| Party | Candidate | FPv% | Count | |||||
|---|---|---|---|---|---|---|---|---|
| 1 | 2 | 3 | 4 | 5 | ||||
| Conservative | Jane Hutchison | 39.5 | 3,195 | 3,260 | 3,297 | 3,717 | 4,575 | |
| SNP | Paul Goodwin | 32.6 | 2,636 | 2,657 | 3,090 | 3,445 | ||
| Labour | Colin O'Brien | 14.5 | 1,172 | 1,259 | 1,439 | |||
| Green | Wendy Faulkner | 9.3 | 754 | 830 | ||||
| Liberal Democrats | James Maclaren | 4.1 | 332 | |||||
| Conservative gain from SNP | ||||||||
| Valid: 8,089 Spoilt: 74 Quota: 4,045 Turnout: 8,163 | ||||||||
| Party | Candidate | FPv% | Count | ||||||
|---|---|---|---|---|---|---|---|---|---|
| 1 | 2 | 3 | 4 | 5 | 6 | ||||
| Conservative | Robin Kleinman | 41.0 | 1,832 | 1,849 | 1,861 | 1,959 | 2,172 | 2,473 | |
| SNP | Ahsan Khan | 26.9 | 1,202 | 1,205 | 1,416 | 1,491 | 1,683 | ||
| Labour | David Wilson | 13.4 | 600 | 609 | 670 | 871 | |||
| Liberal Democrats | Dick Moerman | 8.9 | 399 | 404 | 475 | ||||
| Green | Clare Andrews | 8.7 | 389 | 390 | |||||
| Scottish Family | Nickie Willis | 1.1 | 50 | ||||||
| Conservative gain from SNP | |||||||||
| Valid: 4,074 Spoilt: 26 Quota: 2,237 Turnout: 4,100 | |||||||||
| Party | Candidate | FPv% | Count | ||||||
|---|---|---|---|---|---|---|---|---|---|
| 1 | 2 | 3 | 4 | 5 | 6 | ||||
| Conservative | Thomas Heald | 37.8 | 1,644 | 1,653 | 1,714 | 1,738 | 1,998 | 2,286 | |
| SNP | Ahsan Khan | 23.3 | 1,000 | 1,006 | 1,037 | 1,266 | 1,531 | ||
| Labour | David Wilson | 20.2 | 869 | 874 | 989 | 1,147 | |||
| Green | Clare Andrews | 10.1 | 433 | 442 | 485 | ||||
| Liberal Democrats | Dick Moerman | 6.8 | 292 | 296 | |||||
| Scottish Family | Michael Willis | 1.2 | 50 | ||||||
| Conservative hold | |||||||||
| Valid: 4,288 Spoilt: 27 Quota: 2,145 Turnout: 4,315 | |||||||||
| Party | Candidate | FPv% | Count | ||||||
|---|---|---|---|---|---|---|---|---|---|
| 1 | 2 | 3 | 4 | 5 | 6 | ||||
| Labour | David Wilson | 23.3 | 952 | 981 | 1,101 | 1,390 | 1,826 | 2,252 | |
| Conservative | Stuart McLuckie | 27.9 | 1,143 | 1,214 | 1,284 | 1,328 | 1,361 | ||
| SNP | John Watson | 18.8 | 770 | 793 | 826 | 1,076 | |||
| Green | Andrew Adam | 16.1 | 659 | 670 | 760 | ||||
| Liberal Democrats | Dick Moerman | 8.4 | 345 | 382 | |||||
| Independent | Alastair Majury | 5.5 | 225 | ||||||
| Labour hold | |||||||||
| Valid: 4,094 Spoilt: 21 Quota: 2,048 Turnout: 4,115 | |||||||||
| Party | Candidate | FPv% | Count | ||||||
|---|---|---|---|---|---|---|---|---|---|
| 1 | 2 | 3 | 4 | 5 | 6 | ||||
| SNP | Bob Buchanan | 35.9 | 565 | 590 | 597 | 605 | 664 | 863 | |
| Labour | Yvonne Dickson | 23.9 | 376 | 384 | 401 | 448 | 528 | ||
| Reform | William Docherty | 22.7 | 358 | 360 | 367 | 425 | |||
| Conservative | Moira Benny | 10.7 | 169 | 171 | 186 | ||||
| Liberal Democrats | William Galloway | 3.5 | 55 | 65 | |||||
| Green | Marie Stadtler | 3.4 | 53 | ||||||
| SNP gain from Labour | |||||||||
| Valid: 1,576 Spoilt: 22 Quota: 789 Turnout: 1,598 | |||||||||
| Party | Candidate | FPv% | Count | ||||||
|---|---|---|---|---|---|---|---|---|---|
| 1 | 2 | 3 | 4 | 5 | 6 | ||||
| SNP | Josh Fyvie | 36.4 | 808 | 813 | 827 | 905 | 988 | 1,245 | |
| Labour | Yvonne Dickson | 23.9 | 530 | 540 | 577 | 622 | 710 | ||
| Reform | William Docherty | 23.3 | 517 | 523 | 572 | 578 | |||
| Green | Marie Stadtler | 6.3 | 141 | 158 | 167 | ||||
| Conservative | James Corbett | 6.6 | 147 | 156 | |||||
| Liberal Democrats | William Galloway | 3.6 | 79 | ||||||
| SNP gain from Conservative | |||||||||
| Electorate: 8,662 Valid: 2,222 Spoilt: 28 Quota: 1,112 Turnout: 2,250 | |||||||||