1964 United Kingdom general election in Scotland

Last updated

1964 United Kingdom general election
Flag of Scotland.svg
  1959 15 October 1964 1966  

All 71 Scottish seats to the House of Commons
 First partySecond partyThird party
  Harold Wilson.jpg Alec Douglas-Home.jpg Jo Grimond in 1963 (3x4 crop).jpg
Leader Harold Wilson Alec Douglas-Home Jo Grimond
Party Labour Unionist Liberal
Last election38 seats, 46.7%31 seats, 47.3%1 seat, 4.1%
Seats won4324 [a] 4
Seat changeIncrease2.svg5Decrease2.svg7Increase2.svg 3
Popular vote1,283,6671,069,695200,063
Percentage48.7%40.6%7.6%
SwingIncrease2.svg2.0%Decrease2.svg6.7%Increase2.svg3.5%

United Kingdom general election 1964 in Scotland.svg
Results of the 1964 election in Scotland
  Conservative/Unionist
  Labour
  Liberal

A general election was held in the United Kingdom on Thursday, 15 October 1964 and all 71 seats in Scotland were contested. [1] The election saw both Labour and the Liberals pick up seats from the Unionists. The National Liberals, who were aligned with the Unionists, lost all their remaining seats.

Contents

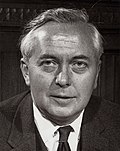
Combined with results from across the UK, the election resulted in the Conservative and Unionist Party, led by incumbent Prime Minister Alec Douglas-Home, narrowly losing to Labour Party, led by Harold Wilson; Labour secured a parliamentary majority of four seats and ended a thirteen-year period in opposition. Wilson became the youngest Prime Minister since Lord Rosebery in 1894.

The election was the last election fought by the Unionists as a separate party. From April 1965 the party was renamed as the Scottish Conservative and Unionist Party, and became the Scottish branch of the UK Conservative Party. [2] [3]

MPs

List of MPs for constituencies in Scotland (1964–1966)

Results

PartySeatsSeats changeVotes % % Change
  Labour Party 43Increase2.svg51,283,66748.7Increase2.svg2.0
  Conservative and Unionist (Total) 24Decrease2.svg71,069,69540.6Decrease2.svg6.7
  Unionist 24Decrease2.svg 1981,64137.3Decrease2.svg 2.5
  National Liberal & Conservative 0Decrease2.svg 688,0543.3Decrease2.svg 4.2
  Liberal 4Increase2.svg 3200,0637.6Increase2.svg 3.5
  SNP 0Steady2.svg64,0442.4Increase2.svg 1.6
  Communist 0Steady2.svg12,2410.5Steady2.svg 0.0
 Other0Steady2.svg4,8290.2Increase2.svg 0.1
Total712,634,539100

Votes summary

Popular vote [a]
Labour
48.72%
Unionist
40.60%
Liberal
7.59%
SNP
2.43%
Other
0.64%
Parliamentary seats [a]
Labour
60.56%
Unionist
33.80%
Liberal
5.63%

Notes

  1. 1 2 3 The seat and vote count figures for the Unionists given here include the National Liberals

References

  1. "Commons results report" (PDF). House of Commons Information Office. May 2010. ISSN   0144-4689. Archived (PDF) from the original on 12 November 2020.
  2. Torrance, David (April 2018). "'Standing up for Scotland': The Scottish Unionist Party and 'nationalist unionism', 1912–68". Scottish Affairs. 27 (2): 180. doi:10.3366/scot.2018.0235 via Edinburgh University Press.
  3. Urwin, D.W. (1 June 1966). "Scottish Conservatism: A Party Organization in Transition" . Political Studies. 14 (2): 145–162. doi:10.1111/j.1467-9248.1966.tb00399.x . Retrieved 20 November 2024.