| |||||||||||||||||||||||||||||||||||||||||||||||
| |||||||||||||||||||||||||||||||||||||||||||||||
25 of the 69 seats to the Edinburgh Corporation 35 seats needed for a majority | |||||||||||||||||||||||||||||||||||||||||||||||
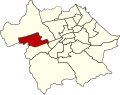
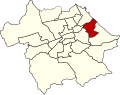
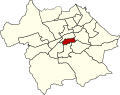
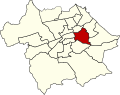
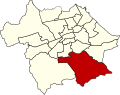
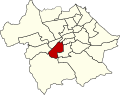
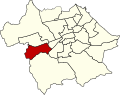
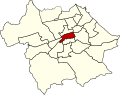
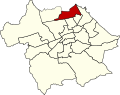
---|---|---|---|---|---|---|---|---|---|---|---|---|---|---|---|---|---|---|---|---|---|---|---|---|---|---|---|---|---|---|---|---|---|---|---|---|---|---|---|---|---|---|---|---|---|---|---|
| |||||||||||||||||||||||||||||||||||||||||||||||
Results by ward. | |||||||||||||||||||||||||||||||||||||||||||||||
|
An Election to the Edinburgh Corporation was held on 2 May 1967, alongside municipal elections across Scotland. Of the councils 69 seats, 24 were up for election; two in Liberton and St. Andrew's wards, and one in every other ward.
After the election Edinburgh Corporation wa composed of 37 Progressives, 29 Labour councillors, 2 Conservatives, and 1 Liberal. The Progressives increased their majority to three seats.
Party | Seats | Gains | Losses | Net gain/loss | Seats % | Votes % | Votes | +/− | |
---|---|---|---|---|---|---|---|---|---|
Progressives | 14 | 2 | 1 | 1 | 56.0 | 44.4 | 50,655 | ||
Labour | 9 | 0 | 3 | 3 | 28.1 | 32,084 | 36.0 | ||
Conservative | 2 | 2 | 0 | 2 | 0.0 | 6.7 | 7,588 | 8.0 | |
Liberal | 0 | 0 | 0 | 10.3 | 11,772 | ||||
SNP | 0 | 0 | 0 | 0.0 | 7.8 | 8,870 | |||
Communist | 0 | 0 | 0 | 0.0 | 2.7 | 3,045 |
Party | Candidate | Votes | % | |
---|---|---|---|---|
Progressives | Leonard A. Bailey | 2,464 | ||
Liberal | Eric W. Hall | 1,603 | ||
Labour | Ian R. Hoy | 1,154 | ||
Majority | 861 | |||
Progressives hold |
Party | Candidate | Votes | % | |
---|---|---|---|---|
Progressives | Catherine B. M. Filsell | 5,327 | ||
Labour | James E. Boyack | 1,886 | ||
Majority | 3441 | |||
Labour hold |
Party | Candidate | Votes | % | |
---|---|---|---|---|
Labour | Barbara Woodburn | 1,472 | ||
SNP | Mary G. Thomson | 1,377 | ||
Communist | Theodore C. Taylor | 153 | ||
Majority | 95 | |||
Labour hold |
Party | Candidate | Votes | % | |
---|---|---|---|---|
Progressives | Victor J. Symes | 2,223 | ||
Labour | Philip S. Wood | 2,023 | ||
Majority | 200 | |||
Progressives gain from Labour | ||||
Party | Candidate | Votes | % | |
---|---|---|---|---|
Progressives | Rupert Speyer | 3,682 | ||
Liberal | Thomas M. Frew | 2,122 | ||
SNP | William W. Neil | 1,696 | ||
Majority | 1,560 | |||
Progressives hold |
Party | Candidate | Votes | % | |
---|---|---|---|---|
Labour | Phyllis Herriot | 1,857 | ||
Conservative | Geraldine R. Johnston | 293 | ||
Majority | 1,564 | |||
Labour hold |
Party | Candidate | Votes | % | |
---|---|---|---|---|
Labour | John Kane | 2,842 | ||
Communist | Geraldine R. Johnston | 2,534 | ||
Majority | 308 | |||
Labour hold |
Party | Candidate | Votes | % | |
---|---|---|---|---|
Progressives | James Slack | 1,803 | ||
Labour | George Foulkes | 788 | ||
Liberal | Fiona M. Cowles | 602 | ||
Majority | 1,015 | |||
Progressives hold |
Party | Candidate | Votes | % | |
---|---|---|---|---|
Labour | Donald M. Swanson | 1,988 | ||
Progressives | Mary A. M. Hislop | 1,463 | ||
Liberal | Raymond T. Barker | 689 | ||
Majority | 525 | |||
Labour hold |
Party | Candidate | Votes | % | |
---|---|---|---|---|
Labour | Patrick Rogan | 1,307 | ||
Conservative | Anthony H. Lester | 702 | ||
Liberal | Robert E. Bell | 540 | ||
Majority | 605 | |||
Labour hold |
Party | Candidate | Votes | % | |
---|---|---|---|---|
Conservative | David M. Burnside | 3,801 | ||
Labour | Peter Wilson | 3,047 | ||
SNP | William T. Telford | 2,726 | ||
Labour | Eva Gibbons | 2,402 | ||
Turnout | ||||
Conservative gain from Labour | ||||
Labour hold |
Party | Candidate | Votes | % | |
---|---|---|---|---|
Progressives | Mauricde Heggie | 2,920 | ||
Liberal | Joyce Shein | 2,325 | ||
Majority | 595 | |||
Progressives hold |
Party | Candidate | Votes | % | |
---|---|---|---|---|
Progressives | Nansi H. Mansbridge | 4,017 | ||
SNP | Ian A. Macdonald | 832 | ||
Liberal | Thomas Glen | 510 | ||
Labour | Jhn C. Campbell | 396 | ||
Majority | 3,185 | |||
Progressives hold |
Party | Candidate | Votes | % | |
---|---|---|---|---|
Progressives | Robert M. Knox | 5,712 | ||
Labour | Thomas H. Greig | 1,705 | ||
Majority | 4,007 | |||
Progressives hold |
Party | Candidate | Votes | % | |
---|---|---|---|---|
Progressives | G. Hedderwick | 4,498 | ||
Liberal | J. Grahamslaw | 1,283 | ||
Labour | D. E. S. Truman | 1,175 | ||
Majority | 3,215 | |||
Progressives hold |
Party | Candidate | Votes | % | |
---|---|---|---|---|
Labour | Magnus J. Williamson | 1,975 | ||
SNP | William Thomason | 1,509 | ||
Communist | Charles McManus | 358 | ||
Majority | 466 | |||
Labour hold |
Party | Candidate | Votes | % | |
---|---|---|---|---|
Progressives | Archibald D. Jameson | 3,380 | ||
SNP | Adam A. D. Hare | 1,494 | ||
Labour | Ronald D. M. Brown | 997 | ||
Majority | 1,886 | |||
Progressives hold |
Party | Candidate | Votes | % | ||
---|---|---|---|---|---|
Labour | Isobella O. M. Stewart | Unopposed | |||
Labour hold |
Party | Candidate | Votes | % | |
---|---|---|---|---|
Progressives | Thomas S. Ramage | 2,430 | ||
Labour | Anne K. R. Simpson | 2,234 | ||
SNP | Douglas S. Walker | 1,181 | ||
Majority | 196 | |||
Progressives gain from Labour | ||||
Party | Candidate | Votes | % | |
---|---|---|---|---|
Conservative | Ronald R. Duff | 2,144 | ||
Progressives | Craig H. Richards | 1,067 | ||
Progressives | Roger O. S. Miller | 850 | ||
SNP | Francis C. Yeoman | 781 | ||
Labour | Gavid Kennedy | 599 | ||
Labour | Ernest Arden | 552 | ||
Conservative gain from Progressives | ||||
Progressives hold |
Party | Candidate | Votes | % | |
---|---|---|---|---|
Progressives | John Millar | 3,105 | ||
Liberal | William Murray | 2,098 | ||
Labour | Christopher Harvie | 1,256 | ||
Majority | 1,007 | |||
Progressives hold |
Party | Candidate | Votes | % | |
---|---|---|---|---|
Labour | Charles R. Stuart | 1,166 | ||
Conservative | George T. Edwards | 941 | ||
Majority | 225 | |||
Labour hold |
Party | Candidate | Votes | % | |
---|---|---|---|---|
Progressives | Margaret B. A. Ross | 4,030 | ||
Labour | Ian M. Christie | 1,232 | ||
Majority | 2,798 | |||
Progressives hold |
The Metropolitan Borough of Hackney was a Metropolitan borough of the County of London from 1900 to 1965. Its area became part of the London Borough of Hackney.
Edinburgh South is a constituency of the House of Commons of the UK Parliament created in 1885. The constituency has been held by Scottish Labour since 1987, being represented by Ian Murray since 2010. Murray was the only Labour MP in Scotland to retain his seat at the 2015 and 2019 general elections.
Edinburgh West is a burgh constituency of the House of Commons of the Parliament of the United Kingdom, first contested at the 1885 general election.
Siliguri is an assembly constituency in Darjeeling district in the Indian state of West Bengal.
The City of Edinburgh Council is the local government authority for the City of Edinburgh. It was created in 1996 under the Local Government etc. (Scotland) Act 1994, with the boundaries of the post-1975 City of Edinburgh District Council of the Lothian region.
An Election to the Edinburgh Corporation was held on 7 May 1968, alongside municipal elections across Scotland. Of the councils 69 seats, 22 were up for election. Despite receiving the most votes of any single party, the SNP won only 7 seats. Unlike in Glasgow, the Progressives and Conservatives did not run on a joint ticket. Despite that however the parties only ran competing candidates in the Gorgie-Dalry ward.
An Election to the Edinburgh Corporation was held on 6 May 1969, alongside municipal elections across Scotland. Of the councils 69 seats, 23 were up for election.
An Election to the Edinburgh Corporation was held on 2 May 1972, alongside municipal elections across Scotland. Of the councils 69 seats, 23 were up for election.
An Election to the Edinburgh Corporation was held on 1 May 1973, alongside municipal elections across Scotland. Of the councils 69 seats, 26 were up for election. Labour, despite needing only 1 gain to take control of the council, failed to do so, preventing them from a historic win.
An election to the Dundee Corporation was held on 1 May 1973, alongside municipal elections across Scotland. 13 of the corporation's 36 seats were up for election.
Elections to the Corporation of the City of Glasgow were held on Tuesday 3 November 1896, alongside municipal elections across Scotland, and the wider British local elections.
9 seats, 23 were up for election.
An election to Edinburgh Corporation was held on 4 May 1971, alongside municipal elections across Scotland. Of the council's 68 seats, 23 were up for election.
Elections to Edinburgh Corporation were held on 3 May 1960, alongside municipal elections across Scotland. Of the councils 69 seats, 24 were up for election, including two seats in Murrayfield-Cramond ward. However only 15 wards in 14 seats were contested, as councillors were returned unopposed in nine wards.
Elections to Edinburgh Corporation were held on 2 May 1961, alongside municipal elections across Scotland. Of the councils 69 seats, 23 were up for election. However, only 16 seats were contested, as councillors were returned unopposed in seven wards.
An Election to the Edinburgh Corporation was held on 1 May 1962, alongside municipal elections across Scotland. Of the councils 69 seats, 23 were up for election.
An Election to the Edinburgh Corporation was held on 7 May 1963, alongside municipal elections across Scotland. Of the councils 69 seats, 23 were up for election.
An Election to the Edinburgh Corporation was held on 5 May 1964, alongside municipal elections across Scotland. Of the councils 69 seats, 23 were up for election.
An Election to the Edinburgh Corporation was held on 4 May 1965, alongside municipal elections across Scotland. Of the councils 69 seats, 23 were up for election.
An Election to the Edinburgh Corporation was held on 3 May 1966, alongside municipal elections across Scotland. Of the councils 69 seats, 23 were up for election.